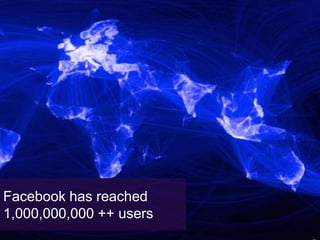
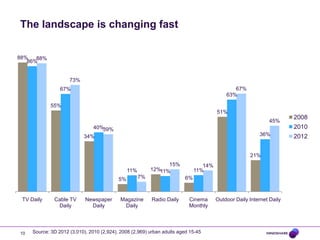
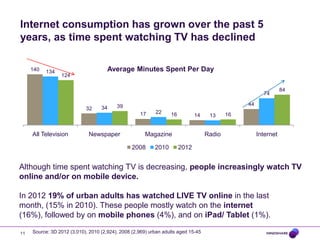
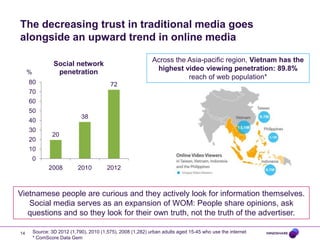
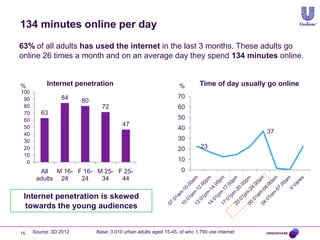
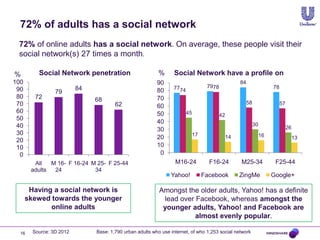
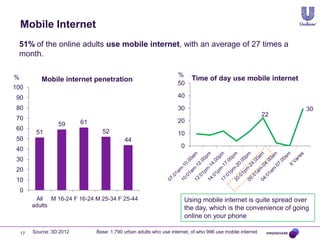
Digital 2013
Mindshare
In 1996 it took 25 mins to
download 1 songโ€ฆ
โ€ฆNow it takes 25 seconds
                                                                       on your mobile phone
3
To update this brand zone text, on the Insert tab, click Header & Footer
Facebook has reached
1,000,000,000 ++ users
Heโ€™s made a lot of money
  5   To update this brand zone text, on the Insert tab, click Header & Footer
How many of you knew this
    guy 1 year ago?
6
The world is going through a
 period of profound change


7
To update this brand zone text, on the Insert tab, click Header & Footer
Itโ€™s happening quickly and
itโ€™s driven by technology and
the internet
What does this
mean for
Vietnam?
The landscape is changing fast

88%   88%
   86%


                     73%
                 67%                                                                          67%
                                                                                           63%

             55%
                                                                                       51%
                                                                                                                      2008
                                                                                                              45%
                              40%39%                                                                                  2010
                           34%                                                                           36%          2012

                                                                                                     21%
                                                                 15%             14%
                                                11%        12%11%             11%
                                           5%         7%                 6%


 TV Daily     Cable TV      Newspaper       Magazine       Radio Daily    Cinema       Outdoor Daily Internet Daily
               Daily          Daily          Daily                        Monthly


10   Source: 3D 2012 (3,010), 2010 (2,924), 2008 (2,969) urban adults aged 15-45
Internet consumption has grown over the past 5
years, as time spent watching TV has declined

     140   134                        Average Minutes Spent Per Day
                 124

                                                                                                                84
                                                                                                       74

                                          39                                                    44
                            32     34
                                                    17     22     16                       16
                                                                              14    13


     All Television           Newspaper                Magazine                    Radio             Internet

                                                 2008      2010        2012


Although time spent watching TV is decreasing, people increasingly watch TV
online and/or on mobile device.

In 2012 19% of urban adults has watched LIVE TV online in the last
month, (15% in 2010). These people mostly watch on the internet
(16%), followed by on mobile phones (4%), and on iPad/ Tablet (1%).

11   Source: 3D 2012 (3,010), 2010 (2,924), 2008 (2,969) urban adults aged 15-45
The increase in time spent online compared with time
spent watching TV is most visible amongst Men 25-34

                  M 16-24                                                             F 16-24
                                                                         147
       130 135 126                 127                                         137
                                                                                     126
                             117
                                                                                                 102 104
                        85                 2008
                                           2010                                            63

                                           2012


             TV          Internet                                              TV           Internet
          -4min              +42min                                          -21min             +41min


                  M 25-34                                                             F 25-44
       134                                                               146
                                                                               136 129
             118 113
                                   103
                             81

                        45                                                                             57
                                                                                                  42
                                                                                           22


             TV           Internet                                             TV               Internet
          -21min             +58min                                          -17min             +35min

12   Source: 3D 2012 (3,010), 2010 (2,924), 2008 (2,969) urban adults aged 15-45
Changing attitudes towards media and advertisement

                                                                                                         The last 5 years
                                  2012                                       41
 โ€œTV commercials                                                                                             show a
 provide truthful                 2010                                             48
 informationโ€                     2008                                                  50
                                                                                                          downward
                                  2012                                              49
                                                                                                        trend in trust in
 โ€œI trust TV news to                                                                                     advertisement
                                  2010                                                        57
 report accuratelyโ€                                                                                      and traditional
                                  2008                                                             62
                                                                                                            media.
                                  2012                                             47
 โ€œI trust newspapers to
 report accuratelyโ€               2010                                                  51              Urban adults donโ€™t
                                  2008                                                       55          just believe what
                                  2012                                        43                           they are being
 โ€œI like watching TV                                                                                        told anymore.
                                  2010                                              49
 advertisingโ€
                                  2008                                                             61     The number of
                                                                                                        people who like TV
                                  2012                                                            60
 โ€œI have less and less
                                                                                                         advertising has
                                  2010                                                       54              dropped
 trust in companies and
 brandsโ€                          2008                                                   53                significantly

                                          0             20              40                    60           80 %

13   Source: 3D 2012 (3,010), 2010 (2,924), 2008 (2,969) urban adults aged 15-45
The decreasing trust in traditional media goes
alongside an upward trend in online media

                                                              Across the Asia-pacific region, Vietnam has the
                  Social network
     %             penetration                                 highest video viewing penetration: 89.8%
                                                                         reach of web population*
     80                                    72
     70
     60
     50
                              38
     40
     30
                 20
     20
     10
         0
                2008         2010         2012


Vietnamese people are curious and they actively look for information themselves.
   Social media serves as an expansion of WOM: People share opinions, ask
   questions and so they look for their own truth, not the truth of the advertiser.

14       Source: 3D 2012 (1,790), 2010 (1,575), 2008 (1,282) urban adults aged 15-45 who use the internet
         * ComScore Data Gem
134 minutes online per day
63% of all adults has used the internet in the last 3 months. These adults go
online 26 times a month and on an average day they spend 134 minutes online.


%          Internet penetration                                   %        Time of day usually go online
100
 90              84                                              70
                        80
 80                            72                                60
 70      63
 60                                                              50
 50
                                        47
                                                                 40
 40                                                                                           37
 30                                                              30
 20                                                              20        23
 10
  0                                                              10
        All M 16- F 16- M 25- F 25-                                0
       adults 24   24    34    44

 Internet penetration is skewed
  towards the young audiences


15    Source: 3D 2012        Base: 3,010 urban adults aged 15-45, of who 1,790 use internet
72% of adults has a social network
 72% of online adults has a social network. On average, these people visit their
 social network(s) 27 times a month.

%         Social Network penetration                       %      Social Network have a profile on
100                                                       90                                         84
                          84                                      7774              7978                                 78
 90              79                                       80
 80      72                    68                         70
 70                                    62                                                                 58                  57
                                                          60
 60                                                       50             45                42
 50
                                                          40                                                   30
 40                                                                                                                                26
                                                          30
 30                                                                           17                                    16
 20                                                       20                                    14                                      13
 10                                                       10
  0                                                        0
        All   M 16- F 16-24 M 25- F 25-44                         M16-24             F16-24          M25-34               F25-44
       adults  24            34
                                                                Yahoo!             Facebook          ZingMe              Google+

       Having a social network is                          Amongst the older adults, Yahoo! has a definite
      skewed towards the younger                            lead over Facebook, whereas amongst the
             online adults                                  younger adults, Yahoo! and Facebook are
                                                                      almost evenly popular.

  16    Source: 3D 2012        Base: 1,790 urban adults who use internet, of who 1,253 social network
Mobile Internet
 51% of the online adults use mobile internet, with an average of 27 times a
 month.

%                                                                   %
            Mobile internet penetration                                    Time of day use mobile internet
                                                                    50
100
 90                                                                 40
 80                                                                 30                                           30
                                                                                                            22
 70                                                                 20
                   59      61
 60                               52
          51                                                        10
 50                                         44
 40                                                                   0

 30
 20
 10
    0
          All M 16-24 F 16-24 M 25-34 F 25-44                          Using mobile internet is quite spread over
         adults                                                        the day, which is the convenience of going
                                                                       online on your phone

    17   Source: 3D 2012        Base: 1,790 urban adults who use internet, of who 996 use mobile internet
People read newspapers cross platform

%
90
      80                                              More females than males read hard copy
80                                                newspapers, whereas males are more likely to
70                                                     read a newspaper website than females.
60                       56
                                                   Reading the news via appโ€™s is still very low
50                                              amongst Vietnamese adults. Males, and especially
40                                                young males, are more likely to use newspaper
30
                                                                                          apps.
20

10                                         5
                                                           2                2           2           2
0
      A hard copy Newspaper Smartphone iPad/tablet Shared links                          Email          Other
                   website     app        app                                           bulletins
                              All adults       M16-24          F16-24      M25-34      F25-44


 18    Source: 3D 2012              Base: 2,118 urban adults who read/buy newspapers
โ€ฆand magazines

                                               More females than males read hard copy
%                                       magazines, especially the 25-45 females. Males are
100                                           more likely to read a magazine online than
                                                                                  females.
 90
         82
 80
                                        Reading magazines via appโ€™s is still low, but there
 70                                        is a skew towards the young females and males.
 60
                               48
 50
 40
 30
 20
 10                                                   7
                                                                                2             3
    0
          A hard copy        Magazine website Smartphone app                iPad/tablet app       Other


                          All adults     M16-24           F16-24       M25-34       F25-44

 19     Source: 3D 2012         Base: 898 urban adults who read/buy magazines
Radio is consumed through mobile phones
32% of the urban adults has listened to the radio in the last month. These
adults listen to the radio 20 times a month, for an average of 50 minutes.
                                                                  Radio stations listened to   HCMC
                                                                  in last 7 days
     How usually listen to the radio                              VOV Giao Thong               66%
                                                                  Voice of HCM                 48%
               4% 3%                                              Voice of Binh Duong          33%
                                                                  Xone FM                      17%
           14%            46%                                     VOV1                         16%
     16%

                 18%                                              Radio stations listened to   Hanoi
                                                                  in last 7 days
                                                                  VOV Giao Thong               50%
By mobile phone         On a radio cassette                       VOV1                         38%
Through a radio set     Via public loudspeakers                   Voice of Ha Noi              27%
In car/ taxi            On the internet
                                                                  VOV3                         19%
                                                                  Xone FM                      8%


20    Source: 3D 2012     Base: 922 urban adults who listen to the radio
                          HCMC (331), Hanoi (126)
Consumer experience of the
world does not fit in neat
boxes
The lines between the real and virtual worlds are
  disappearing


The lines between the real
and the virtual world are
disappearing
What we as marketers call digital has just been absorbed
into consumers daily lives

Mail is just Email or Messaging

Music is just MP3

Photo Albums are just Facebook

Videos on Tablet, PC or Mobile are just the new TV

Conversations are on Facebook

Games are just played online, with friends, in social networks

Mobile phones are just something they use to pass the time when they
are bored, and they use them to interact with whatever is around them
Our customers are the best integrated marketers out there


Your customers do not see the lines we see between channels


They do not perceive how you communicate with them in the digital
space as separate to the real world


They are experts at connecting the two together already


What they see on TV or Posters or in Newspapers, or at an event, or
anywhere else in the real world they share and act on online


That is the biggest opportunity in 2013
25
In the technology revolution, things change daily


  1. Content is now more liquid
  2. Communication is always on
  3. And advertising is about Orchestration, not just Integration


Post digital communication
is โ€œalways onโ€
Integration happens around
social and mobile
Social listening becomes
even more important for
brands
Mobile devices are a key
connector
Commerce gets legs
and goes mobile
โ€œMOBILE IS THE MOST OVER-
HYPED MEDIUM IN THE SHORT
TERM AND THE MOST UNDER-
HYPED MEDIUM IN THE LONG
TERM.โ€
      MARTIN SORRELL, CEO, WPP
Customer service becomes
more integrated with
marketing
Think        Think
Mobile       Social

    Donโ€™t think
    in boxes!
Beware the โ€œCargo Cultโ€
mentality
THANK YOU!

Digital Trends 2013 by Tom Simpson - Mindshare VN - Nov'12

  • 1.
  • 2.
    In 1996 ittook 25 mins to download 1 songโ€ฆ
  • 3.
    โ€ฆNow it takes25 seconds on your mobile phone 3 To update this brand zone text, on the Insert tab, click Header & Footer
  • 4.
  • 5.
    Heโ€™s made alot of money 5 To update this brand zone text, on the Insert tab, click Header & Footer
  • 6.
    How many ofyou knew this guy 1 year ago? 6
  • 7.
    The world isgoing through a period of profound change 7 To update this brand zone text, on the Insert tab, click Header & Footer
  • 8.
    Itโ€™s happening quicklyand itโ€™s driven by technology and the internet
  • 9.
    What does this meanfor Vietnam?
  • 10.
    The landscape ischanging fast 88% 88% 86% 73% 67% 67% 63% 55% 51% 2008 45% 40%39% 2010 34% 36% 2012 21% 15% 14% 11% 12%11% 11% 5% 7% 6% TV Daily Cable TV Newspaper Magazine Radio Daily Cinema Outdoor Daily Internet Daily Daily Daily Daily Monthly 10 Source: 3D 2012 (3,010), 2010 (2,924), 2008 (2,969) urban adults aged 15-45
  • 11.
    Internet consumption hasgrown over the past 5 years, as time spent watching TV has declined 140 134 Average Minutes Spent Per Day 124 84 74 39 44 32 34 17 22 16 16 14 13 All Television Newspaper Magazine Radio Internet 2008 2010 2012 Although time spent watching TV is decreasing, people increasingly watch TV online and/or on mobile device. In 2012 19% of urban adults has watched LIVE TV online in the last month, (15% in 2010). These people mostly watch on the internet (16%), followed by on mobile phones (4%), and on iPad/ Tablet (1%). 11 Source: 3D 2012 (3,010), 2010 (2,924), 2008 (2,969) urban adults aged 15-45
  • 12.
    The increase intime spent online compared with time spent watching TV is most visible amongst Men 25-34 M 16-24 F 16-24 147 130 135 126 127 137 126 117 102 104 85 2008 2010 63 2012 TV Internet TV Internet -4min +42min -21min +41min M 25-34 F 25-44 134 146 136 129 118 113 103 81 45 57 42 22 TV Internet TV Internet -21min +58min -17min +35min 12 Source: 3D 2012 (3,010), 2010 (2,924), 2008 (2,969) urban adults aged 15-45
  • 13.
    Changing attitudes towardsmedia and advertisement The last 5 years 2012 41 โ€œTV commercials show a provide truthful 2010 48 informationโ€ 2008 50 downward 2012 49 trend in trust in โ€œI trust TV news to advertisement 2010 57 report accuratelyโ€ and traditional 2008 62 media. 2012 47 โ€œI trust newspapers to report accuratelyโ€ 2010 51 Urban adults donโ€™t 2008 55 just believe what 2012 43 they are being โ€œI like watching TV told anymore. 2010 49 advertisingโ€ 2008 61 The number of people who like TV 2012 60 โ€œI have less and less advertising has 2010 54 dropped trust in companies and brandsโ€ 2008 53 significantly 0 20 40 60 80 % 13 Source: 3D 2012 (3,010), 2010 (2,924), 2008 (2,969) urban adults aged 15-45
  • 14.
    The decreasing trustin traditional media goes alongside an upward trend in online media Across the Asia-pacific region, Vietnam has the Social network % penetration highest video viewing penetration: 89.8% reach of web population* 80 72 70 60 50 38 40 30 20 20 10 0 2008 2010 2012 Vietnamese people are curious and they actively look for information themselves. Social media serves as an expansion of WOM: People share opinions, ask questions and so they look for their own truth, not the truth of the advertiser. 14 Source: 3D 2012 (1,790), 2010 (1,575), 2008 (1,282) urban adults aged 15-45 who use the internet * ComScore Data Gem
  • 15.
    134 minutes onlineper day 63% of all adults has used the internet in the last 3 months. These adults go online 26 times a month and on an average day they spend 134 minutes online. % Internet penetration % Time of day usually go online 100 90 84 70 80 80 72 60 70 63 60 50 50 47 40 40 37 30 30 20 20 23 10 0 10 All M 16- F 16- M 25- F 25- 0 adults 24 24 34 44 Internet penetration is skewed towards the young audiences 15 Source: 3D 2012 Base: 3,010 urban adults aged 15-45, of who 1,790 use internet
  • 16.
    72% of adultshas a social network 72% of online adults has a social network. On average, these people visit their social network(s) 27 times a month. % Social Network penetration % Social Network have a profile on 100 90 84 84 7774 7978 78 90 79 80 80 72 68 70 70 62 58 57 60 60 50 45 42 50 40 30 40 26 30 30 17 16 20 20 14 13 10 10 0 0 All M 16- F 16-24 M 25- F 25-44 M16-24 F16-24 M25-34 F25-44 adults 24 34 Yahoo! Facebook ZingMe Google+ Having a social network is Amongst the older adults, Yahoo! has a definite skewed towards the younger lead over Facebook, whereas amongst the online adults younger adults, Yahoo! and Facebook are almost evenly popular. 16 Source: 3D 2012 Base: 1,790 urban adults who use internet, of who 1,253 social network
  • 17.
    Mobile Internet 51%of the online adults use mobile internet, with an average of 27 times a month. % % Mobile internet penetration Time of day use mobile internet 50 100 90 40 80 30 30 22 70 20 59 61 60 52 51 10 50 44 40 0 30 20 10 0 All M 16-24 F 16-24 M 25-34 F 25-44 Using mobile internet is quite spread over adults the day, which is the convenience of going online on your phone 17 Source: 3D 2012 Base: 1,790 urban adults who use internet, of who 996 use mobile internet
  • 18.
    People read newspaperscross platform % 90 80 More females than males read hard copy 80 newspapers, whereas males are more likely to 70 read a newspaper website than females. 60 56 Reading the news via appโ€™s is still very low 50 amongst Vietnamese adults. Males, and especially 40 young males, are more likely to use newspaper 30 apps. 20 10 5 2 2 2 2 0 A hard copy Newspaper Smartphone iPad/tablet Shared links Email Other website app app bulletins All adults M16-24 F16-24 M25-34 F25-44 18 Source: 3D 2012 Base: 2,118 urban adults who read/buy newspapers
  • 19.
    โ€ฆand magazines More females than males read hard copy % magazines, especially the 25-45 females. Males are 100 more likely to read a magazine online than females. 90 82 80 Reading magazines via appโ€™s is still low, but there 70 is a skew towards the young females and males. 60 48 50 40 30 20 10 7 2 3 0 A hard copy Magazine website Smartphone app iPad/tablet app Other All adults M16-24 F16-24 M25-34 F25-44 19 Source: 3D 2012 Base: 898 urban adults who read/buy magazines
  • 20.
    Radio is consumedthrough mobile phones 32% of the urban adults has listened to the radio in the last month. These adults listen to the radio 20 times a month, for an average of 50 minutes. Radio stations listened to HCMC in last 7 days How usually listen to the radio VOV Giao Thong 66% Voice of HCM 48% 4% 3% Voice of Binh Duong 33% Xone FM 17% 14% 46% VOV1 16% 16% 18% Radio stations listened to Hanoi in last 7 days VOV Giao Thong 50% By mobile phone On a radio cassette VOV1 38% Through a radio set Via public loudspeakers Voice of Ha Noi 27% In car/ taxi On the internet VOV3 19% Xone FM 8% 20 Source: 3D 2012 Base: 922 urban adults who listen to the radio HCMC (331), Hanoi (126)
  • 21.
    Consumer experience ofthe world does not fit in neat boxes
  • 22.
    The lines betweenthe real and virtual worlds are disappearing The lines between the real and the virtual world are disappearing
  • 23.
    What we asmarketers call digital has just been absorbed into consumers daily lives Mail is just Email or Messaging Music is just MP3 Photo Albums are just Facebook Videos on Tablet, PC or Mobile are just the new TV Conversations are on Facebook Games are just played online, with friends, in social networks Mobile phones are just something they use to pass the time when they are bored, and they use them to interact with whatever is around them
  • 24.
    Our customers arethe best integrated marketers out there Your customers do not see the lines we see between channels They do not perceive how you communicate with them in the digital space as separate to the real world They are experts at connecting the two together already What they see on TV or Posters or in Newspapers, or at an event, or anywhere else in the real world they share and act on online That is the biggest opportunity in 2013
  • 25.
  • 26.
    In the technologyrevolution, things change daily 1. Content is now more liquid 2. Communication is always on 3. And advertising is about Orchestration, not just Integration Post digital communication is โ€œalways onโ€
  • 27.
  • 28.
    Social listening becomes evenmore important for brands
  • 29.
    Mobile devices area key connector
  • 30.
  • 31.
    โ€œMOBILE IS THEMOST OVER- HYPED MEDIUM IN THE SHORT TERM AND THE MOST UNDER- HYPED MEDIUM IN THE LONG TERM.โ€ MARTIN SORRELL, CEO, WPP
  • 32.
    Customer service becomes moreintegrated with marketing
  • 35.
    Think Think Mobile Social Donโ€™t think in boxes!
  • 36.
    Beware the โ€œCargoCultโ€ mentality
  • 37.

Editor's Notes

  • #34ย POE is built on the idea that advocacy drives successful business and that the internet has changed everything especially the way people have relationships with brands. In the centre the brands owned assets are represented with one of them being more prominent as the hubOn the left the key paid media channels are highlighted and the on the right the earned platforms are shown.The arrows show the direction of flow around the brandโ€™s comms ecosystem
  • #37ย Itโ€™s a challenge the industry frequently faces quite often especially amongst brands with limited resources or a very traditional view of communications. In their simplest form, legacy media strategies for traditional outlets may become a one dimensional list defining which executions run on which TV channels or newspapers with what frequency. Transpose this to digital, and we get a list of search keyphrases and household-name websites.In response to this, a colleague of mine Nick Fawbert of Third Space based in Singapore recently christened it a โ€˜cargo cultโ€™ strategy.A cargo cult, is a quasi-religious movement that started to appear among some Pacific islanders around a century ago with the advent of serious international trade in the region. It reached a peak after the Second World War, when the islands had become saturated with the foot soldiers of various warring nations.The technologies islanders were exposed to were so far beyond their experience (particularly those delivered by aircraft) that the locals decided they must be of divine provenance as a reward for good behaviour. They also became somewhat tetchy that these assets seemed to be hoovered up by foreign forces, and came to the conclusion that this must be down to the particular forms of worship they engaged in.Post-conflict, these regular cargo deliveries quickly ground to a halt, and the foreign forces departed, leaving behind a local population now hooked on tinned spam and socket sets.To attract the deliveries back once more, islanders determined to emulate the foreign religion, and built runways, airports, and control towers out of straw and bamboo. One even went so far as to fashion a headset complete with ariels of bamboo for the ground crew. They developed rituals that entailed copying military routines like square bashing, and painted US flags on their bodies in all the appropriate places.Thus the โ€˜cargoโ€™ cults were born.They were, of course, despite their comprehensive recreation of the airport experience, totally useless.So why do I bring this up at the beginning of a conference? Looking at Effective communications strategy by emulating the outward manifestations of successful campaigns, but without understanding the infrastructure and ecosystem that are necessary to support it.At the root of it all is the work that goes into establishing a unique value propositionโ€”recognition of the contribution all assets can make at all levels of a company from research and design through manufacturing, distribution, retail and customer service.CRM for example is often dismissed as something for the โ€œtechiesโ€Lest we forget, some of the most successful digital campaigns of recent years, such as Dell Storm, are those that have integrated the customer into the creation and sales process through dialogue and crowdsourcing.Those relationships are business critical. Good customer relationships improve business performance by enhancing customer satisfaction and driving up customer loyalty. This increases frequency and value of purchases.The telecom industry sees a 10 per cent increase in customer satisfaction generating a 2 per cent rise in customer retention and a 3 per cent rise in revenues. Volvo discovered that a one-point increase in customer satisfaction results in a 4 per cent increase in dealer profitability, because they donโ€™t have to work so hard to make the next sale. Lexus calculated that each โ€˜delightedโ€™ customer (their metric) makes them an average of S$1.2 million in sales recommendations.