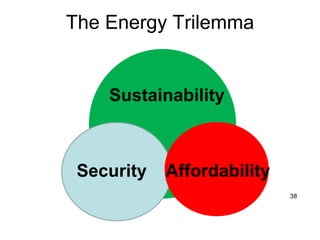
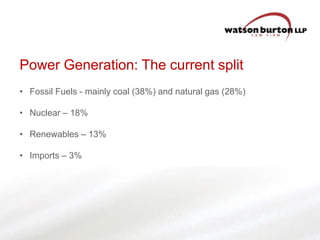
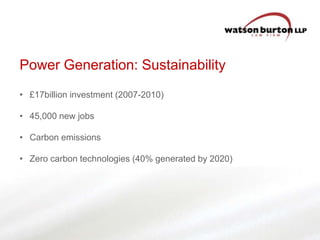
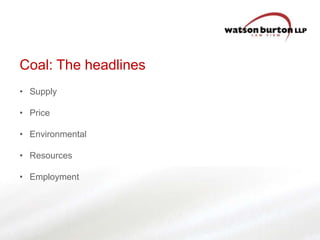
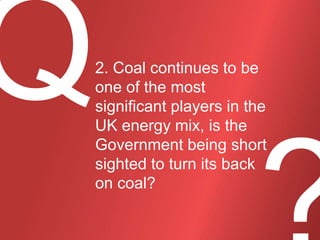
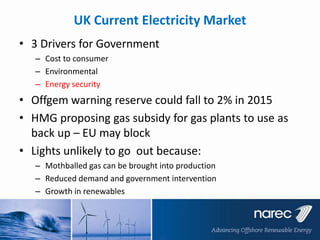
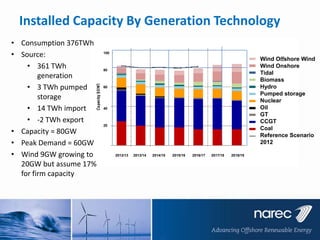
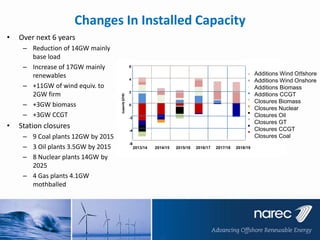
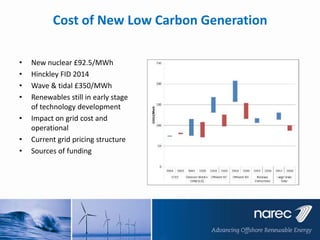
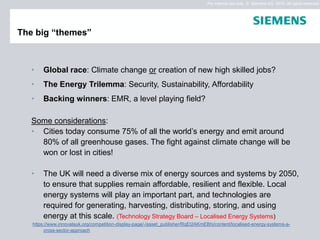
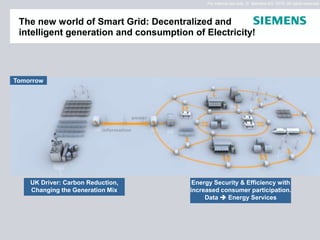
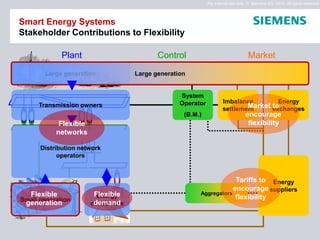
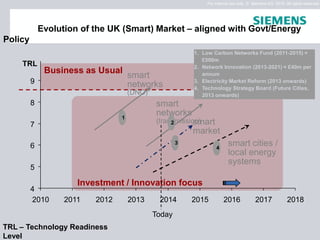
The document summarizes a UK power generation debate event that discussed the current state of the UK power market and generation mix. It includes an agenda that covers topics like the current generation split by source, sustainability and emissions issues, and headlines on various generation methods like coal, gas, nuclear, wind, and solar. It also includes panels from industry experts who discuss issues like the transition to low carbon energy, balancing the power system, the evolution of smart markets and grids, and considerations around the energy trilemma of security, sustainability and affordability.


![For internal use only © Siemens AG 2010. All rights reserved.
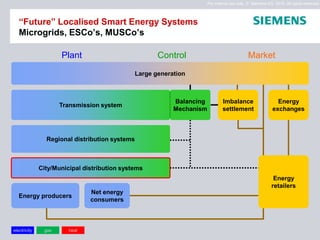
Food for thought.......other market entrants??
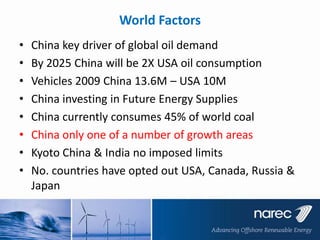
Some key figures for China:•
•
•
•
•
•
Population – over 1.3 billion (20% of world;1 in 5 Chinese)
most populous country in world
State Grid Corporation of China (SGCC), covers 88 per cent of
China and serves over 1 billion customers
26.53% electricity generated in China from clean energy in
2010. Carbon intensity of China‘s economy to be reduced by
40-45% by 2020, [against baseline 2005]
Smart Grid market size $22.3bn in 2011 rising to $61.4bn in
2015, largest element T&D Eqpt (at 35%)
SGCC released in June 2010, industry rules, standards and
favoured technologies for domestic and international
manufacturers of smart grid equipment
And .......Chinese domestic firms serving the smart grid market
will expand their footprint beyond their nation‘s borders as their
technologies and their services will become increasingly
competitive with their foreign counterparts
Source: China: Rise of the Smart Grid, January 2011, www.Zpryme.com, Research and Consulting](https://image.slidesharecdn.com/energypresentation-131210053210-phpapp02/85/Energy-Debate-35-320.jpg)