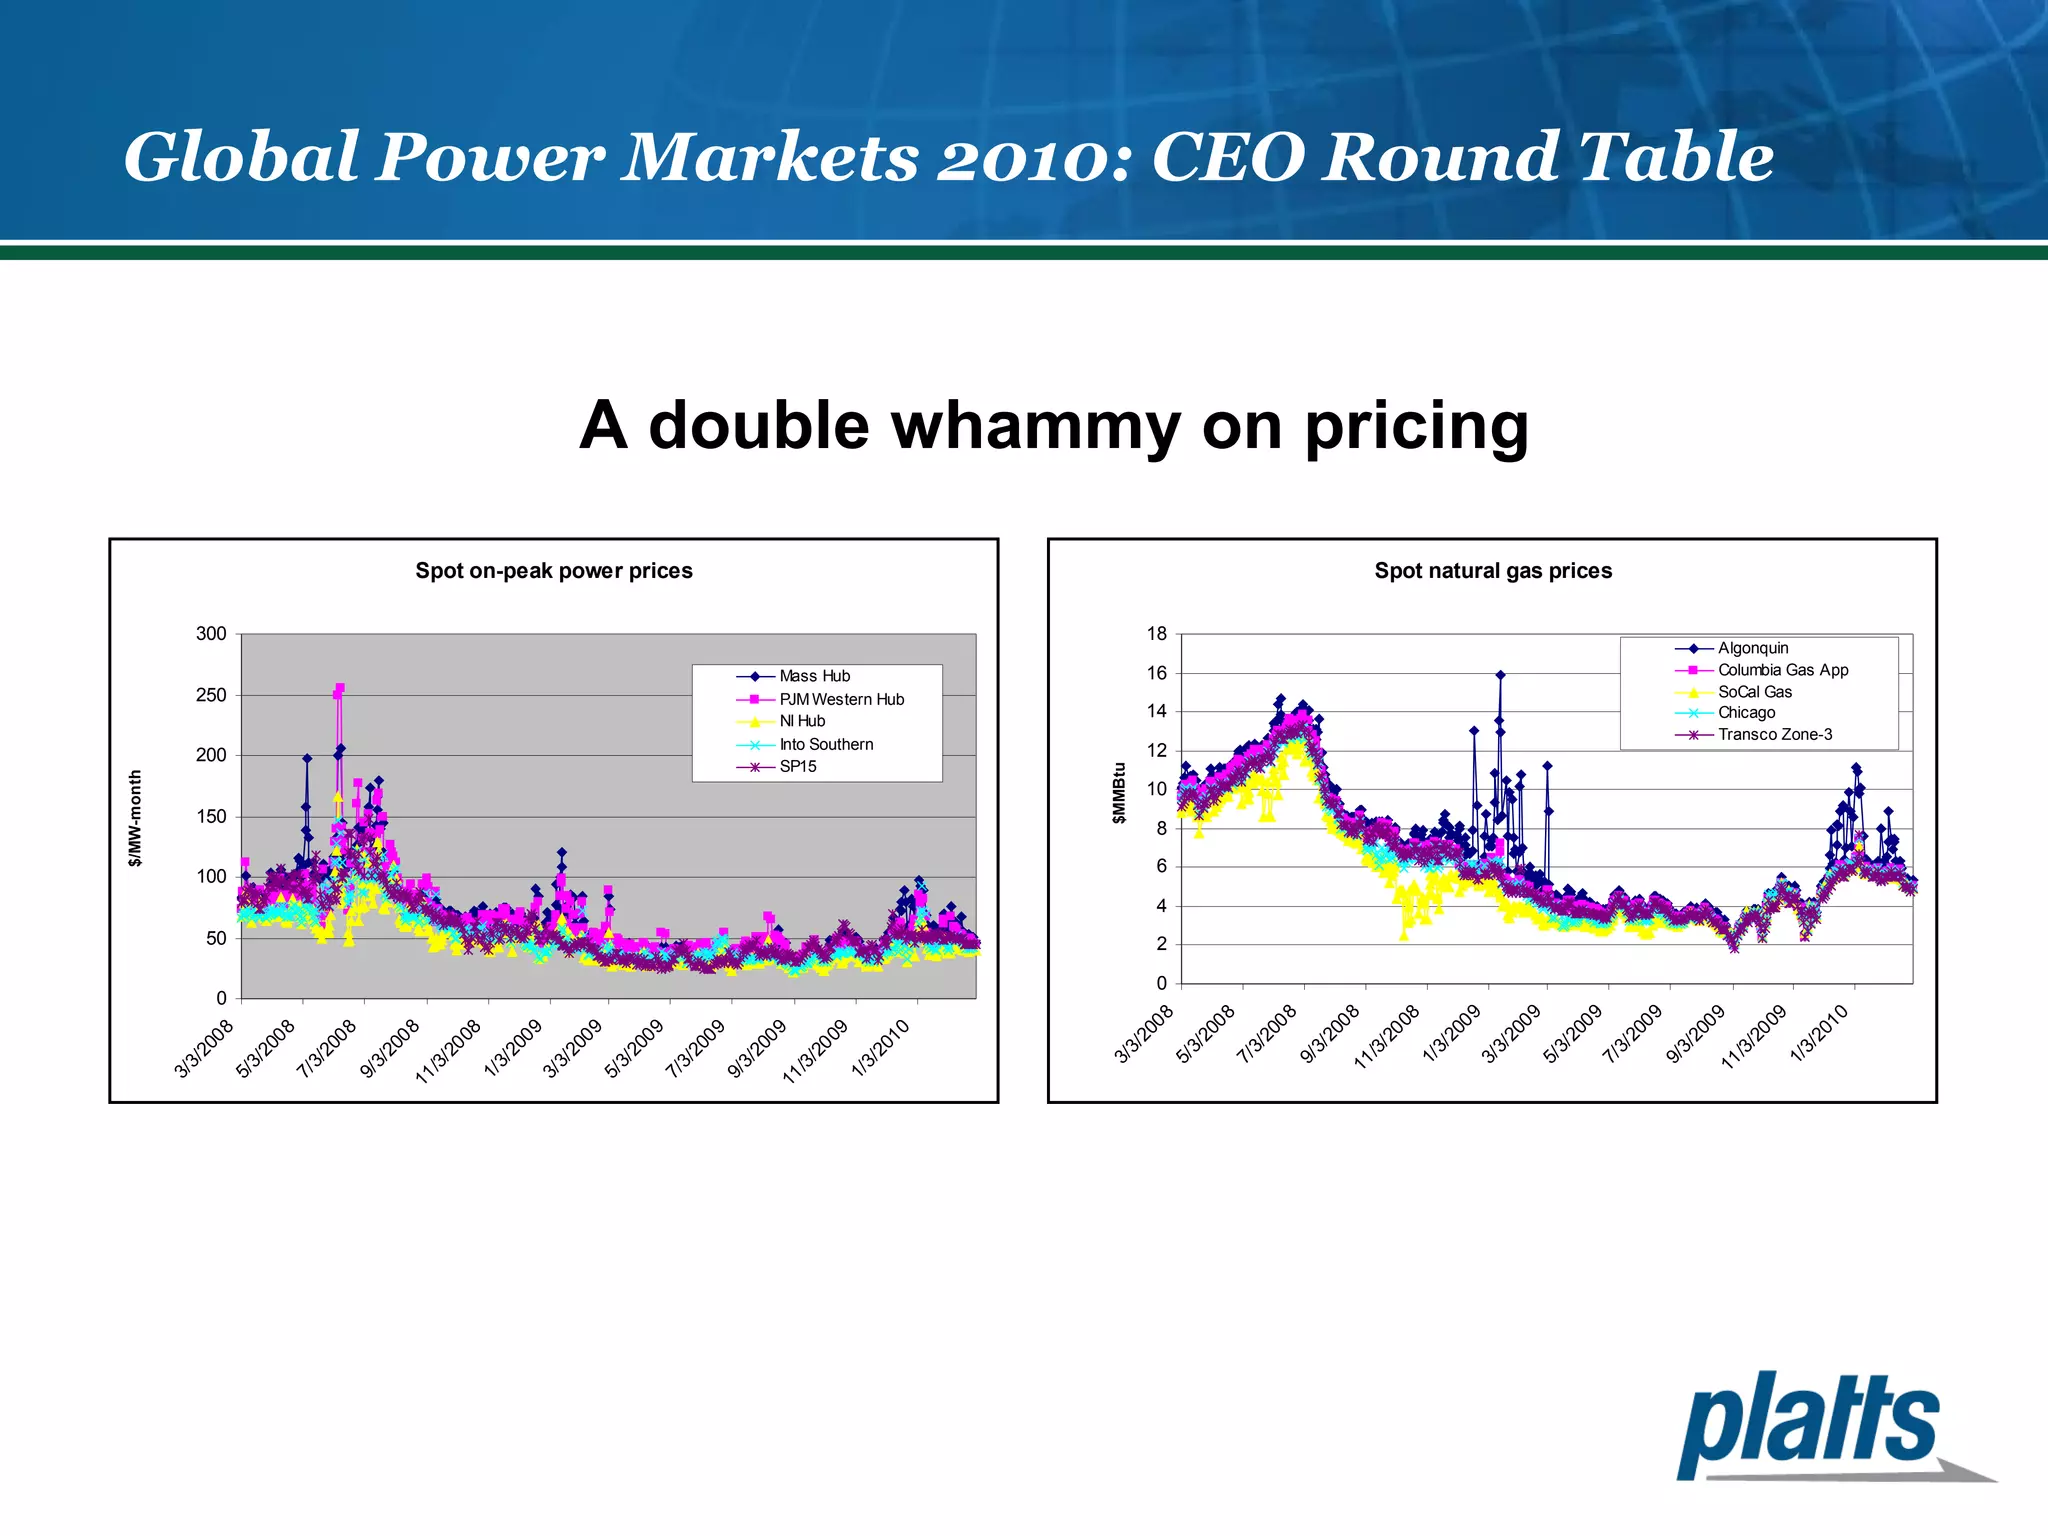
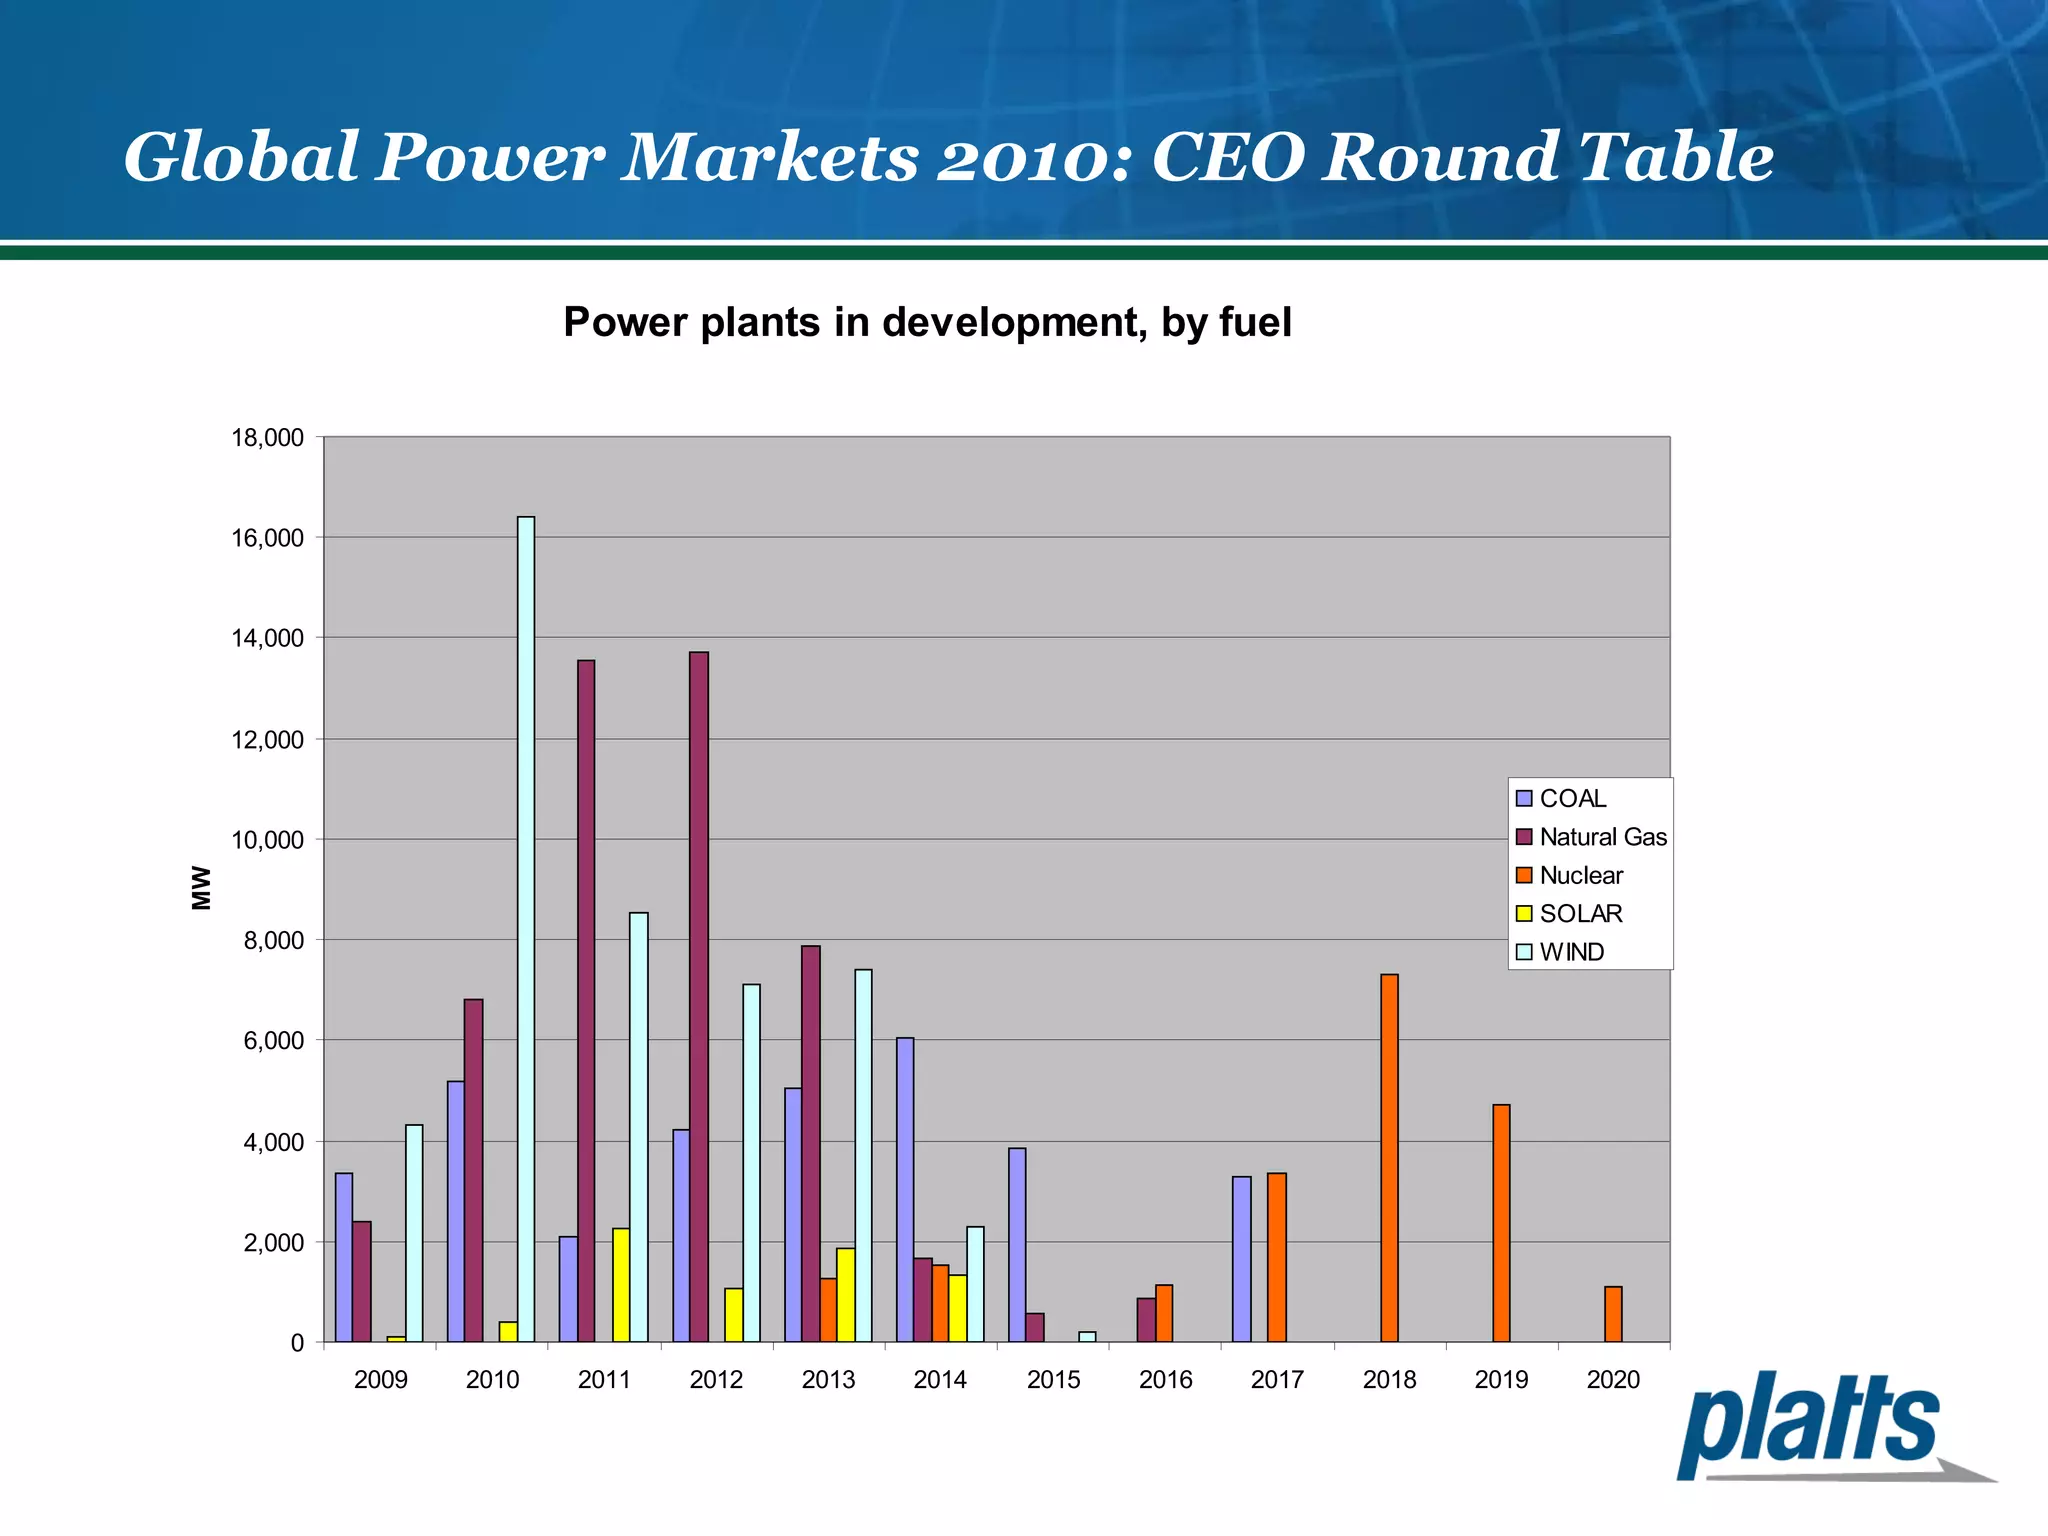
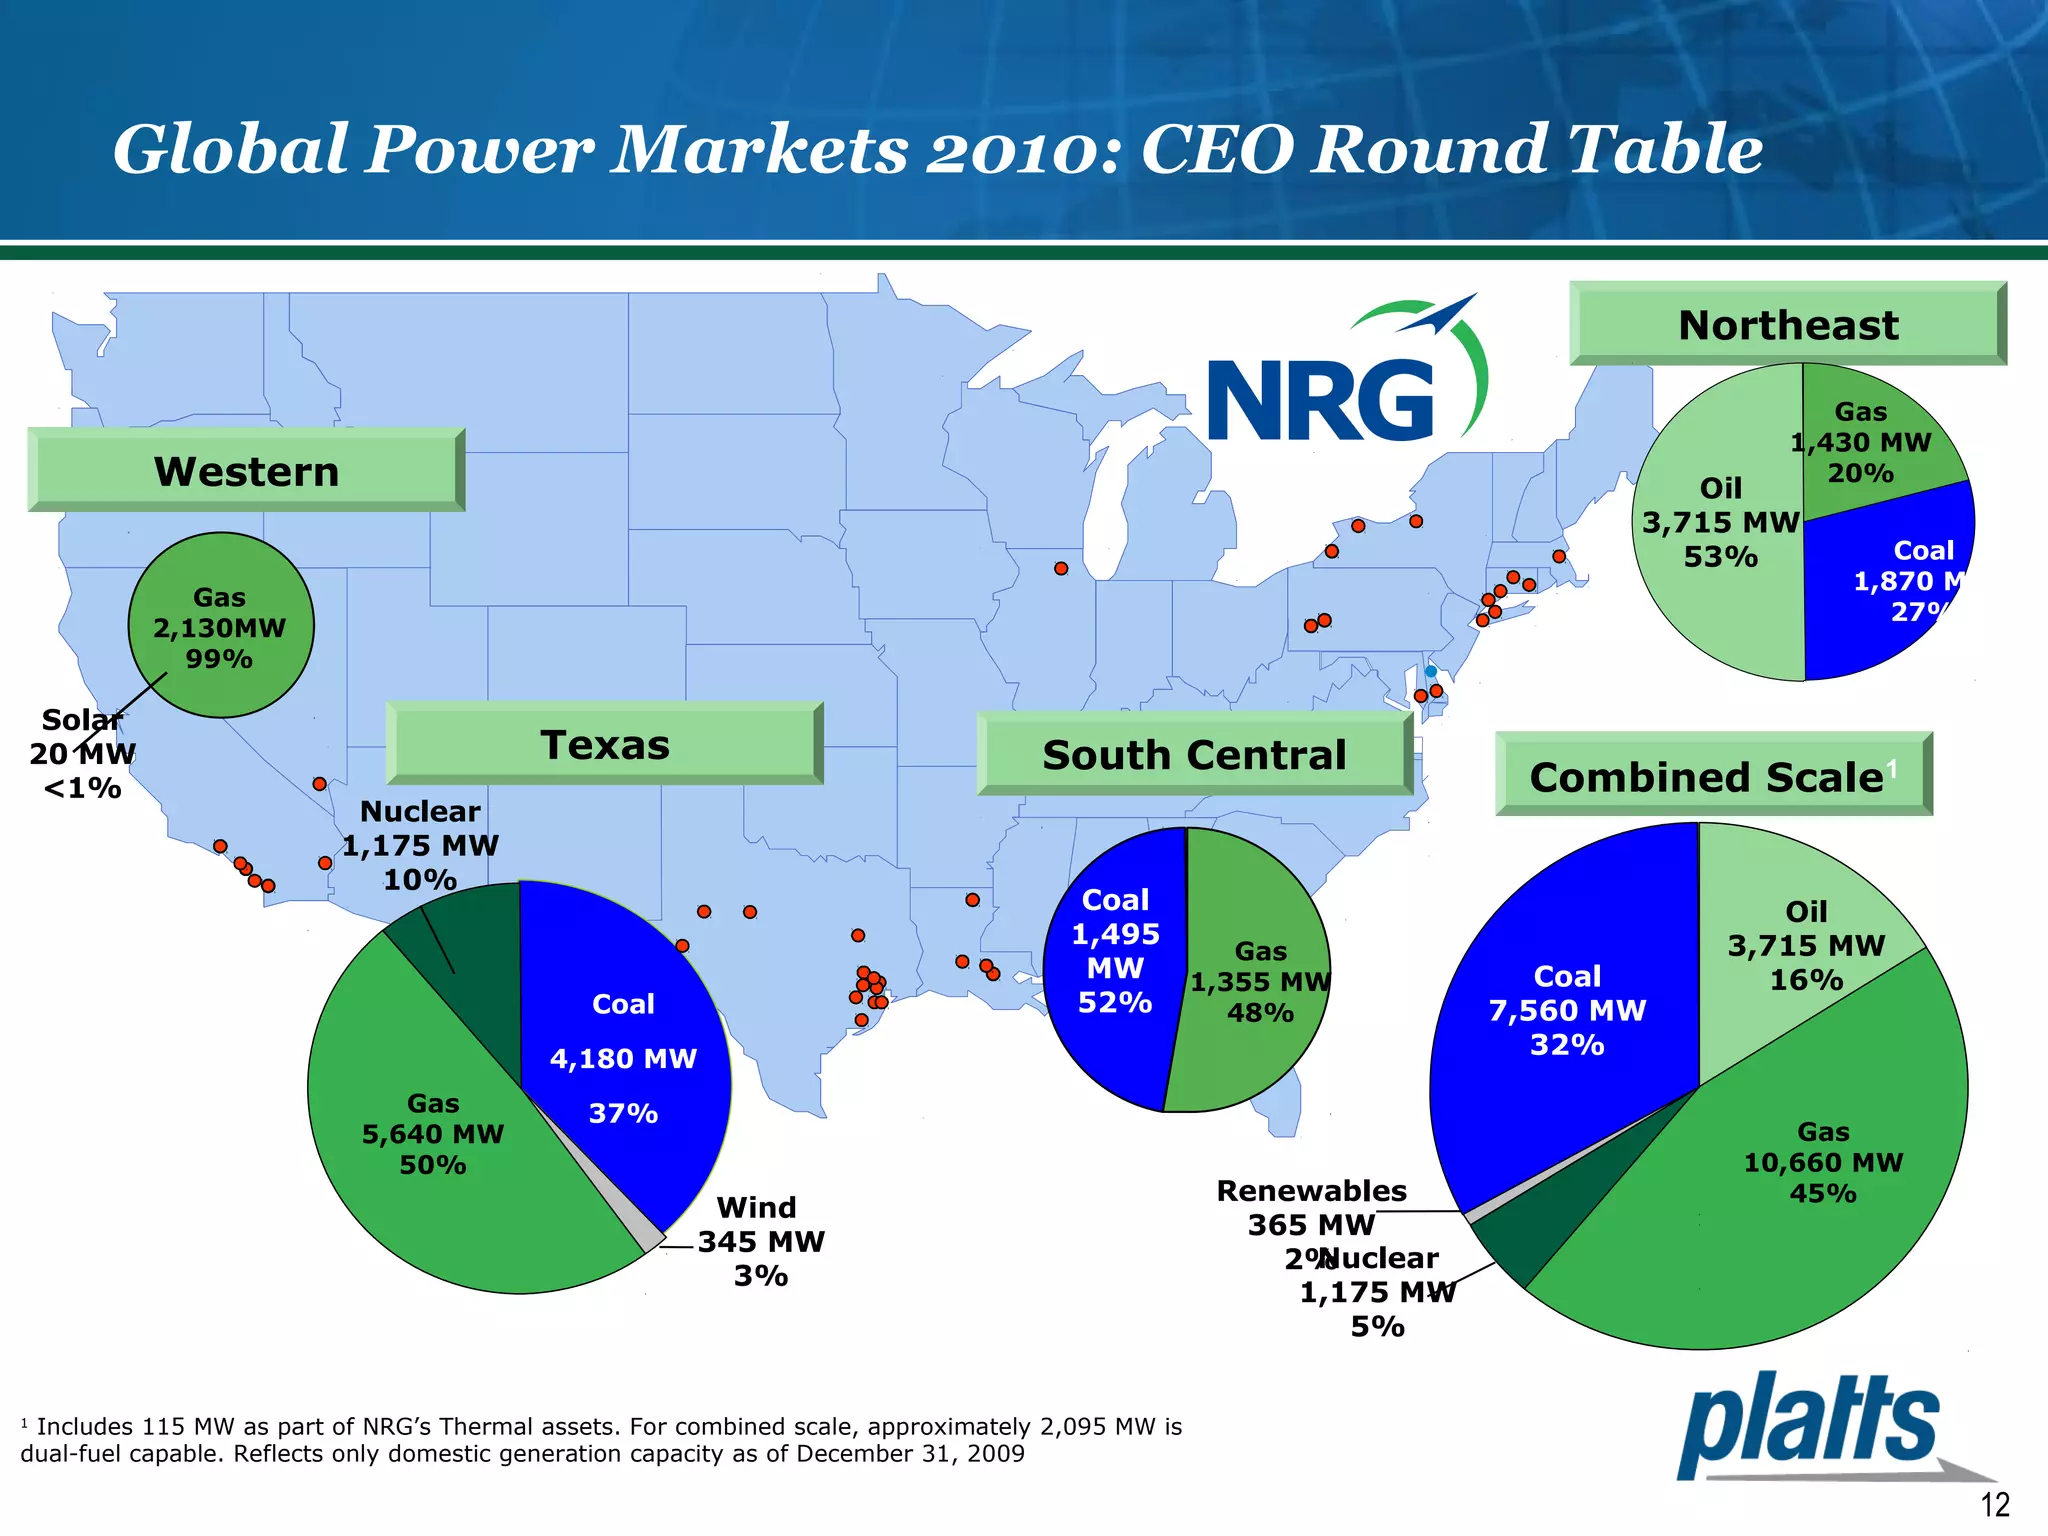
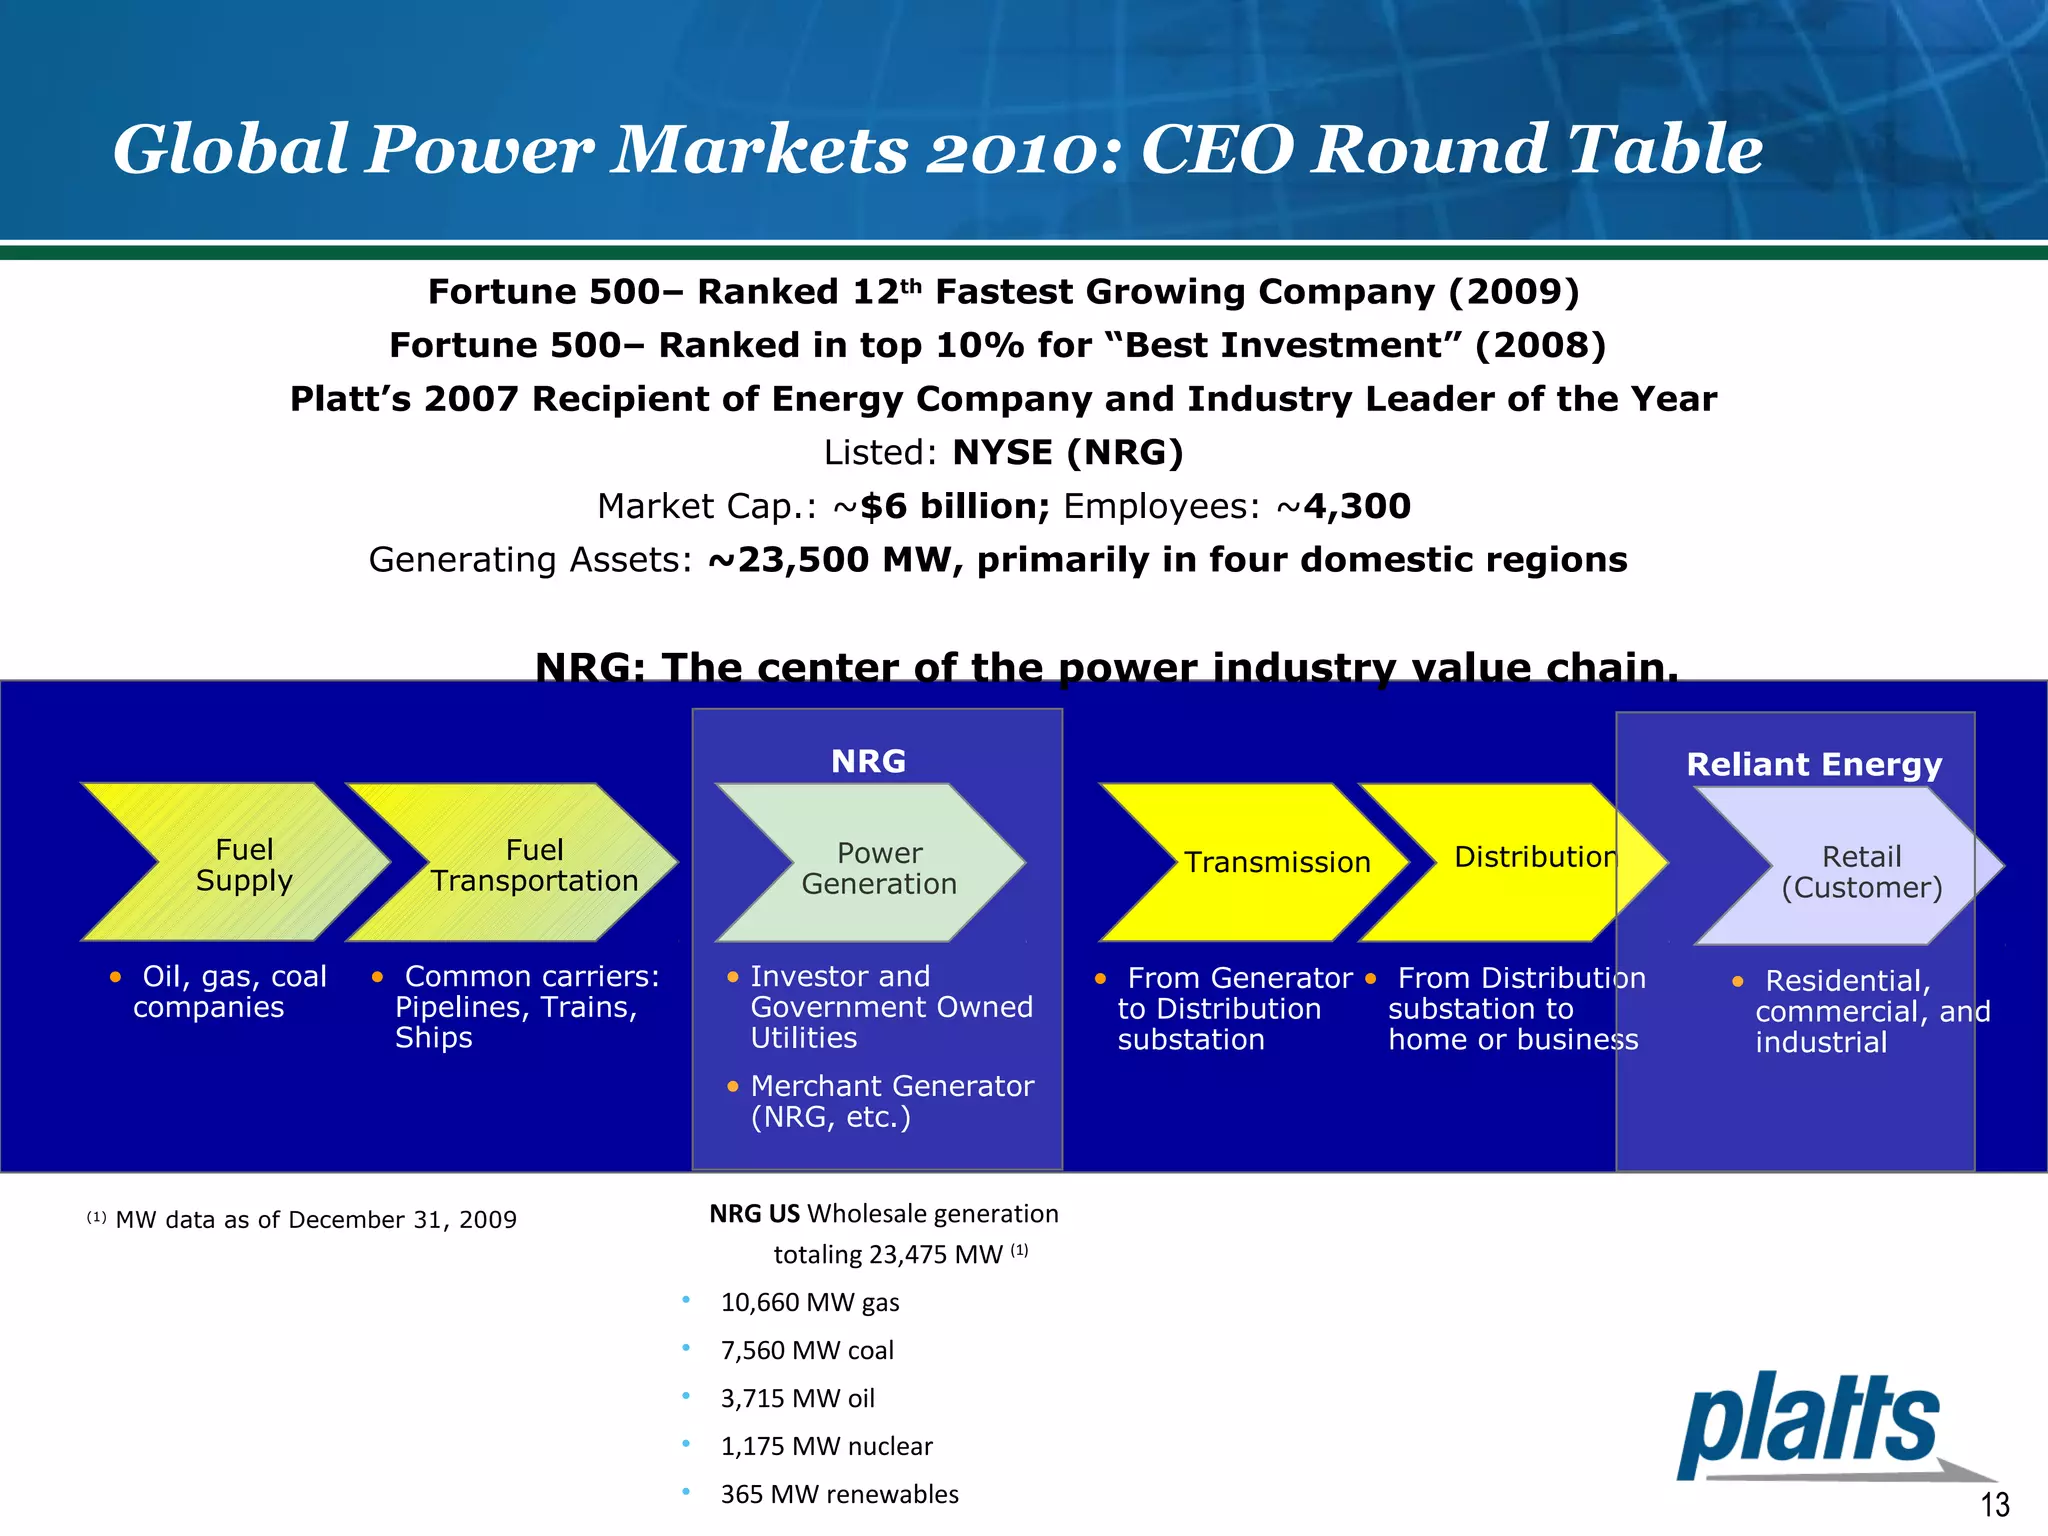
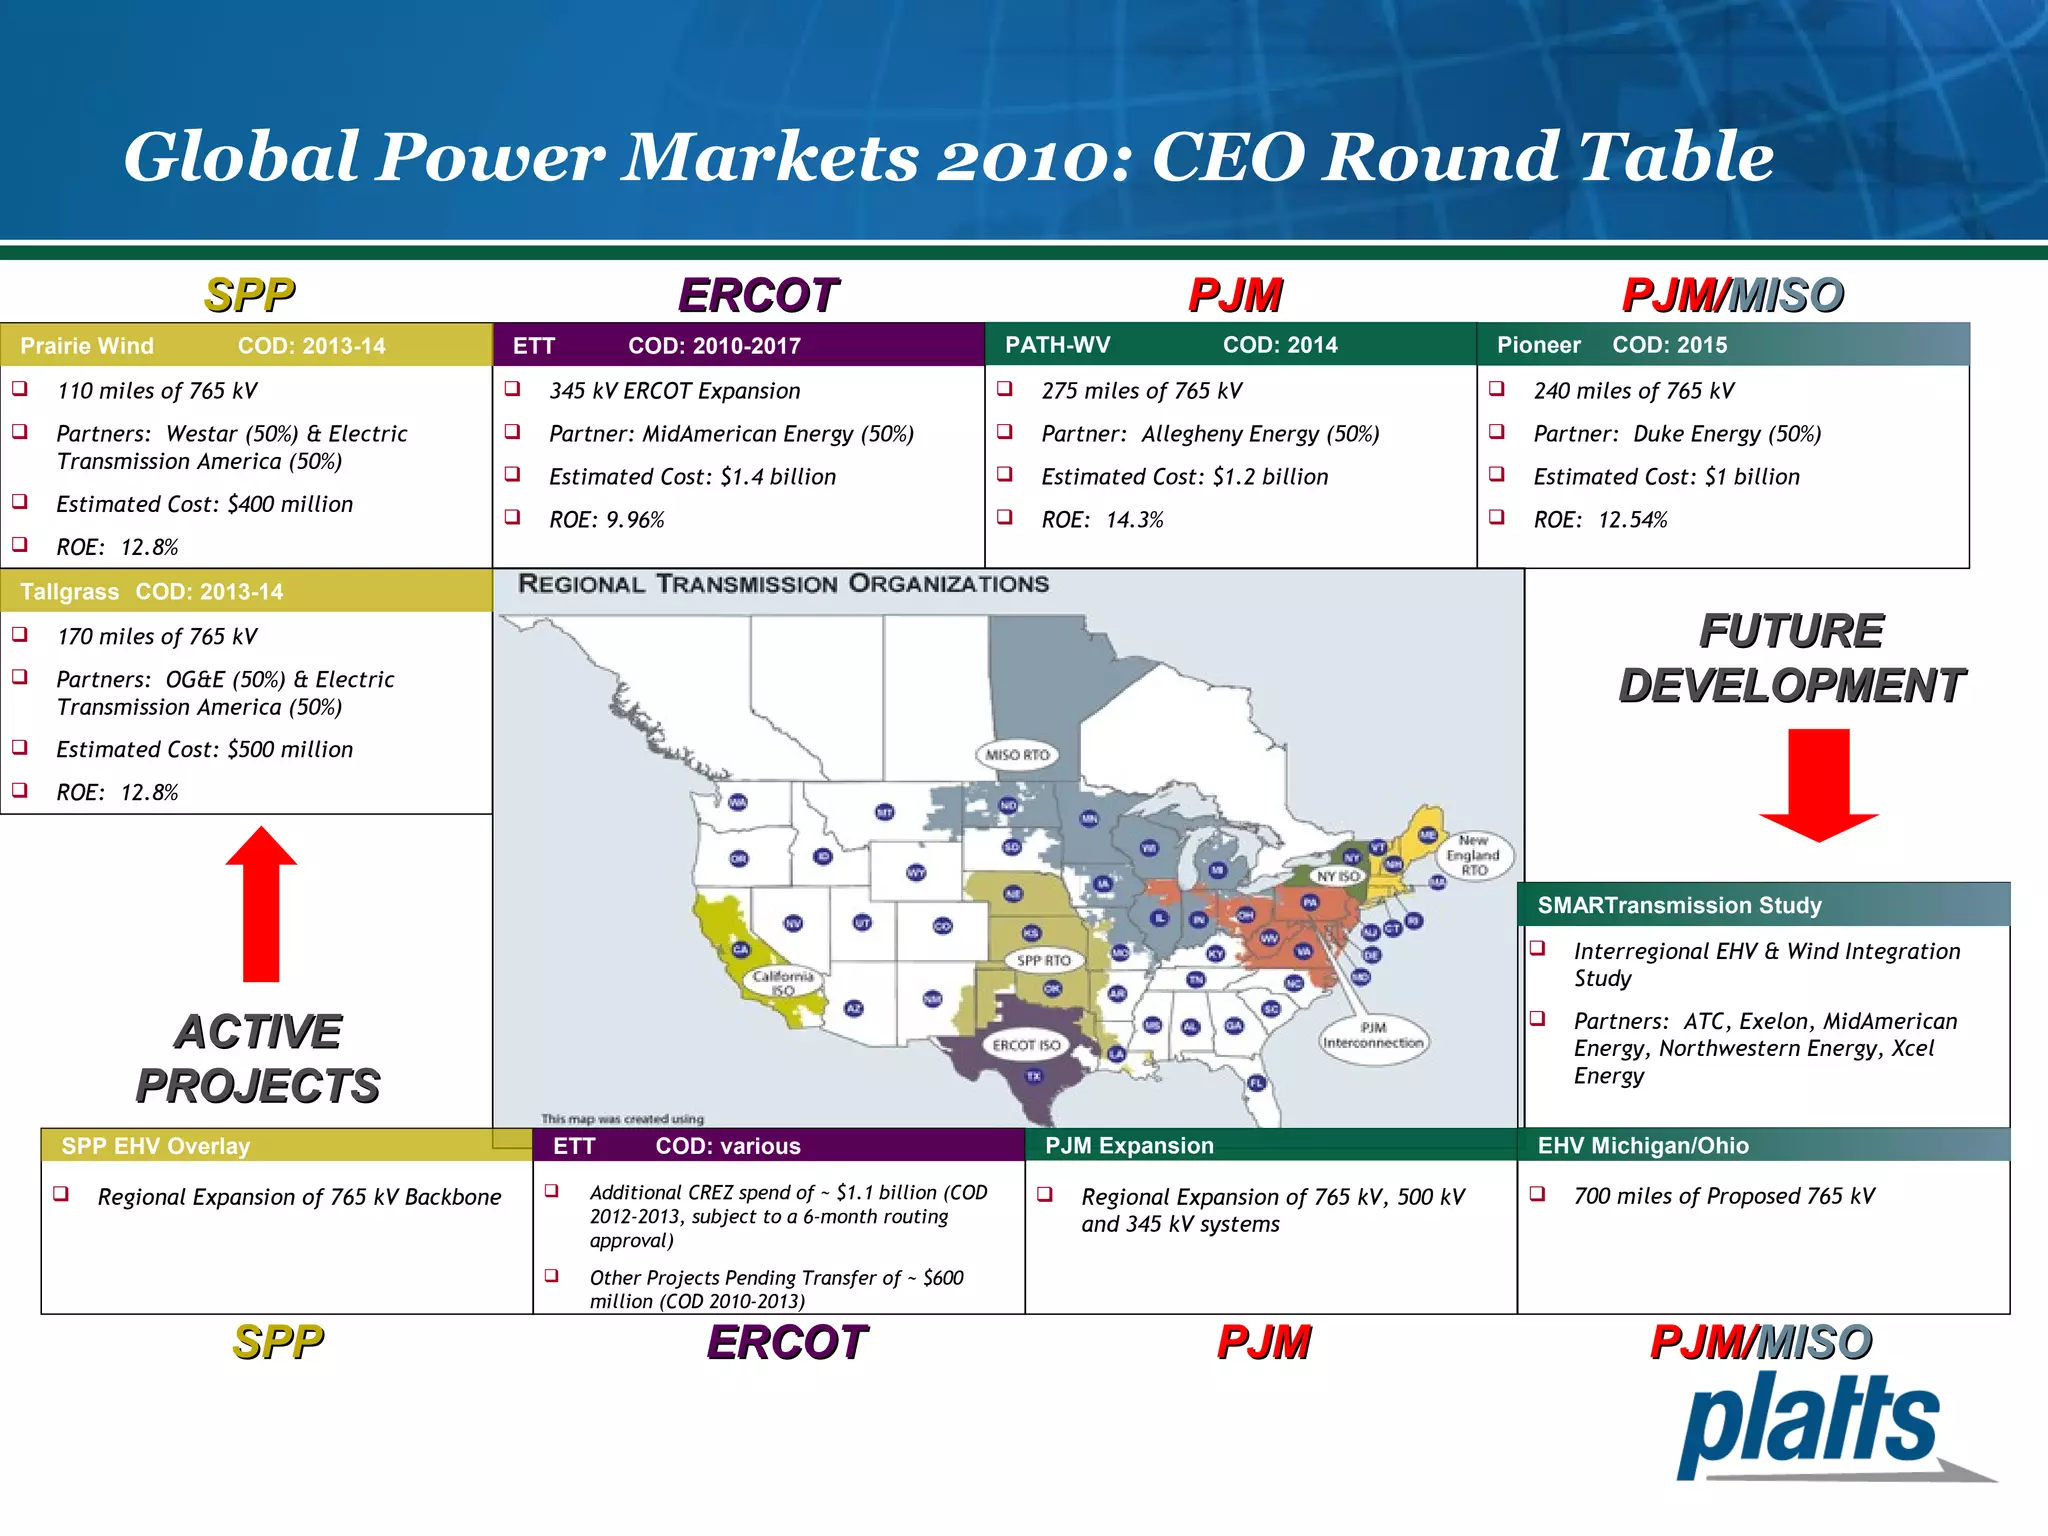
25th Annual 
Global Power Markets 
Conference 
Brave New World 
Preparing for a Post-Carbon Future 
April 11 – 13, 2010 
Las Vegas, Nevada 
Peter Maloney 
Chief Editor, Platts Global Power Report
Global Power Markets 2010: CEO Round Table 
US Climate change/energy bills 
Bill Number Sponsor(s) Cap & trade Status Comment 
American Clean 
Energy and 
passed out of 
Security Act H.B. 2454 Waxman-Markey yes 
House June 26 
Clean Energy Jobs 
and American 
Power Act S. 1733 Kerry-Boxer yes 
passed out of Env. 
& Pub. Works 
Comit. Nov. 5 
Dept. of Ag. 
Handles offsets 
American Clean 
Energy Leadership S. 1462 Bingaman no 
passed by Energy 
& Nat. Res. Comit. 
June 17 energy only 
Clean Energy 
Partnerships Act S. 2729 Stabebnow no 
referred to Sen. 
Env. & Pub. Works 
Comit. outline for offsets 
Clean Energy Act S. 2776 Alexander-Webb no 
introduced Nov. 1, 
2009 
nuclear power, 
loan guarantees 
Carbon Limits and 
Energy for 
American's 
Renewal Act S. 2877 Cantwell-Collins no 
introduced Dec.1, 
2009; referred to 
finance committee cap and dividend 
draft na 
Kerry-Graham- 
Liebermann unknown draft
Global Power Markets 2010: CEO Round Table 
Climate Hot Air Index 
250 
200 
150 
100 
50 
0 
105th 
(1997-98) 
106th 
(1999-00) 
107th 
(2001-02) 
108th 
(2003-04) 
109th 
(2005-06) 
110th 
(2007-08) 
Congress 
legislative initiatives
Global Power Markets 2010: CEO Round Table 
Electricity demand 
three year rolling average % growth 
12 
10 
8 
6 
4 
2 
0 
-2 
1950 
1960 
1970 
1980 
1990 
2000 
2010 
2020 
2030 
Source: Energy Information Administration 
Period Annual growth 
1950s 9.8 
1960s 7.3 
1970s 4.7 
1980s 2.9 
1990s 2.4 
2000-2008 0.9 
2008-2035 1.0
Global Power Markets 2010: CEO Round Table 
Spot on-peak power prices 
300 
250 
200 
150 
100 
50 
0 
3/3/2008 
5/3/2008 
7/3/2008 
9/3/2008 
1/3/2009 
3/3/2009 
5/3/2009 
7/3/2009 
9/3/2009 
11/3/2008 
11/3/2009 
1/3/2010 
$/MW-month 
Mass Hub 
PJM Western Hub 
NI Hub 
Into Southern 
SP15 
Spot natural gas prices 
18 
16 
14 
12 
10 
8 
6 
4 
2 
0 
3/3/2008 
5/3/2008 
7/3/2008 
9/3/2008 
1/3/2009 
3/3/2009 
5/3/2009 
7/3/2009 
9/3/2009 
11/3/2008 
11/3/2009 
1/3/2010 
$MMBtu 
Algonquin 
Columbia Gas App 
SoCal Gas 
Chicago 
Transco Zone-3 
A double whammy on pricing
Global Power Markets 2010: CEO Round Table 
Recipients of cash grants in lieu of PTCs under the ARRA 
total awards as of April 2010, $3 billion 
• Acciona 
• AES Corp. 
• Cannon Power 
• enXco 
• E.ON 
• Eurus 
• EverPower 
• First Wind 
• Heritage Sustainable Energy 
• Horizon Wind Energy 
• Iberdrola 
• Invenergy 
• John Deere 
• NaturEner 
• Next Era Energy Resources 
• Puget Sound Energy 
• Valero
Global Power Markets 2010: CEO Round Table 
Federal loan guarantee commitments 
• Kahuku Wind Power, $117 million, wind farm 
• SAGE Electrochromics, $72 million, energy efficient window factory 
• BrightSource Energy, $1.4 billion, solar power project 
• Vogtle (Georgia Power, Oglethorpe Power, Municipal Electric Authority of Georgia, 
Dalton, Ga. ), $8.3 billion, two nuclear power units 
• Solyndra, $535 million, cylindrical solar PV panel factory 
• Beacon Power, $43 million, flywheel energy storage plant 
• Nordic Windpower, $16 million, wind turbine assembly factory 
• Red River Environmental Products, $245 million, activated carbon factory 
• Ford Motor, $5.9 billion, more fuel efficient cars 
• Nissan, $1.4 billion, electric cars and battery packs 
• Tesla Motors, $465 million, battery packs and electric drive trains 
• Fisker Automotive, $528.7 million, plug-in hybrid vehicles
Global Power Markets 2010: CEO Round Table 
Power plants under construction in the US, by fuel 
7,000 
6,000 
5,000 
4,000 
3,000 
2,000 
1,000 
0 
2009 2010 2011 2012 2013 
MW 
COAL 
Natural Gas 
Nuclear 
Solar 
WIND
Global Power Markets 2010: CEO Round Table 
Power plants in development, by fuel 
18,000 
16,000 
14,000 
12,000 
10,000 
8,000 
6,000 
4,000 
2,000 
0 
2009 2010 2011 2012 2013 2014 2015 2016 2017 2018 2019 2020 
MW 
COAL 
Natural Gas 
Nuclear 
SOLAR 
WIND
Global Power Markets 2010: CEO Round Table 
Brave new technologies 
• Smart grid technologies 
• Demand side management and energy efficiency 
• New solar panels and solar cells 
• Carbon capture and storage 
• Flywheel storage 
• Battery storage 
• Electric vehicles 
• Hybrid vehicles
Global Power Markets 2010: CEO Round Table 
David Crane, 
President, Chief Executive Officer
Global Power Markets 2010: CEO Round Table 
12 
South Central 
Western 
Northeast 
Texas 
Combined Scale1 
Gas 
2,130MW 
99% 
Oil 
3,715 MW 
53% 
Gas 
1,430 MW 
20% 
Coal 
1,870 MW 
27% 
Coal 
7,560 MW 
32% 
Oil 
3,715 MW 
16% 
Nuclear 
1,175 MW 
5% 
4,180 MW 
Wind 
345 MW 
3% 
Nuclear 
1,175 MW 
10% 
Coal 
Gas 37% 
5,640 MW 
50% 
1 Includes 115 MW as part of NRG’s Thermal assets. For combined scale, approximately 2,095 MW is 
dual-fuel capable. Reflects only domestic generation capacity as of December 31, 2009 
Gas 
10,660 MW 
Renewables 45% 
365 MW 
2% 
Solar 
20 MW 
<1% 
Coal 
1,495 
MW 
52% 
Gas 
1,355 MW 
48%
Global Power Markets 2010: CEO Round Table 
13 
Platt’s 2007 Recipient of Energy Company and Industry Leader of the Year 
Fuel 
Supply 
Fortune 500– Ranked 12th Fastest Growing Company (2009) 
Fortune 500– Ranked in top 10% for “Best Investment” (2008) 
NRG: The center of the power industry value chain. 
Fuel 
Transportation 
NRG 
Power 
Generation 
Reliant Energy 
Transmission Distribution Retail 
(Customer) 
• Oil, gas, coal 
companies 
• Common carriers: 
Pipelines, Trains, 
Ships 
• Investor and 
Government Owned 
Utilities 
• Merchant Generator 
(NRG, etc.) 
• From Generator 
to Distribution 
substation 
• From Distribution 
substation to 
home or business 
• Residential, 
commercial, and 
industrial 
NRG US Wholesale generation 
totaling 23,475 MW (1) 
• 10,660 MW gas 
• 7,560 MW coal 
• 3,715 MW oil 
• 1,175 MW nuclear 
• 365 MW renewables 
(1) MW data as of December 31, 2009 
Listed: NYSE (NRG) 
Market Cap.: ~$6 billion; Employees: ~4,300 
Generating Assets: ~23,500 MW, primarily in four domestic regions
Global Power Markets 2010: CEO Round Table 
14 
Fossil fuels go to the customer, customers need to go to Renewables 
Resource 
Dark=Higher 
Light=Lower 
Renewables are: 
• Smaller 
• Broader 
• More local 
• Situationally dependent 
Wind 
Wind, Solar 
Distributed 
MAB1 
Biomass CHP 
Plasma 
Biomass 
Corridor 
Regional 
Centers of 
Excellence 
Solar 
PV 
Solar 
CSP
Global Power Markets 2010: CEO Round Table 
Jack A. Fusco , 
Pre side nt, Chie f Exe cutive Office r
Global Power Markets 2010: CEO Round Table 
Southeast 
6,104 MW 
25% 
North 
3,350 MW 
14% 
West 
7,854 MW 
31% Texas 
7,487 MW 
30% 
Baseload 
4,080 MW 
16% 
Peaking 
5,145 MW 
21% 
Intermediate 
15,570 MW 
63% 
National Portfolio of nearly 25,000 MW
Global Power Markets 2010: CEO Round Table 
Calpine is the nation’s largest baseload renewable, natural gas 
and cogeneration power provider 
Modern 
- 
50 
40 
30 
20 
10 
CPN DYN RRI NRG MIR 
Age (Years) 
Efficient 
Source: Energy Velocity (2008). Not adjusted for steam, and excluding non-fossil 
fuel generation. 
2,500 
2,000 
1,500 
1,000 
500 
- 
100,000 
80,000 
60,000 
40,000 
20,000 
14,000 
12,000 
10,000 
8,000 
Note: All DYN figures are shown pro forma, adjusted to reflect estimated impact of the sale of certain assets to LS Power during 2009. 
CPN DYN MIR NRG RRI 
CO2 lbs. / MWh 
Clean 
- 
CPN NRG DYN RRI MIR 
2008 Generation (MWh) 
Scale 
Source: Energy Source: Energy Velocity (2008). Velocity (2008). 
Source: 2008 SEC filings, Energy Velocity. 
6,000 
CPN DYN RRI NRG MIR 
Heat Rate (btu/KWh) 
Our steam-adjusted heat 
rate is 7,231
Global Power Markets 2010: CEO Round Table 
Trend Impact on 
CCTG Fleet 
Calpine: Calpine: P Poossititioionneedd f foorr t thhee F Fuuttuurree 
Impact on 
Coal Fleet
Global Power Markets 2010: CEO Round Table 
Michael G. Morris, 
Chairman, President and CEO
Global Power Markets 2010: CEO Round Table 
Serving 5.2 million 
customers in 11 states 
2009 Earnings Contribution 
Columbus 
Southern 
Power 
20% 
Appalachian 
Power 
13% 
All Others 
6% 
Indiana & 
Michigan 
16% 
Public 
Service of 
Oklahoma 
5% 
Southwestern 
Electric 
Power 
9% 
Texas 
7% 
Kentucky 
Power 
2% 
2009 Retail Load Fuel Mix** 
Residential 
32% 
Commercial 
27% 
Wholesale * 
11% 
Nuclear 
6% 
Natural Gas 
22% 
Hydro/Wind 
6% 
** Based on Capacity 
AEP’s Regulated Utility Platform 
Ohio 
Power 
22% 
Industrial 
30% 
* Wholesale includes sales to municipal 
and cooperative power systems, other 
wholesale, and other retail sales 
Coal 66%
Global Power Markets 2010: CEO Round Table 
SSPPPP EERRCCOOTT PPJJMM PPJJMM//MMIISSOO 
Prairie Wind COD: 2013-14 
 110 miles of 765 kV 
 Partners: Westar (50%) & Electric 
Transmission America (50%) 
 Estimated Cost: $400 million 
 ROE: 12.8% 
Tallgrass COD: 2013-14 
AACCTTIIVVEE 
PPRROOJJEECCTTSS 
Pioneer COD: 2015 
FFUUTTUURREE 
DDEEVVEELLOOPPMMEENNTT 
ETT COD: 2010-2017 
 345 kV ERCOT Expansion 
 Partner: MidAmerican Energy (50%) 
 Estimated Cost: $1.4 billion 
 ROE: 9.96% 
 170 miles of 765 kV 
 Partners: OG&E (50%) & Electric 
Transmission America (50%) 
 Estimated Cost: $500 million 
 ROE: 12.8% 
PATH-WV COD: 2014 
 275 miles of 765 kV 
 Partner: Allegheny Energy (50%) 
 Estimated Cost: $1.2 billion 
 ROE: 14.3% 
 240 miles of 765 kV 
 Partner: Duke Energy (50%) 
 Estimated Cost: $1 billion 
 ROE: 12.54% 
SPP EHV Overlay 
 Regional Expansion of 765 kV Backbone 
SMARTransmission Study 
 Interregional EHV & Wind Integration 
Study 
 Partners: ATC, Exelon, MidAmerican 
Energy, Northwestern Energy, Xcel 
Energy 
ETT COD: various 
 Additional CREZ spend of ~ $1.1 billion (COD 
2012-2013, subject to a 6-month routing 
approval) 
 Other Projects Pending Transfer of ~ $600 
million (COD 2010-2013) 
PJM Expansion 
 Regional Expansion of 765 kV, 500 kV 
and 345 kV systems 
EHV Michigan/Ohio 
 700 miles of Proposed 765 kV 
SSPPPP EERRCCOOTT PPJJMM PPJJMM//MMIISSOO
Global Power Markets 2010: CEO Round Table 
Renewables Portfolio* 
Wind 
PSO – 5 PPAs 591 MW 
SWEPCo – 1 PPA 79 MW 
APCo – 4 PPAs 376 MW 
I&M – 2 PPAs 150 MW 
KPCo – 1 PPA 100 MW 
AEP Ohio – 2 PPAs 110 MW 
Total Regulated 1,406 MW 
AEPEP – owned 311 MW 
AEPEP – 2 PPAs 177 MW 
Non-regulated 487 MW 
Hydro 
(run-of-river) 
Regulated, owned/PPA 364 MW 
Solar 
Regulated - PPA 10 MW 
* Includes owned assets and long-term 
purchased power agreements (PPA)
Global Power Markets 2010: CEO Round Table 
Zin Smati, 
President, Chief Executive Officer
Global Power Markets 2010: CEO Round Table 
24 
EE uu rr oo pp ee 
RReevveennuuee:: €€6688..66 bbnn 
118811,,992200 eemmpp.. 
Leader in Electricity 
World’s largest IPP 
#5 power producer in Europe 
Committed to renewables: 13GW of 
renewable production at present 
NN oo rr tt hh 
AA mm ee rr ii cc aa 
RReevveennuuee:: €€44..66 bbnn 
55,,330000 eemmpp.. 
Leader in Natural Gas 
#1 purchaser in Europe 
#1 transporter and distributor in Europe 
#2 operator of European storage 
Leader in LNG 
Trans-Atlantic leader in LNG industry, 
largest LNG tanker fleet 
#1 importer & buyer in Europe 
#1 importer into the U.S. 
SS oo uu tt hh 
AA mm ee rr ii cc aa 
RReevveennuuee:: €€22..66 
bbnn 33,,005500 eemmpp.. 
AA ff rr ii cc aa 
RReevveennuuee:: €€00..99 
bbnn 
33,,553300 eemmpp.. 
AA ss ii aa && 
PP aa cc ii ff ii cc 
RReevveennuuee:: €€33..22 bbnn 
66,,220000 eemmpp.. 
2009 revenues: €€7799..99 bbiilllliioonn 2009 EBITDA: €€1144..00 bbiilllliioonn 
Global workforce: 220000,,000000 eemmppllooyyeeeess Worldwide Generating Capacity: 7722,,666633 MMWW
Global Power Markets 2010: CEO Round Table 
25 
Current Fuel Mix 
Power Generation 
Coal 
12% 
Gas 
67% 
Renewable 
21% 
Northeast 
•Power Generation 
•LNG Importation 
•Gas Sales 
•Retail Sales 
Canada 
•Power 
Generation 
•Operate 2 of 
the largest wind 
farms in eastern 
Canada 
Texas •RECs 
•North American 
HQ 
•Power 
Generation 
•Gas Storage 
•Retail Sales 
Current Geographic Mix 
Power Generation 
TX 
14% 
Southeast 
Others 
12% 
Northeast 28% 
46% 
Mexico 
•Gas LDCs 
•Gas Pipelines 
•Gas Sales 
•Power 
Generation 
 One of the largest IPP’s 
 #3 biomass generator in U.S. 
 #1 private gas transmission 
company and #2 LDC in Mexico 
 #1 importer of LNG in U.S. 
 #2 C&I electricity retailer in U.S. 
Office 
Power Plant 
Renewable 
LNG Regas 
E & P Region
Global Power Markets 2010: CEO Round Table 
26 
How Is GDF SUEZ Positioning Itself 
in North America for the Future? 
Buy vs. Build 
Based on current economic circumstances – Buy more than Build to deepen and 
diversify 
•There are a number of good opportunities in the energy sector. 
Natural Gas 
Natural gas is the energy of choice to drive transition to a low-carbon economy. 
• Solidify our LNG and natural gas stronghold positions in New England and 
Mexico through existing and new gas supply and sales opportunities. 
• Continue growing in natural gas-fired generation (recent GDF SUEZ example: 
Astoria Energy I and II). 
Renewables 
Renewable energy is a strategic commitment of GDF SUEZ. We will develop both 
greenfield and acquisition opportunities to increase our renewable energy presence. 
• Further improve the carbon position of our fleet. 
• Avail ourselves to stimulus funding in U.S. and RFPs in Canada and Mexico.
Global Power Markets 2010: CEO Round Table 
27 
25th Annual 
Global Power Markets Conference 
Questions? 
Brave New World 
Preparing for a Post-Carbon Future 
April 11 – 13, 2010, Las Vegas, Nevada

Preparing for a post carbon future

  • 1.
    25th Annual GlobalPower Markets Conference Brave New World Preparing for a Post-Carbon Future April 11 – 13, 2010 Las Vegas, Nevada Peter Maloney Chief Editor, Platts Global Power Report
  • 2.
    Global Power Markets2010: CEO Round Table US Climate change/energy bills Bill Number Sponsor(s) Cap & trade Status Comment American Clean Energy and passed out of Security Act H.B. 2454 Waxman-Markey yes House June 26 Clean Energy Jobs and American Power Act S. 1733 Kerry-Boxer yes passed out of Env. & Pub. Works Comit. Nov. 5 Dept. of Ag. Handles offsets American Clean Energy Leadership S. 1462 Bingaman no passed by Energy & Nat. Res. Comit. June 17 energy only Clean Energy Partnerships Act S. 2729 Stabebnow no referred to Sen. Env. & Pub. Works Comit. outline for offsets Clean Energy Act S. 2776 Alexander-Webb no introduced Nov. 1, 2009 nuclear power, loan guarantees Carbon Limits and Energy for American's Renewal Act S. 2877 Cantwell-Collins no introduced Dec.1, 2009; referred to finance committee cap and dividend draft na Kerry-Graham- Liebermann unknown draft
  • 3.
    Global Power Markets2010: CEO Round Table Climate Hot Air Index 250 200 150 100 50 0 105th (1997-98) 106th (1999-00) 107th (2001-02) 108th (2003-04) 109th (2005-06) 110th (2007-08) Congress legislative initiatives
  • 4.
    Global Power Markets2010: CEO Round Table Electricity demand three year rolling average % growth 12 10 8 6 4 2 0 -2 1950 1960 1970 1980 1990 2000 2010 2020 2030 Source: Energy Information Administration Period Annual growth 1950s 9.8 1960s 7.3 1970s 4.7 1980s 2.9 1990s 2.4 2000-2008 0.9 2008-2035 1.0
  • 5.
    Global Power Markets2010: CEO Round Table Spot on-peak power prices 300 250 200 150 100 50 0 3/3/2008 5/3/2008 7/3/2008 9/3/2008 1/3/2009 3/3/2009 5/3/2009 7/3/2009 9/3/2009 11/3/2008 11/3/2009 1/3/2010 $/MW-month Mass Hub PJM Western Hub NI Hub Into Southern SP15 Spot natural gas prices 18 16 14 12 10 8 6 4 2 0 3/3/2008 5/3/2008 7/3/2008 9/3/2008 1/3/2009 3/3/2009 5/3/2009 7/3/2009 9/3/2009 11/3/2008 11/3/2009 1/3/2010 $MMBtu Algonquin Columbia Gas App SoCal Gas Chicago Transco Zone-3 A double whammy on pricing
  • 6.
    Global Power Markets2010: CEO Round Table Recipients of cash grants in lieu of PTCs under the ARRA total awards as of April 2010, $3 billion • Acciona • AES Corp. • Cannon Power • enXco • E.ON • Eurus • EverPower • First Wind • Heritage Sustainable Energy • Horizon Wind Energy • Iberdrola • Invenergy • John Deere • NaturEner • Next Era Energy Resources • Puget Sound Energy • Valero
  • 7.
    Global Power Markets2010: CEO Round Table Federal loan guarantee commitments • Kahuku Wind Power, $117 million, wind farm • SAGE Electrochromics, $72 million, energy efficient window factory • BrightSource Energy, $1.4 billion, solar power project • Vogtle (Georgia Power, Oglethorpe Power, Municipal Electric Authority of Georgia, Dalton, Ga. ), $8.3 billion, two nuclear power units • Solyndra, $535 million, cylindrical solar PV panel factory • Beacon Power, $43 million, flywheel energy storage plant • Nordic Windpower, $16 million, wind turbine assembly factory • Red River Environmental Products, $245 million, activated carbon factory • Ford Motor, $5.9 billion, more fuel efficient cars • Nissan, $1.4 billion, electric cars and battery packs • Tesla Motors, $465 million, battery packs and electric drive trains • Fisker Automotive, $528.7 million, plug-in hybrid vehicles
  • 8.
    Global Power Markets2010: CEO Round Table Power plants under construction in the US, by fuel 7,000 6,000 5,000 4,000 3,000 2,000 1,000 0 2009 2010 2011 2012 2013 MW COAL Natural Gas Nuclear Solar WIND
  • 9.
    Global Power Markets2010: CEO Round Table Power plants in development, by fuel 18,000 16,000 14,000 12,000 10,000 8,000 6,000 4,000 2,000 0 2009 2010 2011 2012 2013 2014 2015 2016 2017 2018 2019 2020 MW COAL Natural Gas Nuclear SOLAR WIND
  • 10.
    Global Power Markets2010: CEO Round Table Brave new technologies • Smart grid technologies • Demand side management and energy efficiency • New solar panels and solar cells • Carbon capture and storage • Flywheel storage • Battery storage • Electric vehicles • Hybrid vehicles
  • 11.
    Global Power Markets2010: CEO Round Table David Crane, President, Chief Executive Officer
  • 12.
    Global Power Markets2010: CEO Round Table 12 South Central Western Northeast Texas Combined Scale1 Gas 2,130MW 99% Oil 3,715 MW 53% Gas 1,430 MW 20% Coal 1,870 MW 27% Coal 7,560 MW 32% Oil 3,715 MW 16% Nuclear 1,175 MW 5% 4,180 MW Wind 345 MW 3% Nuclear 1,175 MW 10% Coal Gas 37% 5,640 MW 50% 1 Includes 115 MW as part of NRG’s Thermal assets. For combined scale, approximately 2,095 MW is dual-fuel capable. Reflects only domestic generation capacity as of December 31, 2009 Gas 10,660 MW Renewables 45% 365 MW 2% Solar 20 MW <1% Coal 1,495 MW 52% Gas 1,355 MW 48%
  • 13.
    Global Power Markets2010: CEO Round Table 13 Platt’s 2007 Recipient of Energy Company and Industry Leader of the Year Fuel Supply Fortune 500– Ranked 12th Fastest Growing Company (2009) Fortune 500– Ranked in top 10% for “Best Investment” (2008) NRG: The center of the power industry value chain. Fuel Transportation NRG Power Generation Reliant Energy Transmission Distribution Retail (Customer) • Oil, gas, coal companies • Common carriers: Pipelines, Trains, Ships • Investor and Government Owned Utilities • Merchant Generator (NRG, etc.) • From Generator to Distribution substation • From Distribution substation to home or business • Residential, commercial, and industrial NRG US Wholesale generation totaling 23,475 MW (1) • 10,660 MW gas • 7,560 MW coal • 3,715 MW oil • 1,175 MW nuclear • 365 MW renewables (1) MW data as of December 31, 2009 Listed: NYSE (NRG) Market Cap.: ~$6 billion; Employees: ~4,300 Generating Assets: ~23,500 MW, primarily in four domestic regions
  • 14.
    Global Power Markets2010: CEO Round Table 14 Fossil fuels go to the customer, customers need to go to Renewables Resource Dark=Higher Light=Lower Renewables are: • Smaller • Broader • More local • Situationally dependent Wind Wind, Solar Distributed MAB1 Biomass CHP Plasma Biomass Corridor Regional Centers of Excellence Solar PV Solar CSP
  • 15.
    Global Power Markets2010: CEO Round Table Jack A. Fusco , Pre side nt, Chie f Exe cutive Office r
  • 16.
    Global Power Markets2010: CEO Round Table Southeast 6,104 MW 25% North 3,350 MW 14% West 7,854 MW 31% Texas 7,487 MW 30% Baseload 4,080 MW 16% Peaking 5,145 MW 21% Intermediate 15,570 MW 63% National Portfolio of nearly 25,000 MW
  • 17.
    Global Power Markets2010: CEO Round Table Calpine is the nation’s largest baseload renewable, natural gas Calpine is the nation’s largest baseload renewable, natural gas and cogeneration power provider and cogeneration power provider Modern - 50 40 30 20 10 CPN DYN RRI NRG MIR Age (Years) Efficient Source: Energy Velocity (2008). Not adjusted for steam, and excluding non-fossil fuel generation. 2,500 2,000 1,500 1,000 500 - 100,000 80,000 60,000 40,000 20,000 14,000 12,000 10,000 8,000 Note: All DYN figures are shown pro forma, adjusted to reflect estimated impact of the sale of certain assets to LS Power during 2009. CPN DYN MIR NRG RRI CO2 lbs. / MWh Clean - CPN NRG DYN RRI MIR 2008 Generation (MWh) Scale Source: Energy Source: Energy Velocity (2008). Velocity (2008). Source: 2008 SEC filings, Energy Velocity. 6,000 CPN DYN RRI NRG MIR Heat Rate (btu/KWh) Our steam-adjusted heat rate is 7,231
  • 18.
    Global Power Markets2010: CEO Round Table Trend Impact on CCTG Fleet Calpine: Calpine: P Poossititioionneedd f foorr t thhee F Fuuttuurree Impact on Coal Fleet
  • 19.
    Global Power Markets2010: CEO Round Table Michael G. Morris, Chairman, President and CEO
  • 20.
    Global Power Markets2010: CEO Round Table Serving 5.2 million customers in 11 states 2009 Earnings Contribution Columbus Southern Power 20% Appalachian Power 13% All Others 6% Indiana & Michigan 16% Public Service of Oklahoma 5% Southwestern Electric Power 9% Texas 7% Kentucky Power 2% 2009 Retail Load Fuel Mix** Residential 32% Commercial 27% Wholesale * 11% Nuclear 6% Natural Gas 22% Hydro/Wind 6% ** Based on Capacity AEP’s Regulated Utility Platform Ohio Power 22% Industrial 30% * Wholesale includes sales to municipal and cooperative power systems, other wholesale, and other retail sales Coal 66%
  • 21.
    Global Power Markets2010: CEO Round Table SSPPPP EERRCCOOTT PPJJMM PPJJMM//MMIISSOO Prairie Wind COD: 2013-14  110 miles of 765 kV  Partners: Westar (50%) & Electric Transmission America (50%)  Estimated Cost: $400 million  ROE: 12.8% Tallgrass COD: 2013-14 AACCTTIIVVEE PPRROOJJEECCTTSS Pioneer COD: 2015 FFUUTTUURREE DDEEVVEELLOOPPMMEENNTT ETT COD: 2010-2017  345 kV ERCOT Expansion  Partner: MidAmerican Energy (50%)  Estimated Cost: $1.4 billion  ROE: 9.96%  170 miles of 765 kV  Partners: OG&E (50%) & Electric Transmission America (50%)  Estimated Cost: $500 million  ROE: 12.8% PATH-WV COD: 2014  275 miles of 765 kV  Partner: Allegheny Energy (50%)  Estimated Cost: $1.2 billion  ROE: 14.3%  240 miles of 765 kV  Partner: Duke Energy (50%)  Estimated Cost: $1 billion  ROE: 12.54% SPP EHV Overlay  Regional Expansion of 765 kV Backbone SMARTransmission Study  Interregional EHV & Wind Integration Study  Partners: ATC, Exelon, MidAmerican Energy, Northwestern Energy, Xcel Energy ETT COD: various  Additional CREZ spend of ~ $1.1 billion (COD 2012-2013, subject to a 6-month routing approval)  Other Projects Pending Transfer of ~ $600 million (COD 2010-2013) PJM Expansion  Regional Expansion of 765 kV, 500 kV and 345 kV systems EHV Michigan/Ohio  700 miles of Proposed 765 kV SSPPPP EERRCCOOTT PPJJMM PPJJMM//MMIISSOO
  • 22.
    Global Power Markets2010: CEO Round Table Renewables Portfolio* Wind PSO – 5 PPAs 591 MW SWEPCo – 1 PPA 79 MW APCo – 4 PPAs 376 MW I&M – 2 PPAs 150 MW KPCo – 1 PPA 100 MW AEP Ohio – 2 PPAs 110 MW Total Regulated 1,406 MW AEPEP – owned 311 MW AEPEP – 2 PPAs 177 MW Non-regulated 487 MW Hydro (run-of-river) Regulated, owned/PPA 364 MW Solar Regulated - PPA 10 MW * Includes owned assets and long-term purchased power agreements (PPA)
  • 23.
    Global Power Markets2010: CEO Round Table Zin Smati, President, Chief Executive Officer
  • 24.
    Global Power Markets2010: CEO Round Table 24 EE uu rr oo pp ee RReevveennuuee:: €€6688..66 bbnn 118811,,992200 eemmpp.. Leader in Electricity World’s largest IPP #5 power producer in Europe Committed to renewables: 13GW of renewable production at present NN oo rr tt hh AA mm ee rr ii cc aa RReevveennuuee:: €€44..66 bbnn 55,,330000 eemmpp.. Leader in Natural Gas #1 purchaser in Europe #1 transporter and distributor in Europe #2 operator of European storage Leader in LNG Trans-Atlantic leader in LNG industry, largest LNG tanker fleet #1 importer & buyer in Europe #1 importer into the U.S. SS oo uu tt hh AA mm ee rr ii cc aa RReevveennuuee:: €€22..66 bbnn 33,,005500 eemmpp.. AA ff rr ii cc aa RReevveennuuee:: €€00..99 bbnn 33,,553300 eemmpp.. AA ss ii aa && PP aa cc ii ff ii cc RReevveennuuee:: €€33..22 bbnn 66,,220000 eemmpp.. 2009 revenues: €€7799..99 bbiilllliioonn 2009 EBITDA: €€1144..00 bbiilllliioonn Global workforce: 220000,,000000 eemmppllooyyeeeess Worldwide Generating Capacity: 7722,,666633 MMWW
  • 25.
    Global Power Markets2010: CEO Round Table 25 Current Fuel Mix Power Generation Coal 12% Gas 67% Renewable 21% Northeast •Power Generation •LNG Importation •Gas Sales •Retail Sales Canada •Power Generation •Operate 2 of the largest wind farms in eastern Canada Texas •RECs •North American HQ •Power Generation •Gas Storage •Retail Sales Current Geographic Mix Power Generation TX 14% Southeast Others 12% Northeast 28% 46% Mexico •Gas LDCs •Gas Pipelines •Gas Sales •Power Generation  One of the largest IPP’s  #3 biomass generator in U.S.  #1 private gas transmission company and #2 LDC in Mexico  #1 importer of LNG in U.S.  #2 C&I electricity retailer in U.S. Office Power Plant Renewable LNG Regas E & P Region
  • 26.
    Global Power Markets2010: CEO Round Table 26 How Is GDF SUEZ Positioning Itself in North America for the Future? Buy vs. Build Based on current economic circumstances – Buy more than Build to deepen and diversify •There are a number of good opportunities in the energy sector. Natural Gas Natural gas is the energy of choice to drive transition to a low-carbon economy. • Solidify our LNG and natural gas stronghold positions in New England and Mexico through existing and new gas supply and sales opportunities. • Continue growing in natural gas-fired generation (recent GDF SUEZ example: Astoria Energy I and II). Renewables Renewable energy is a strategic commitment of GDF SUEZ. We will develop both greenfield and acquisition opportunities to increase our renewable energy presence. • Further improve the carbon position of our fleet. • Avail ourselves to stimulus funding in U.S. and RFPs in Canada and Mexico.
  • 27.
    Global Power Markets2010: CEO Round Table 27 25th Annual Global Power Markets Conference Questions? Brave New World Preparing for a Post-Carbon Future April 11 – 13, 2010, Las Vegas, Nevada