Download to read offline

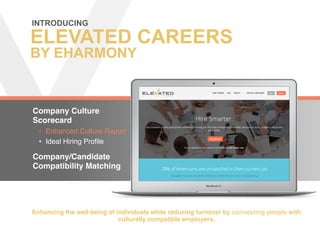
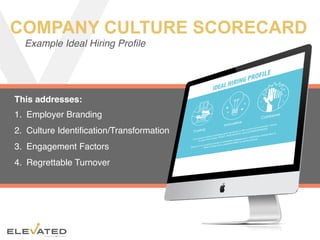

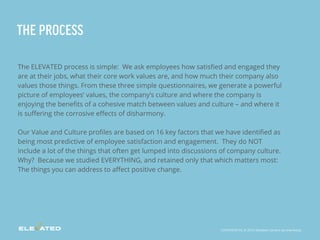
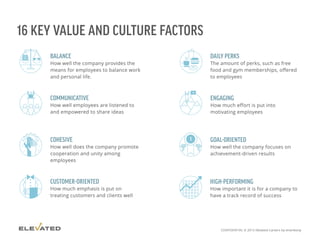
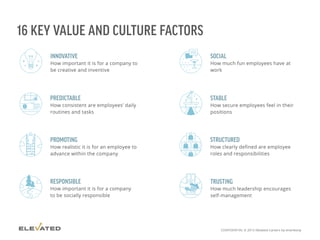
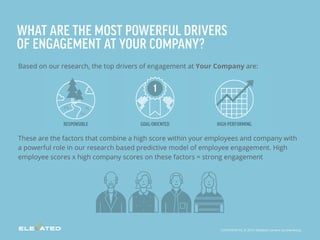
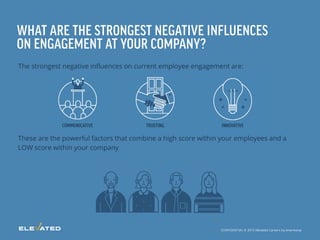
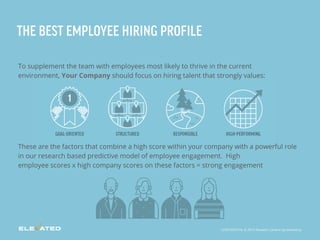
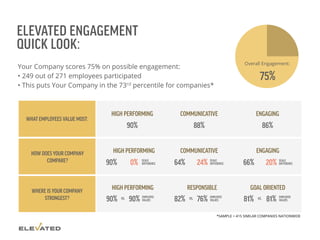
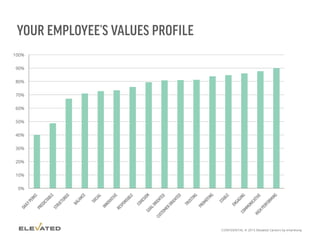
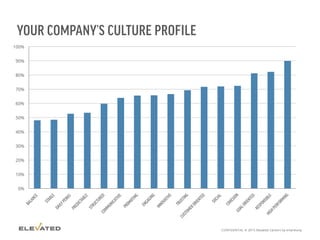
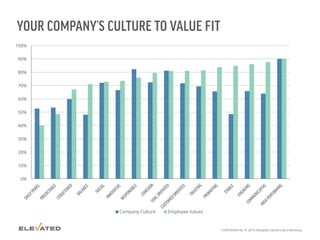
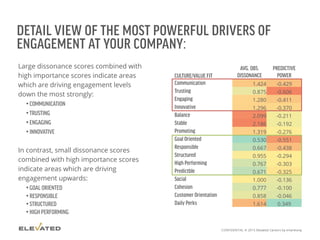
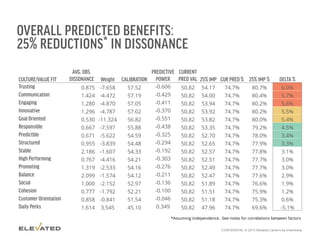
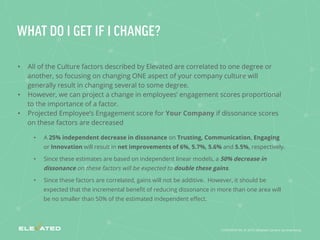
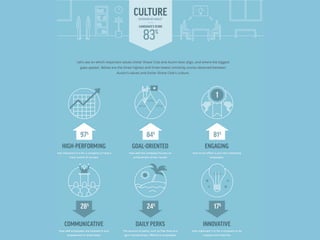
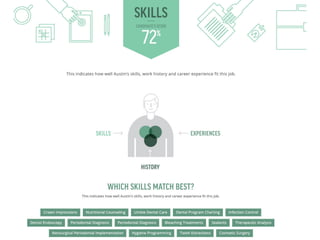
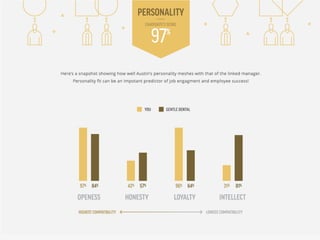
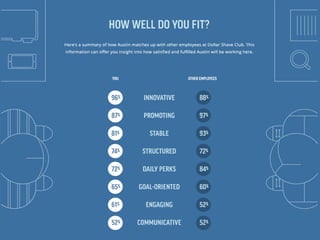

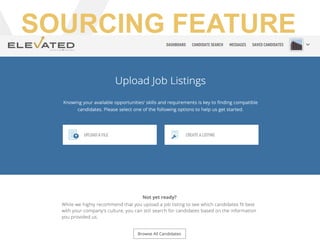
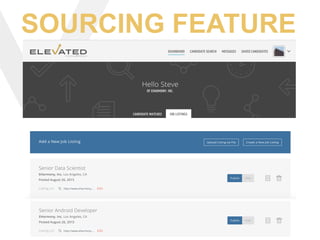
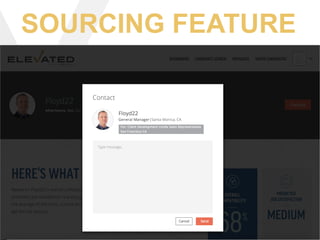
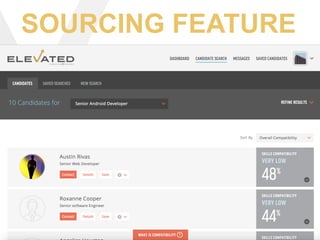


This document summarizes a company called Elevated Careers that uses assessments to match job candidates and employees to company cultures. It discusses generating culture and values profiles for companies based on 16 key factors predictive of engagement. Companies can see how well their culture fits employee values, the strongest drivers of and influences on engagement, and an ideal hiring profile. Elevated Careers then matches candidates to companies based on compatibility of values. The process aims to enhance employee well-being, reduce turnover, and connect people with compatible employers.


