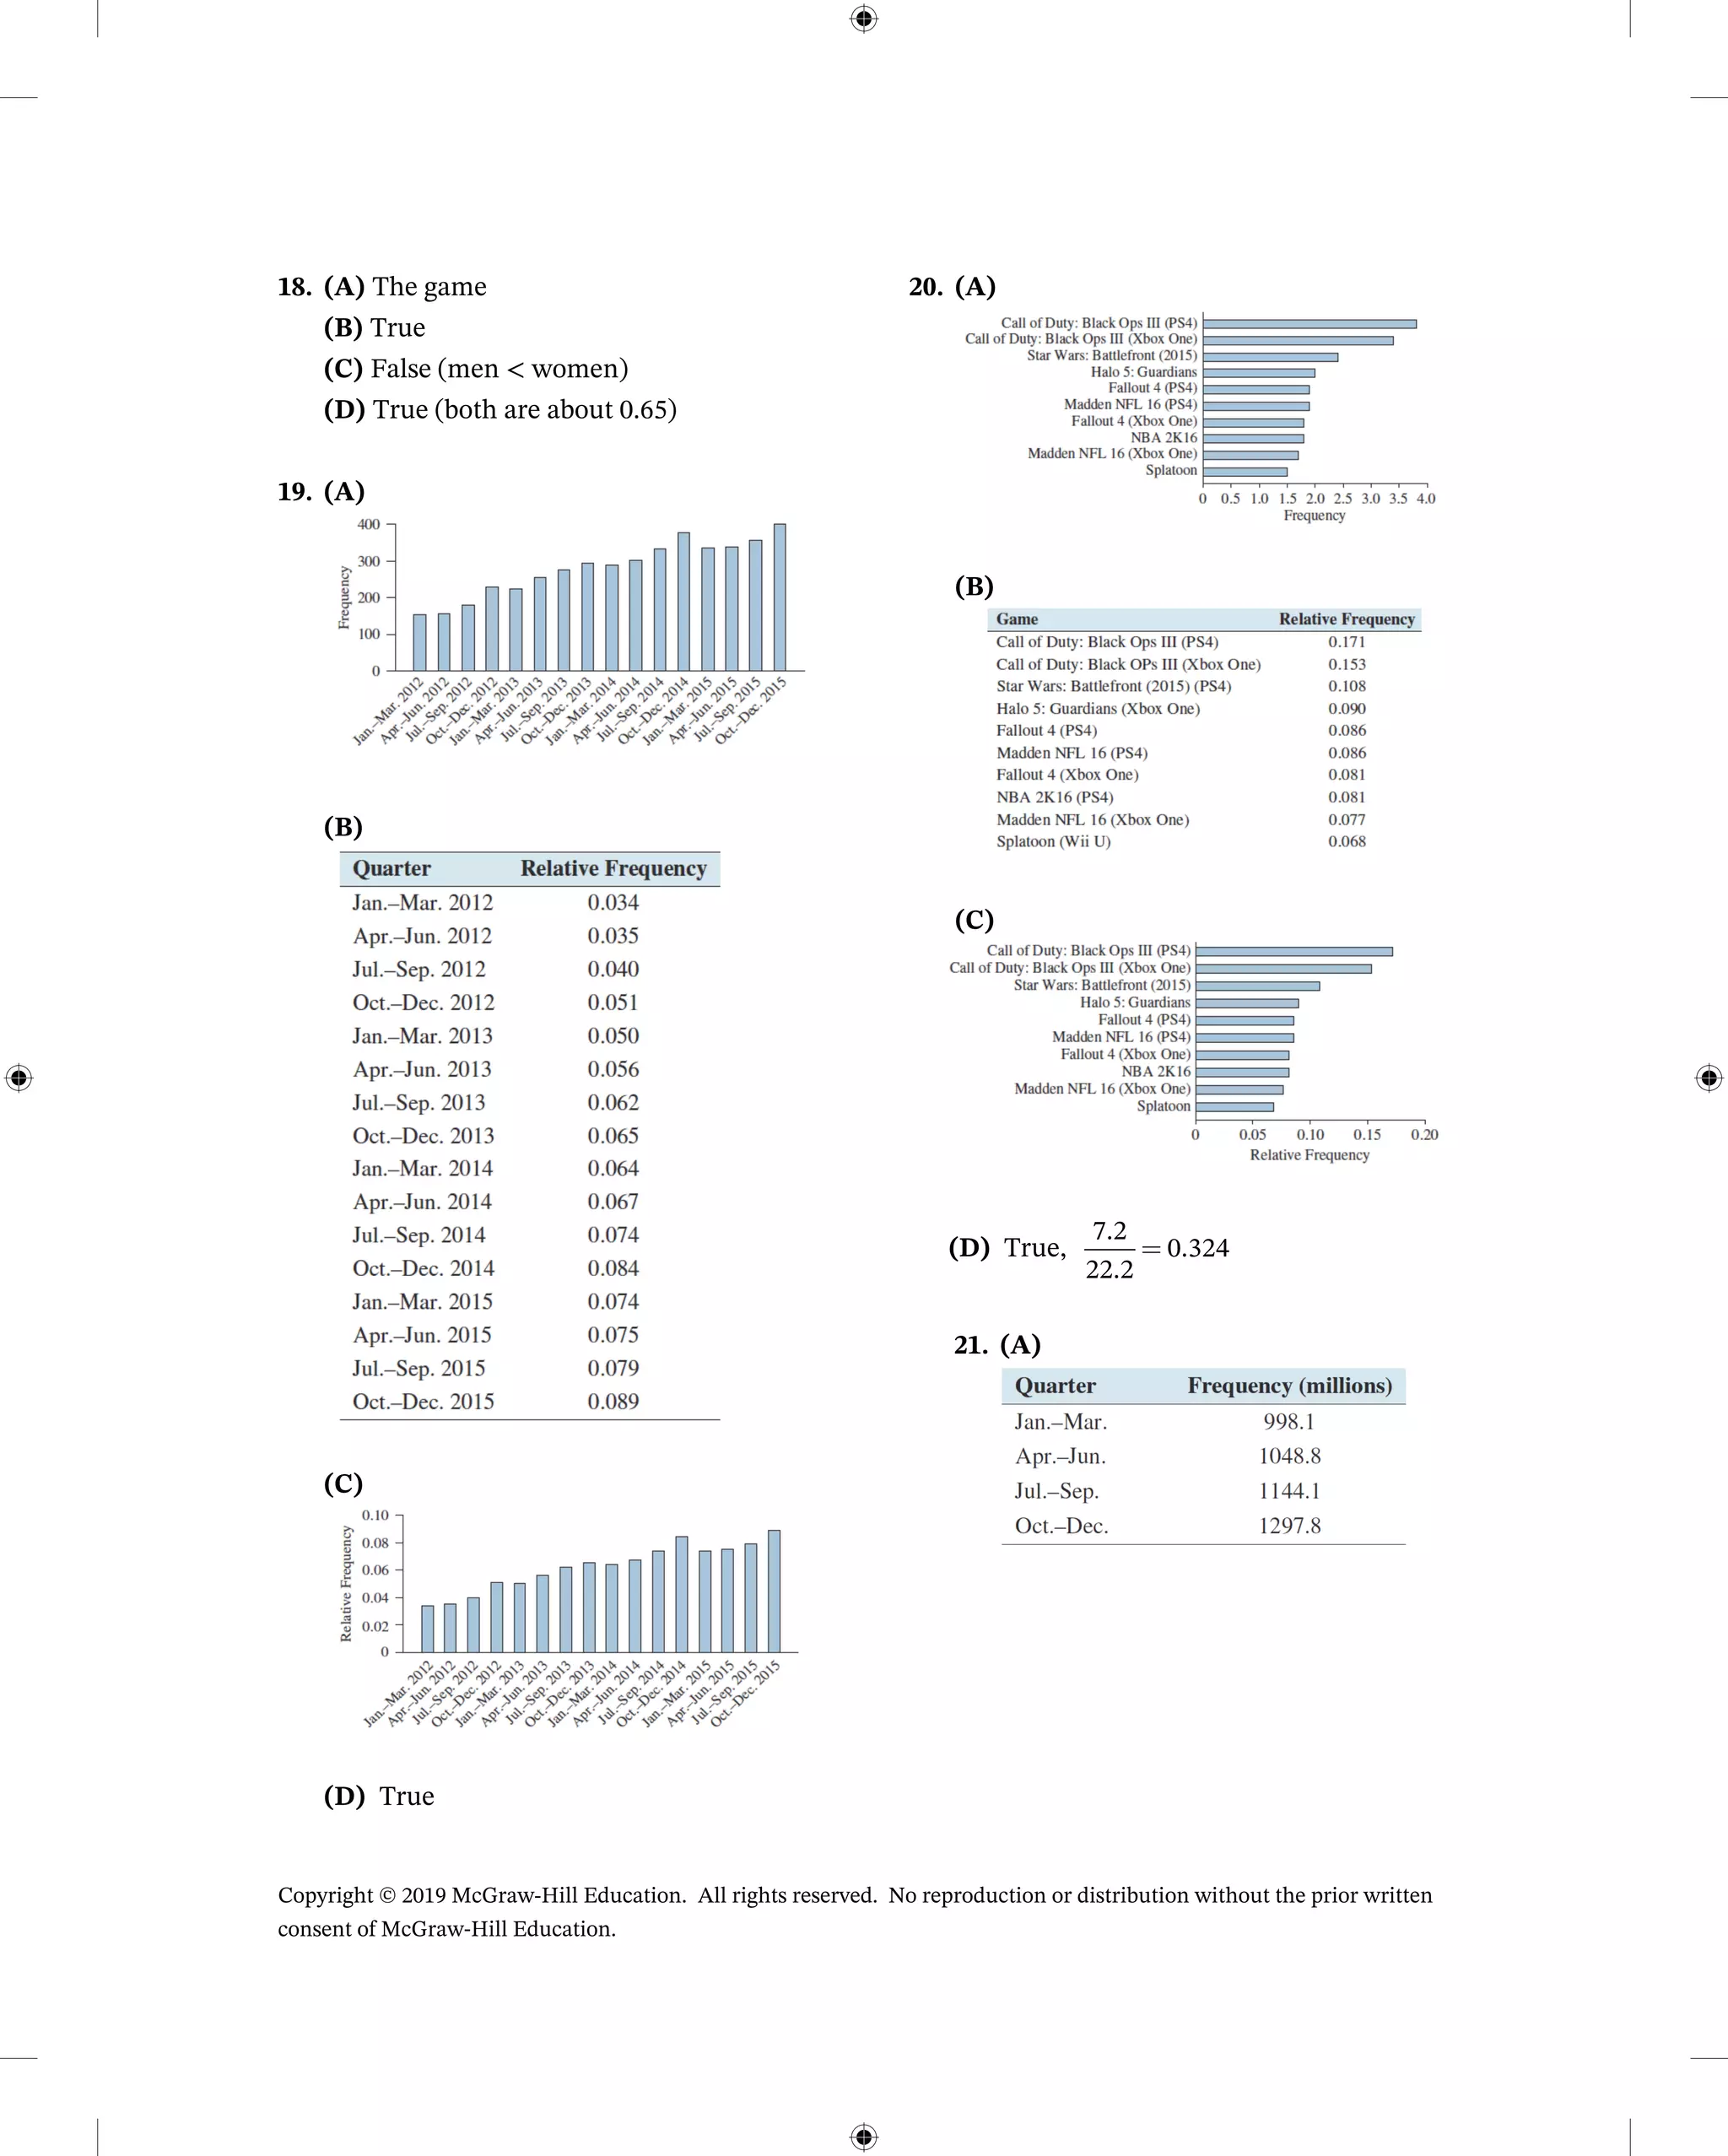
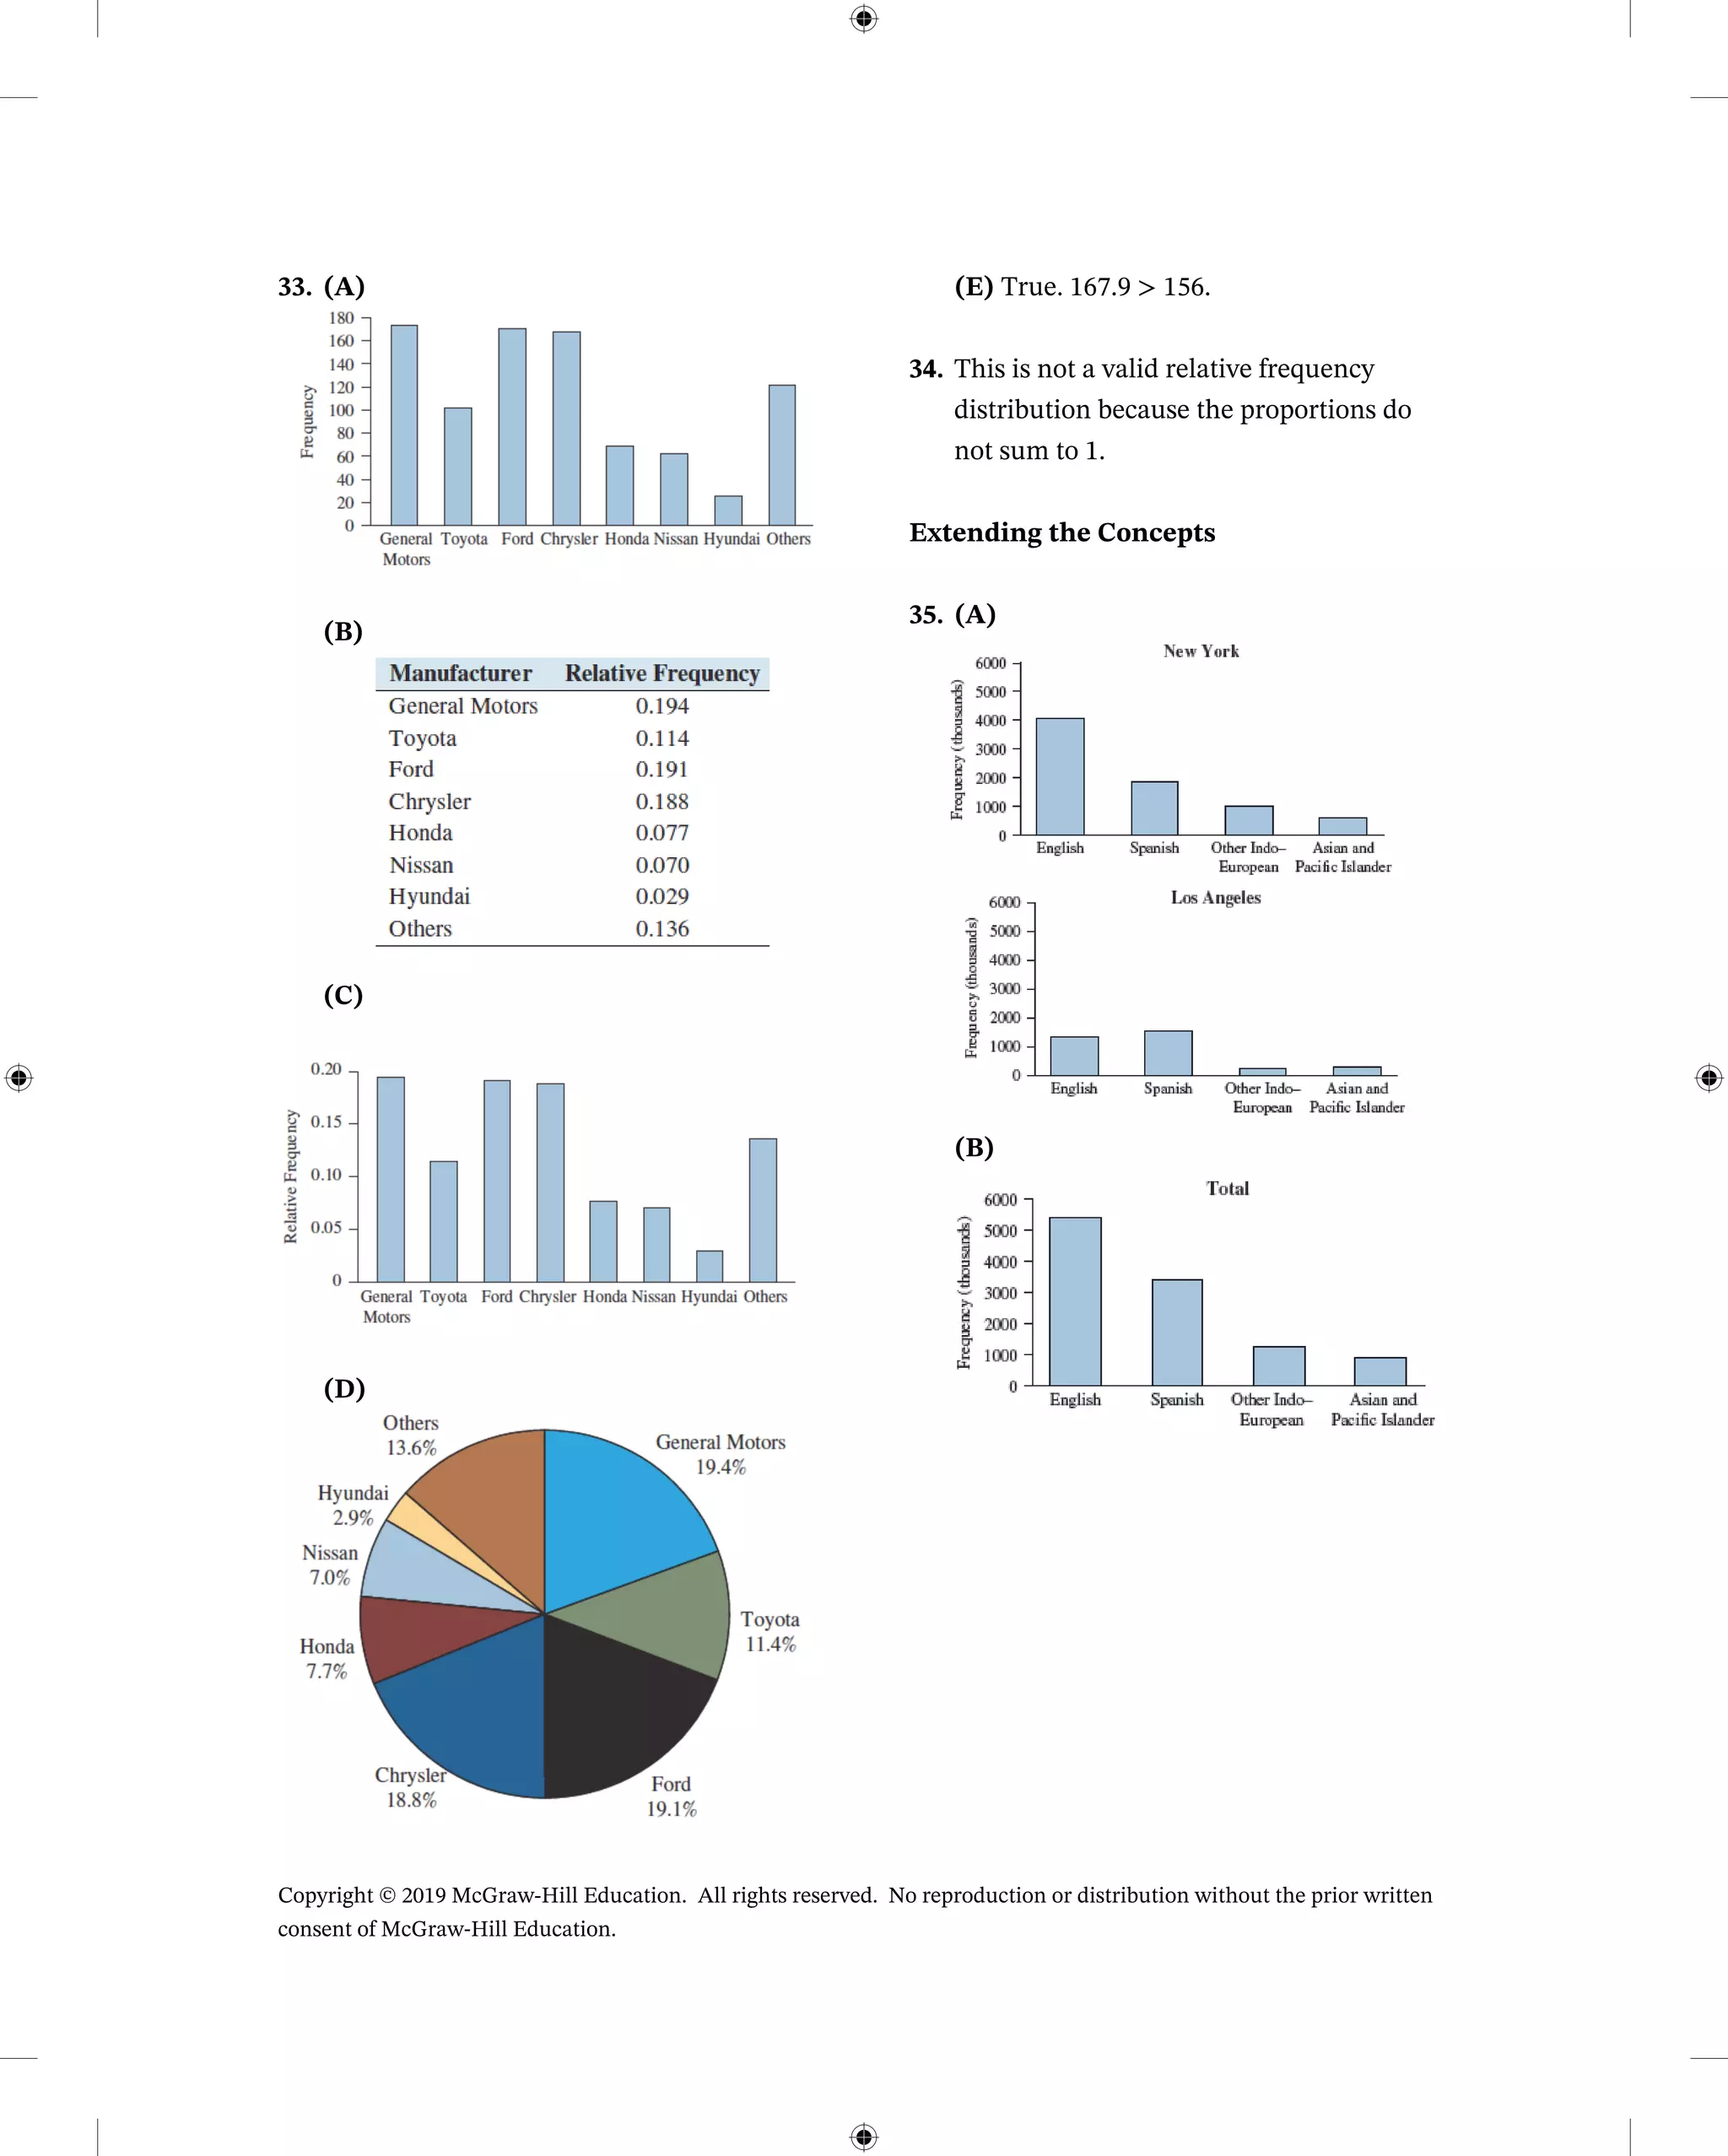
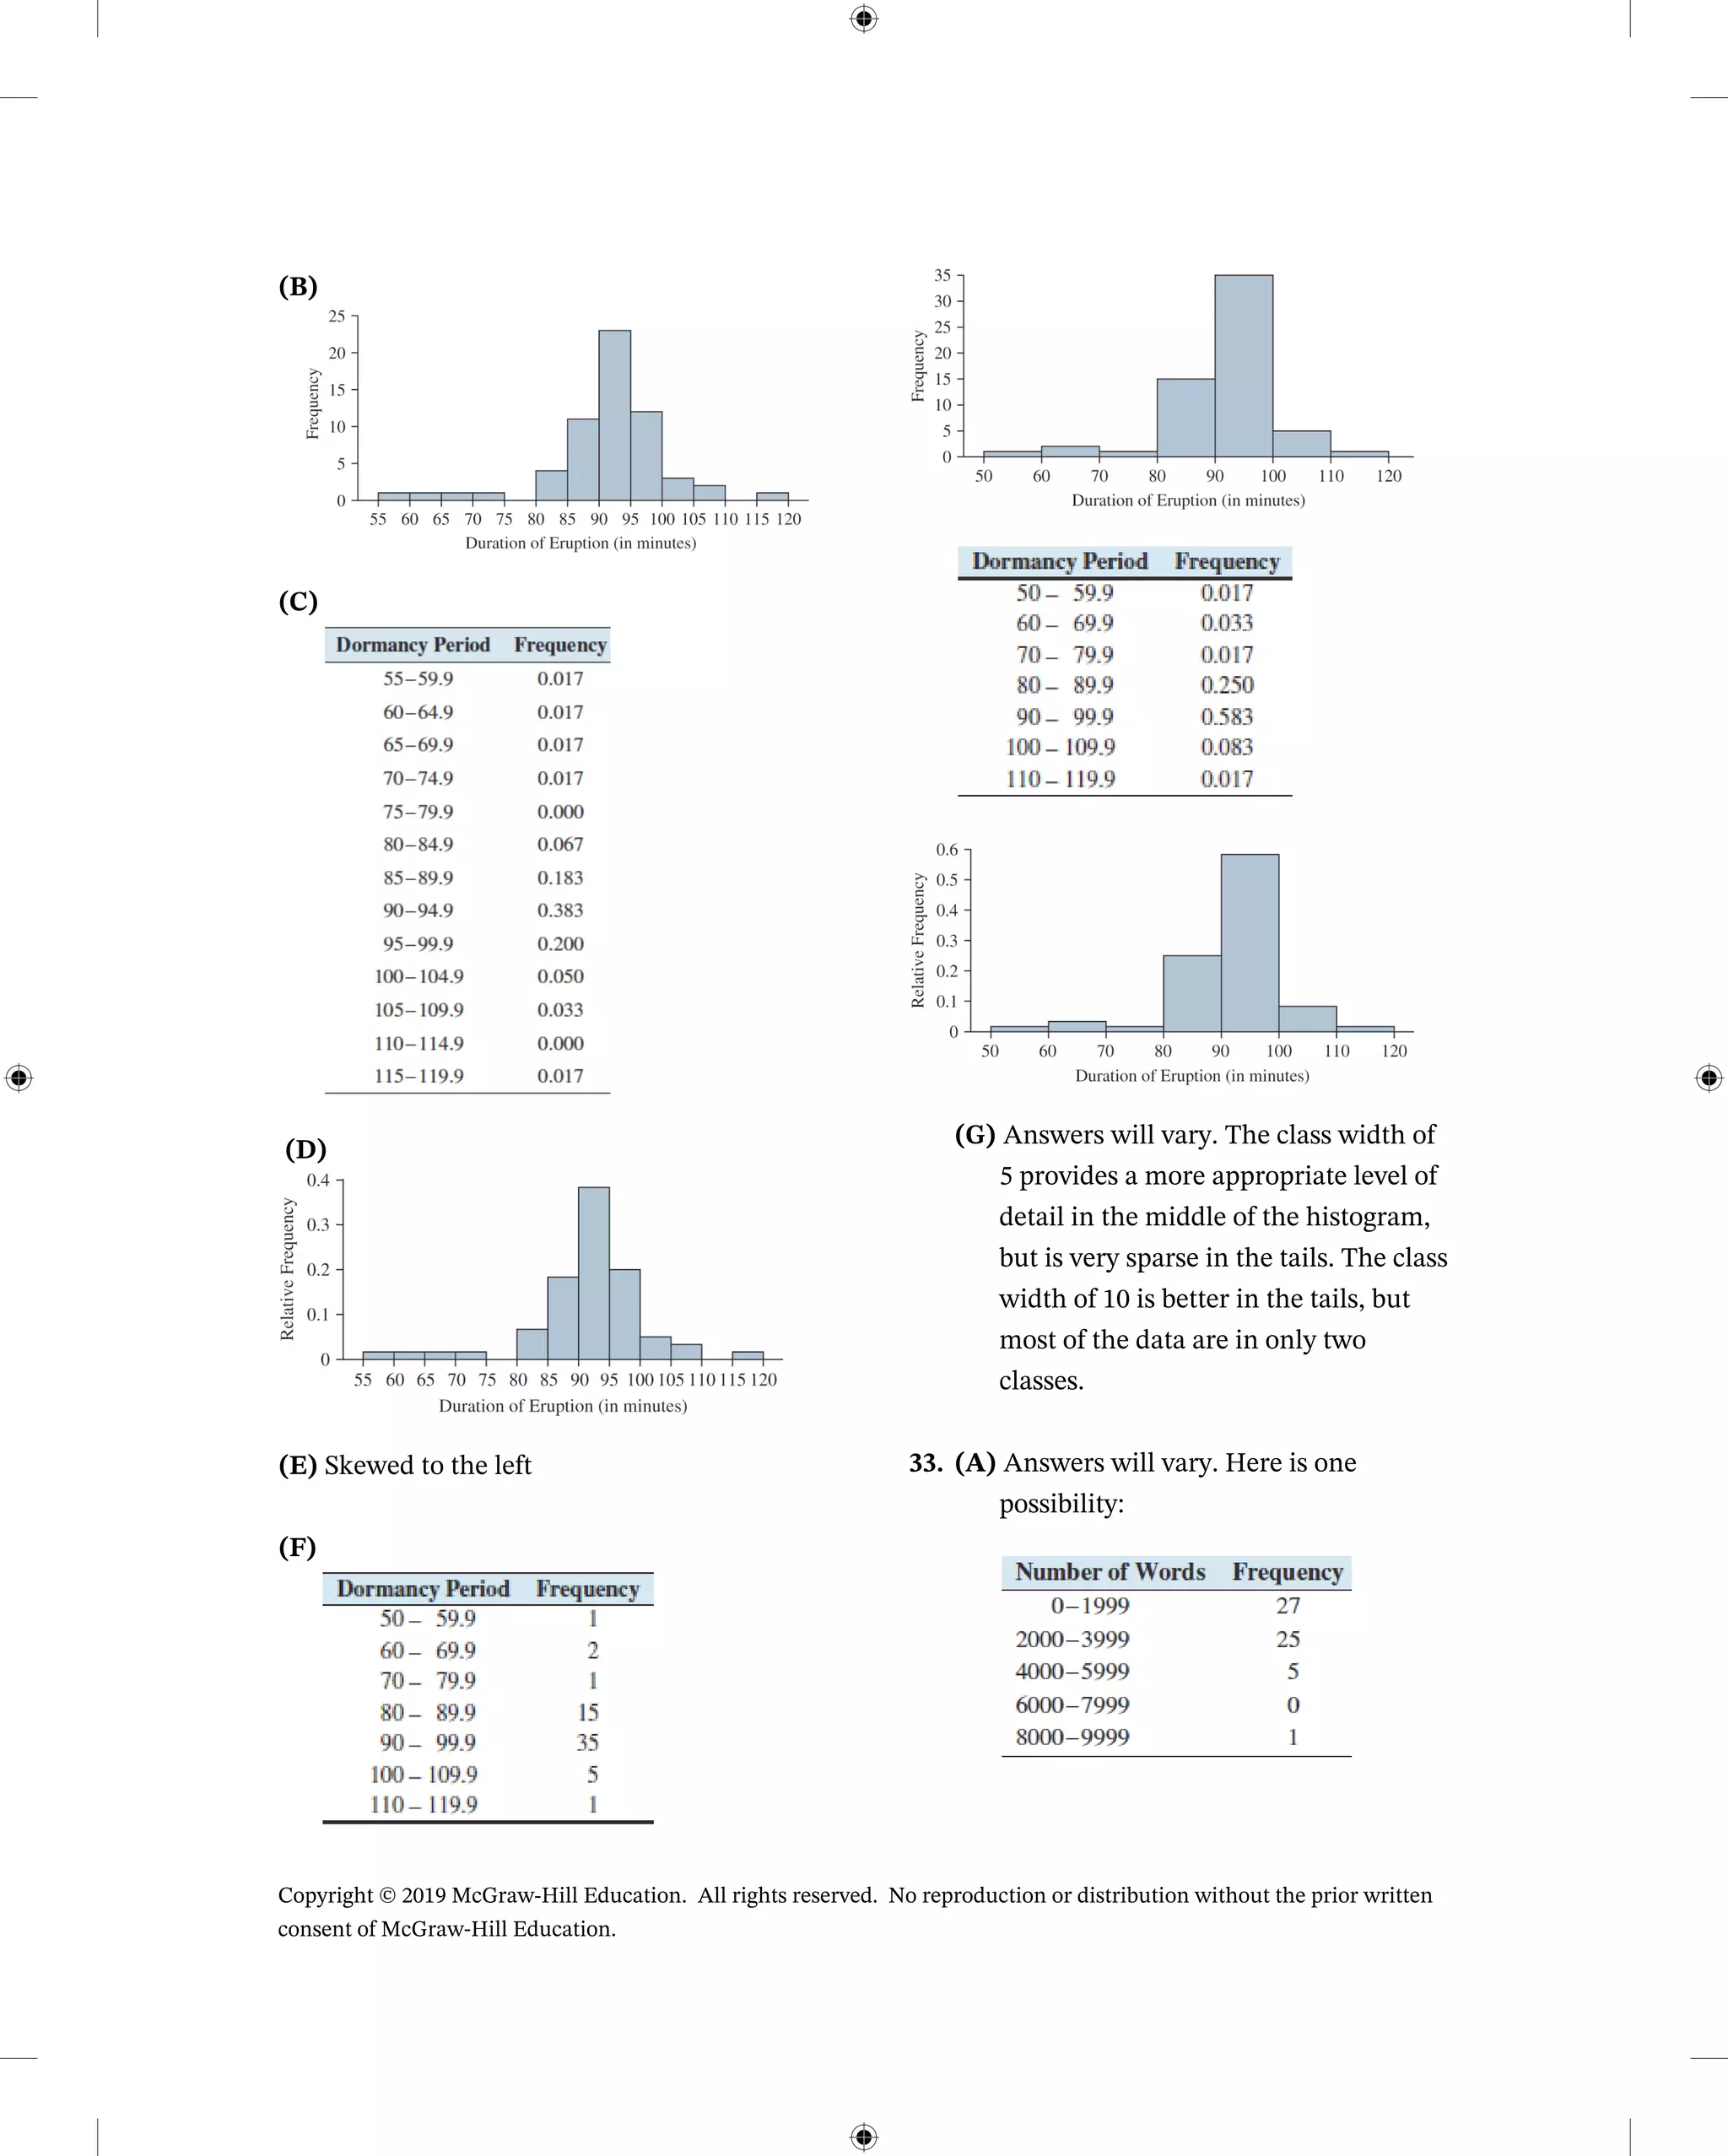
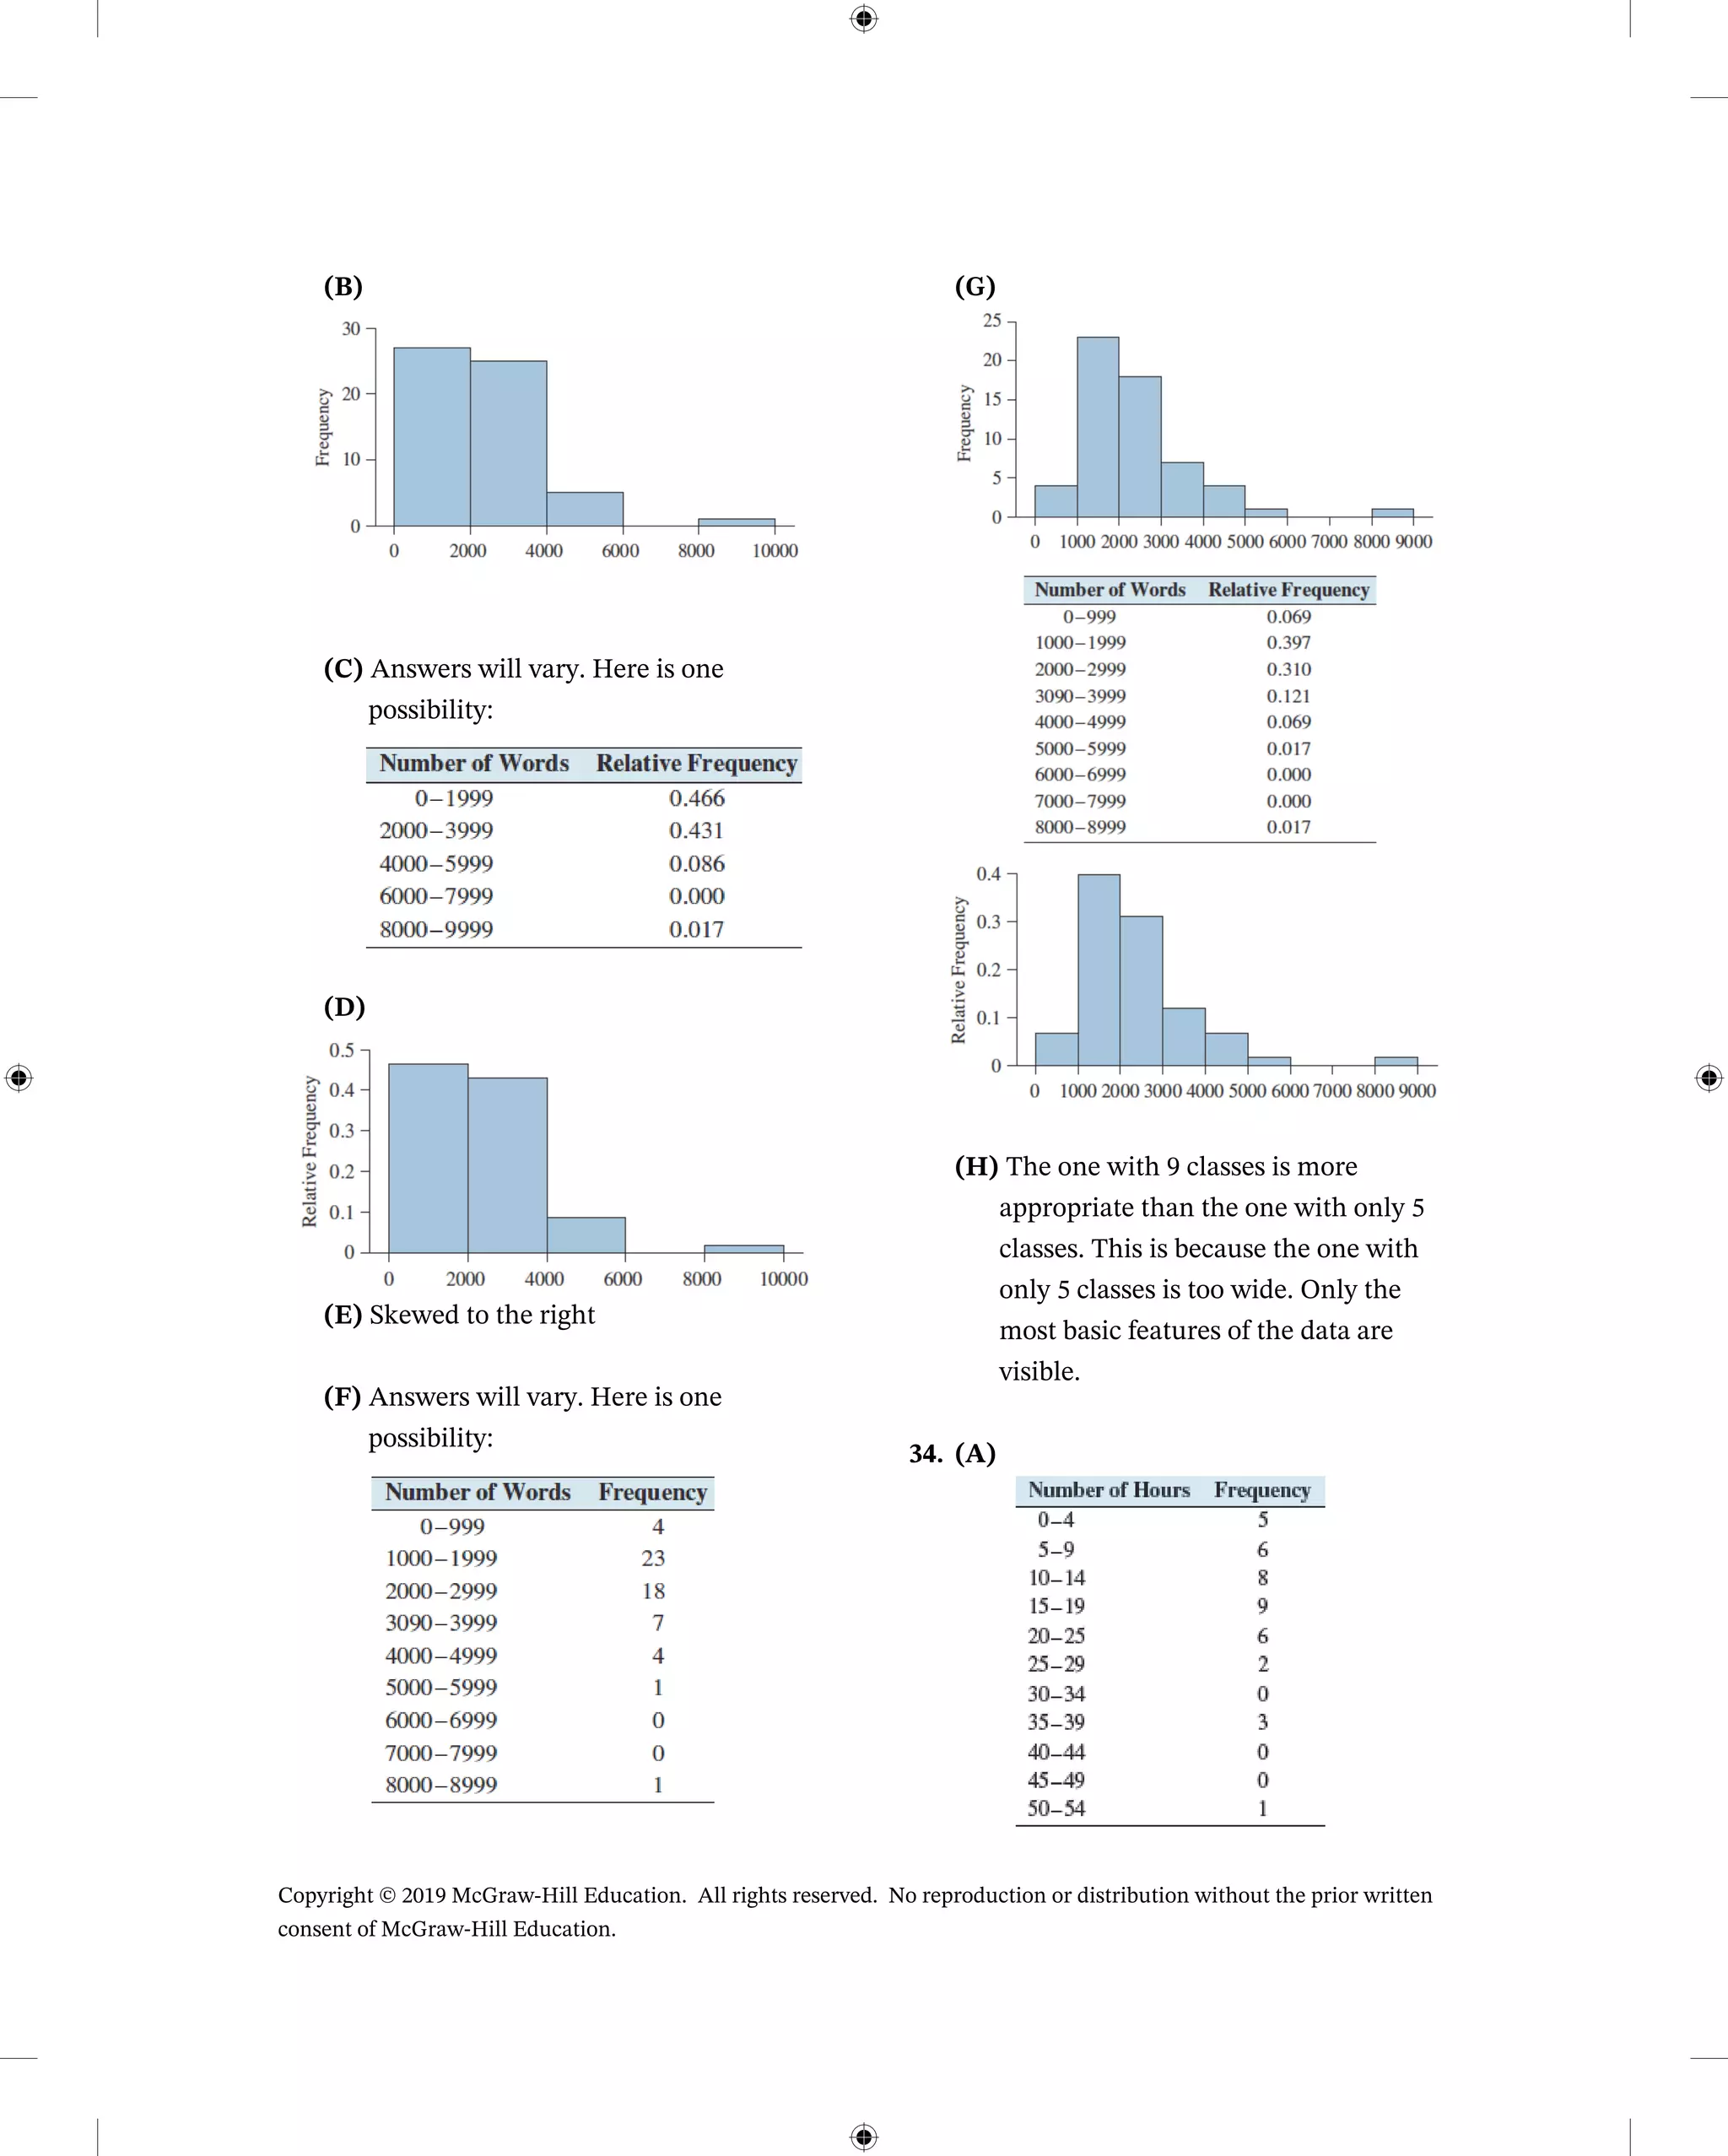
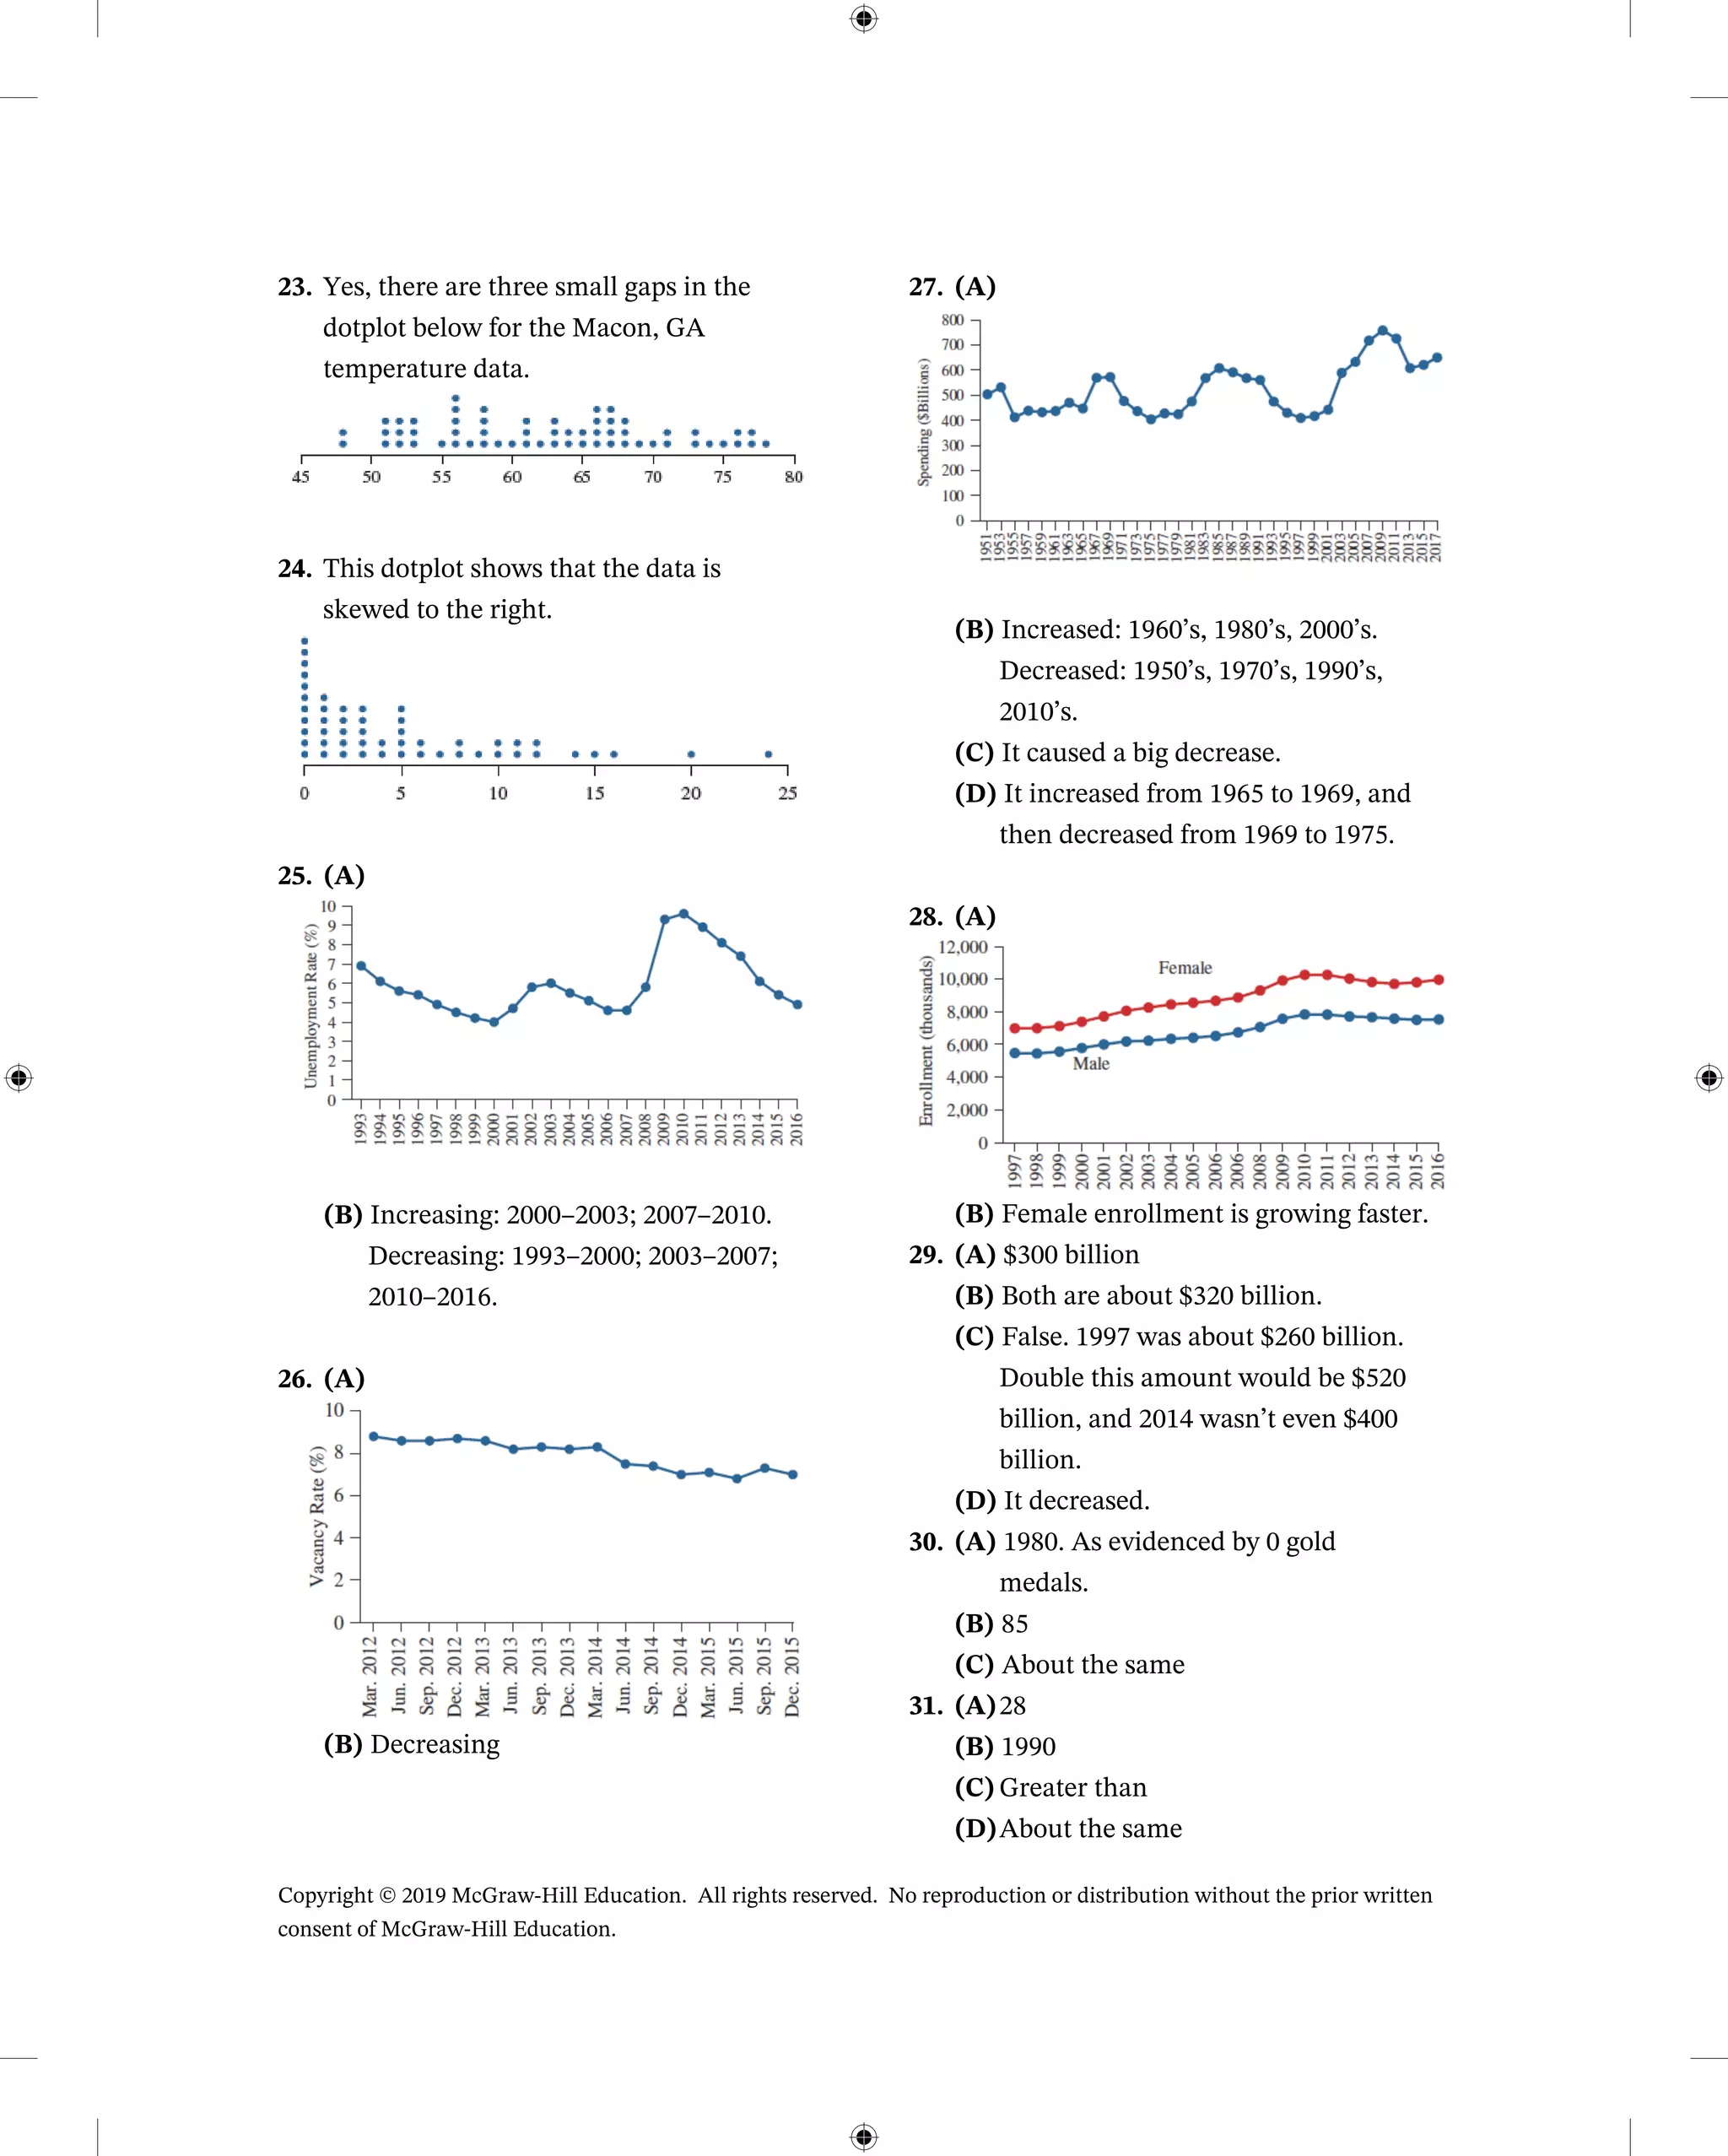
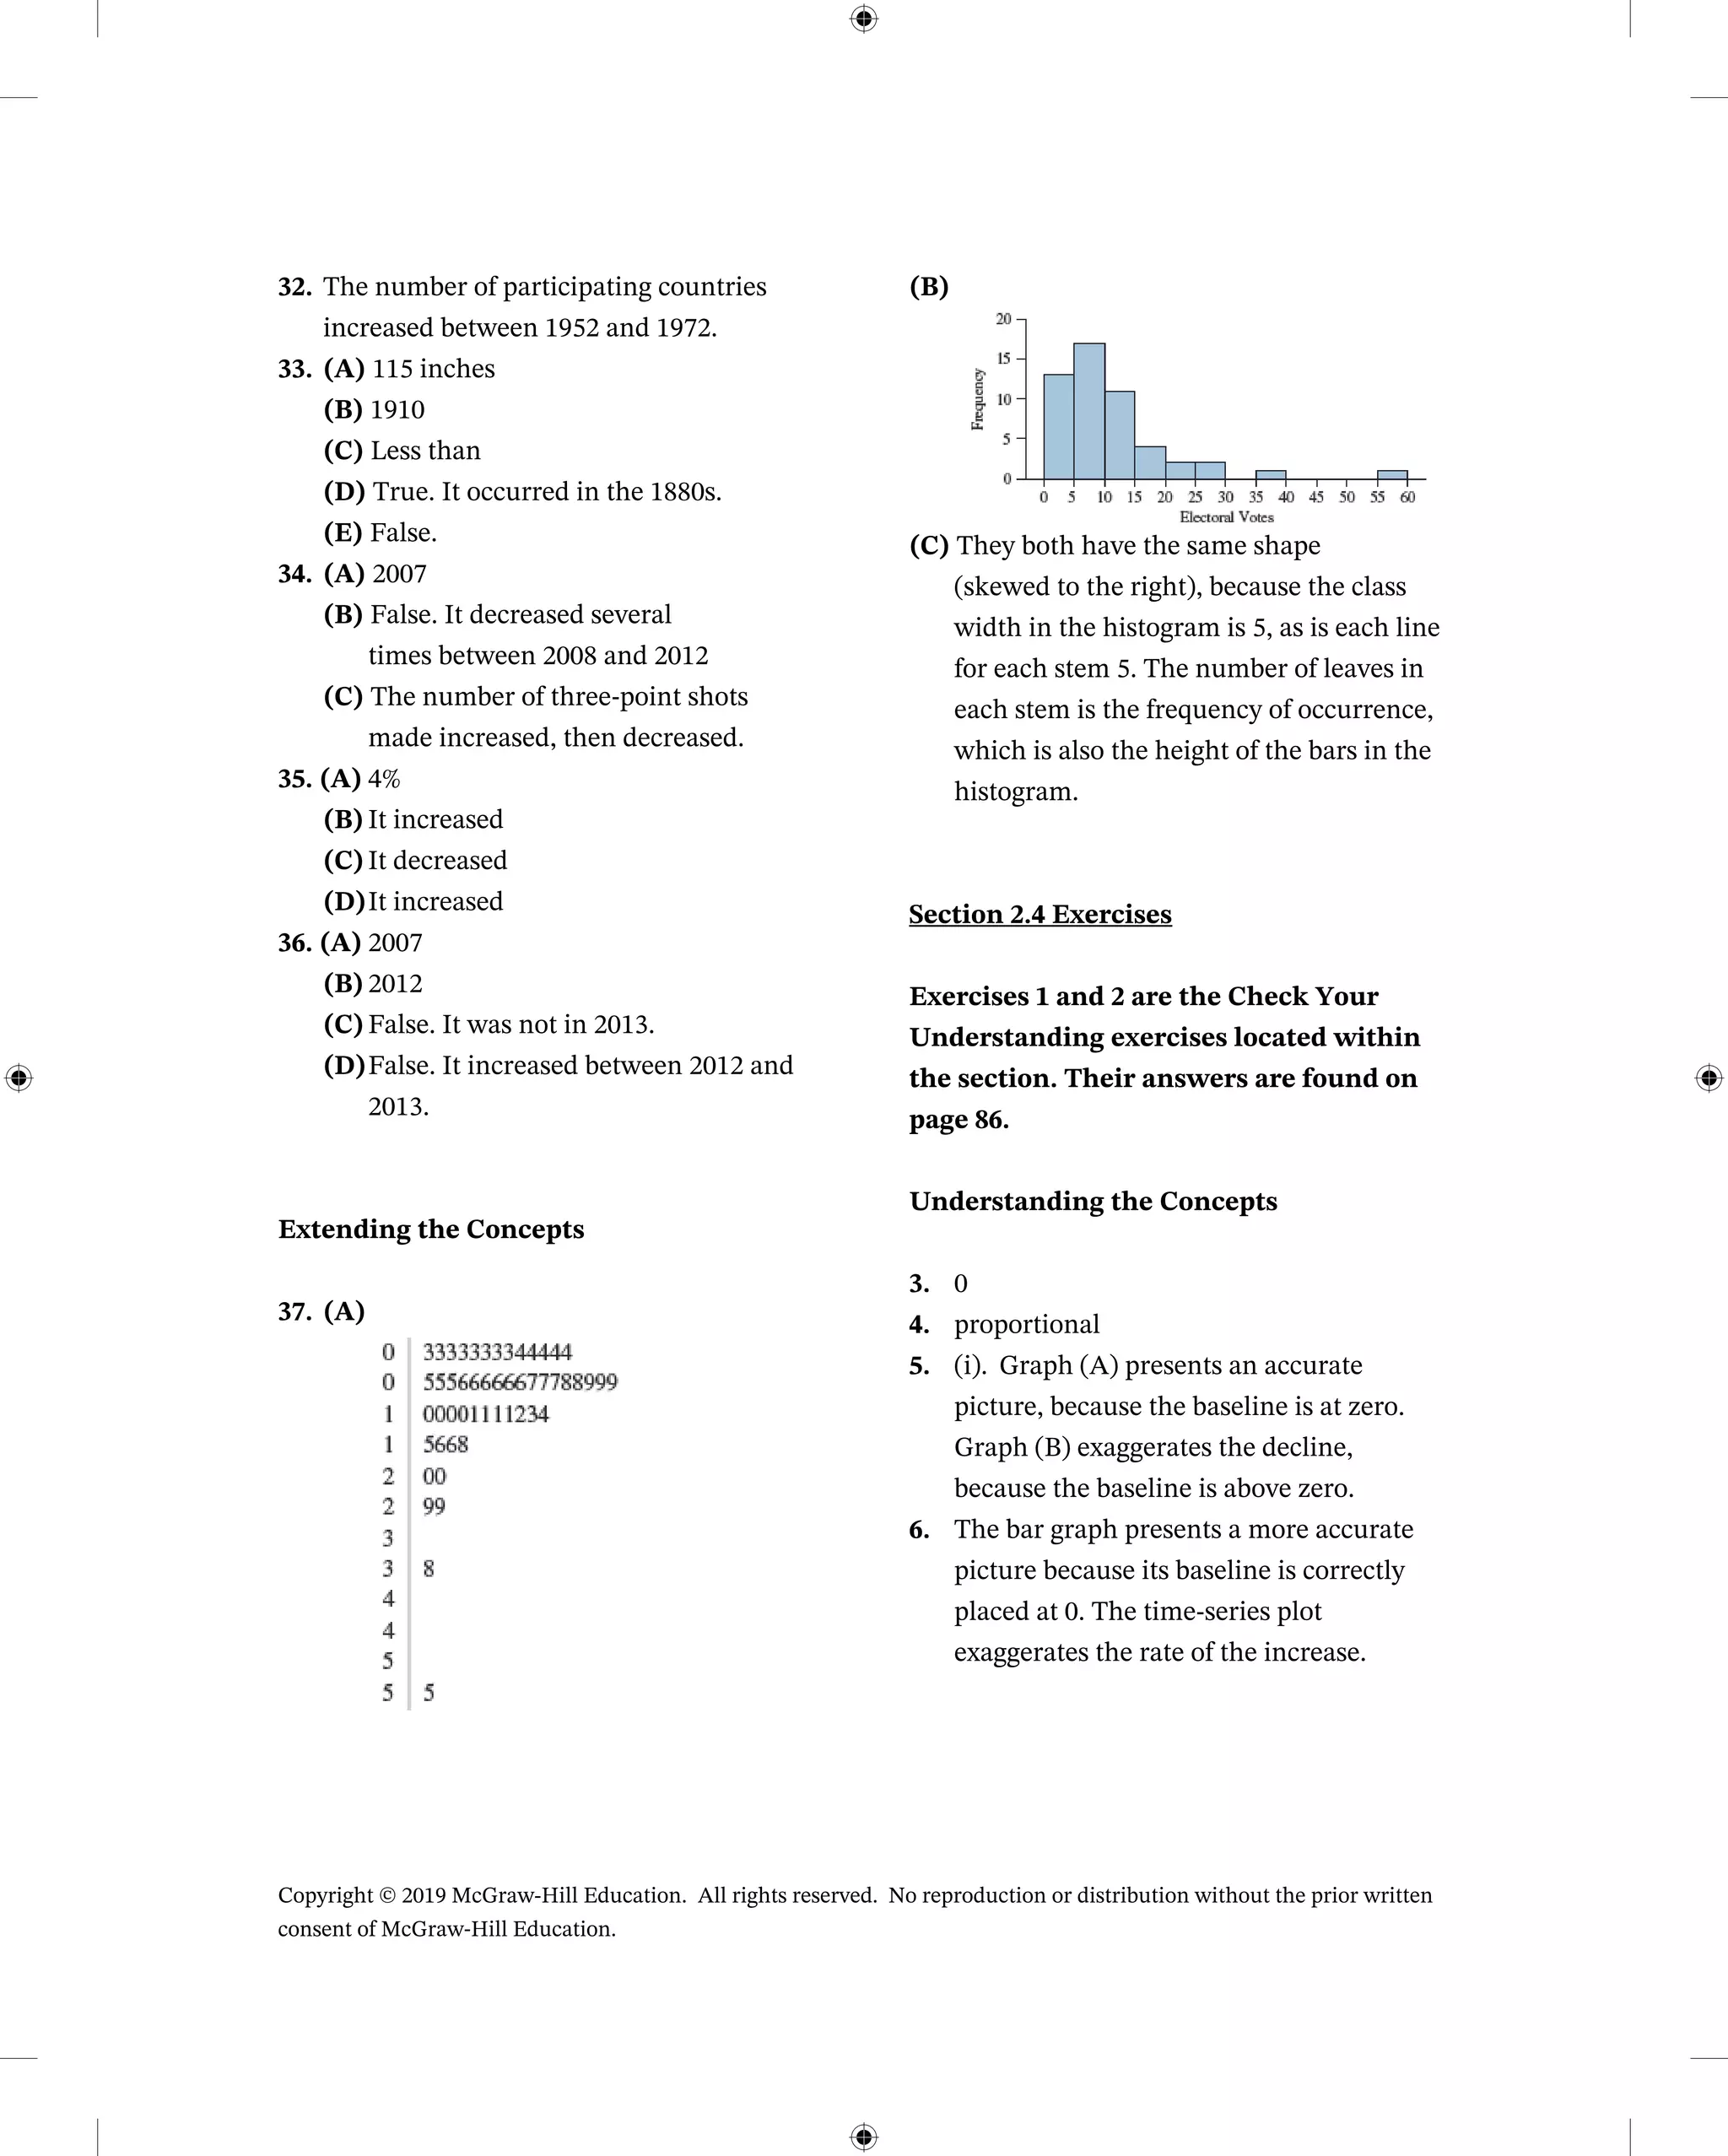
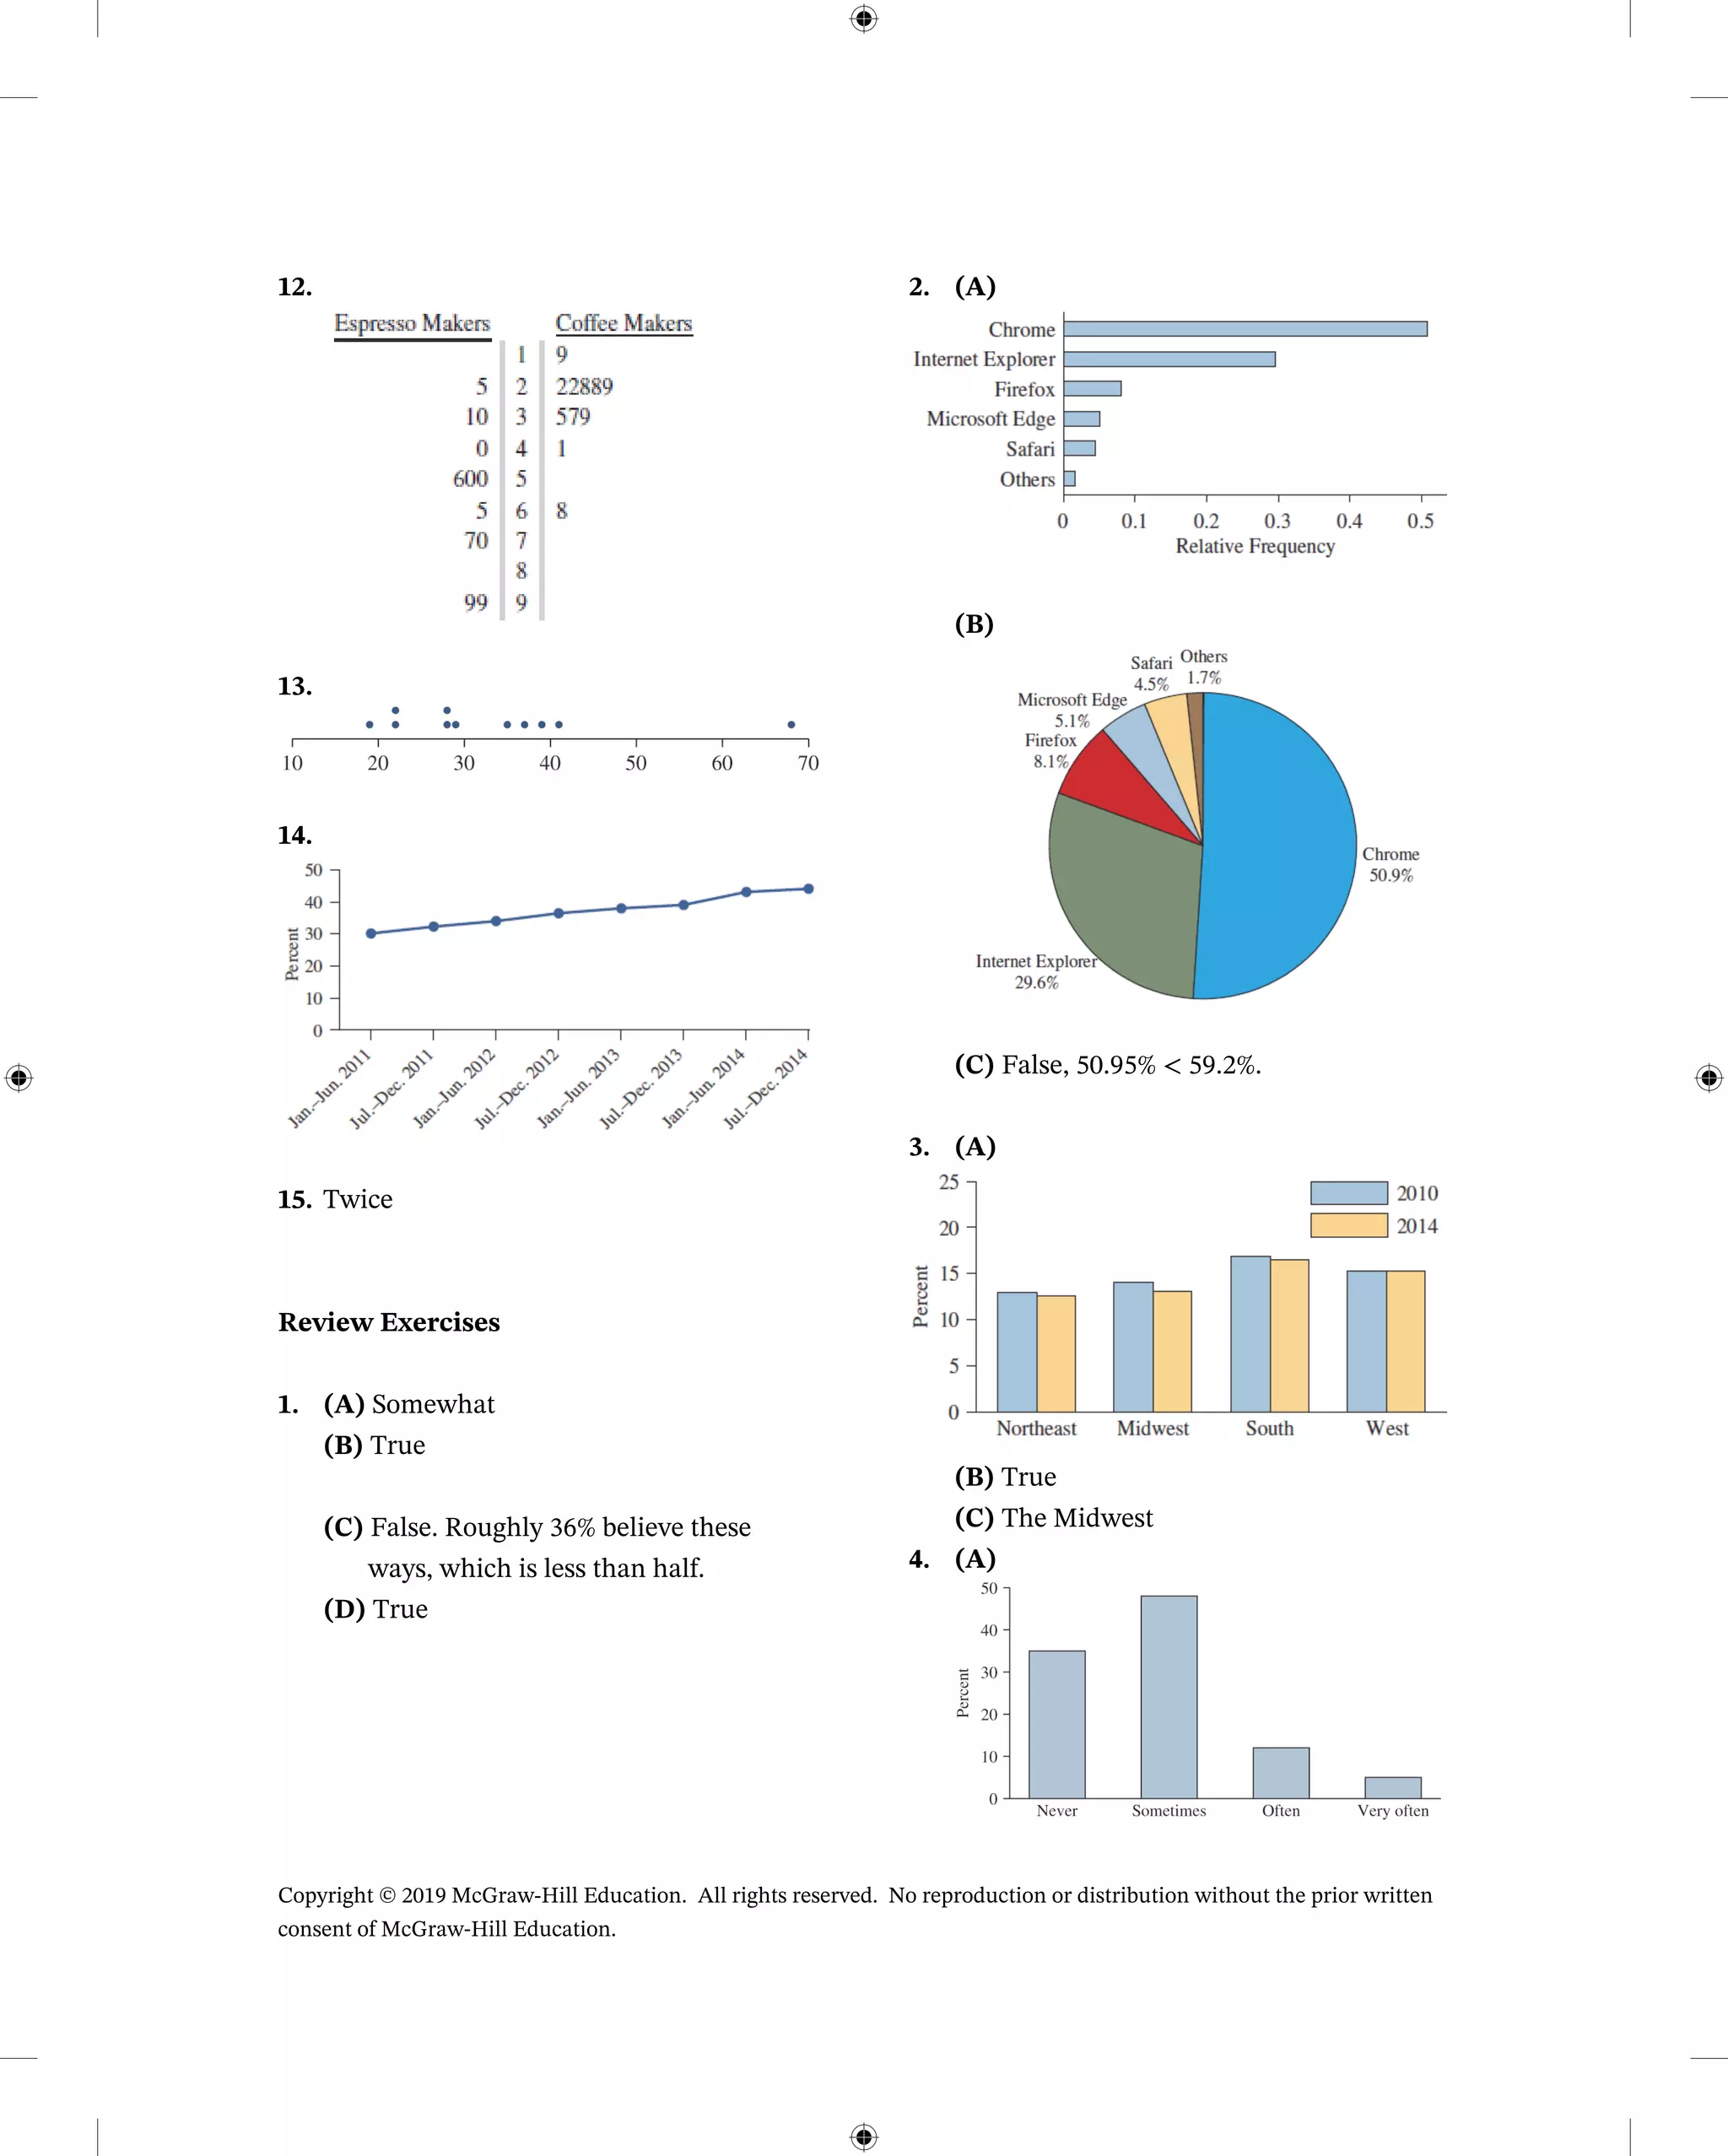
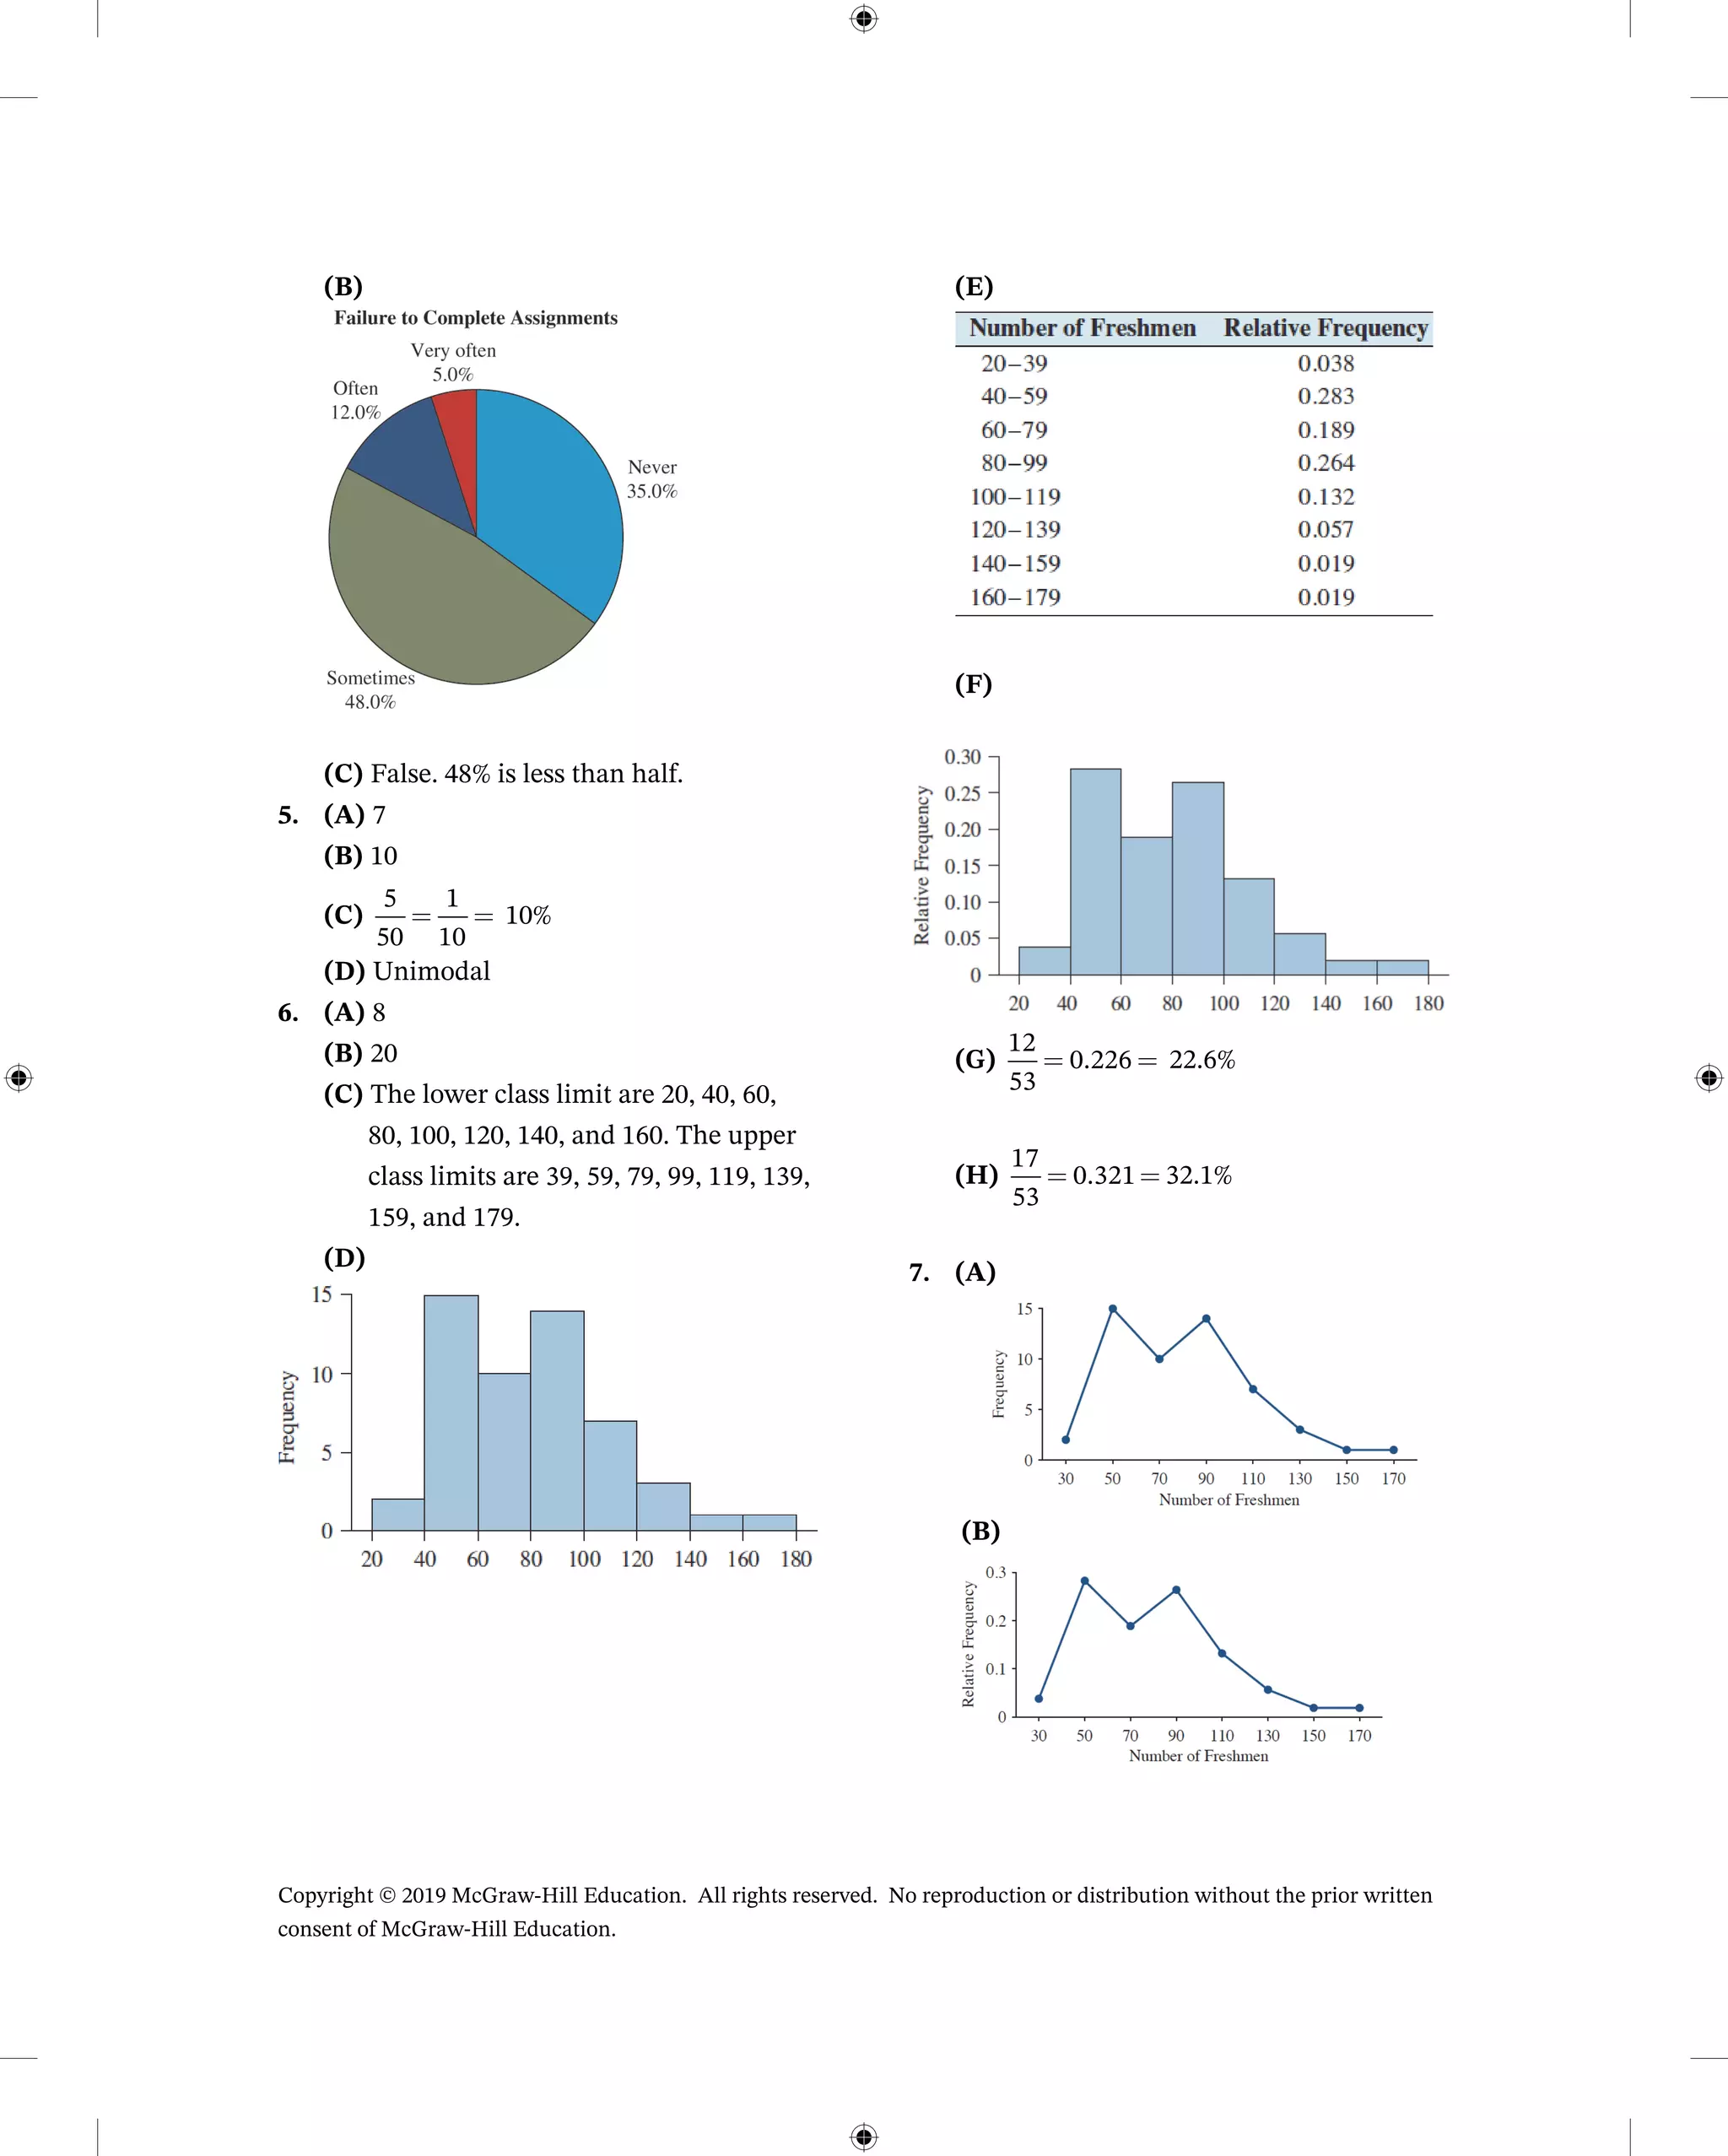
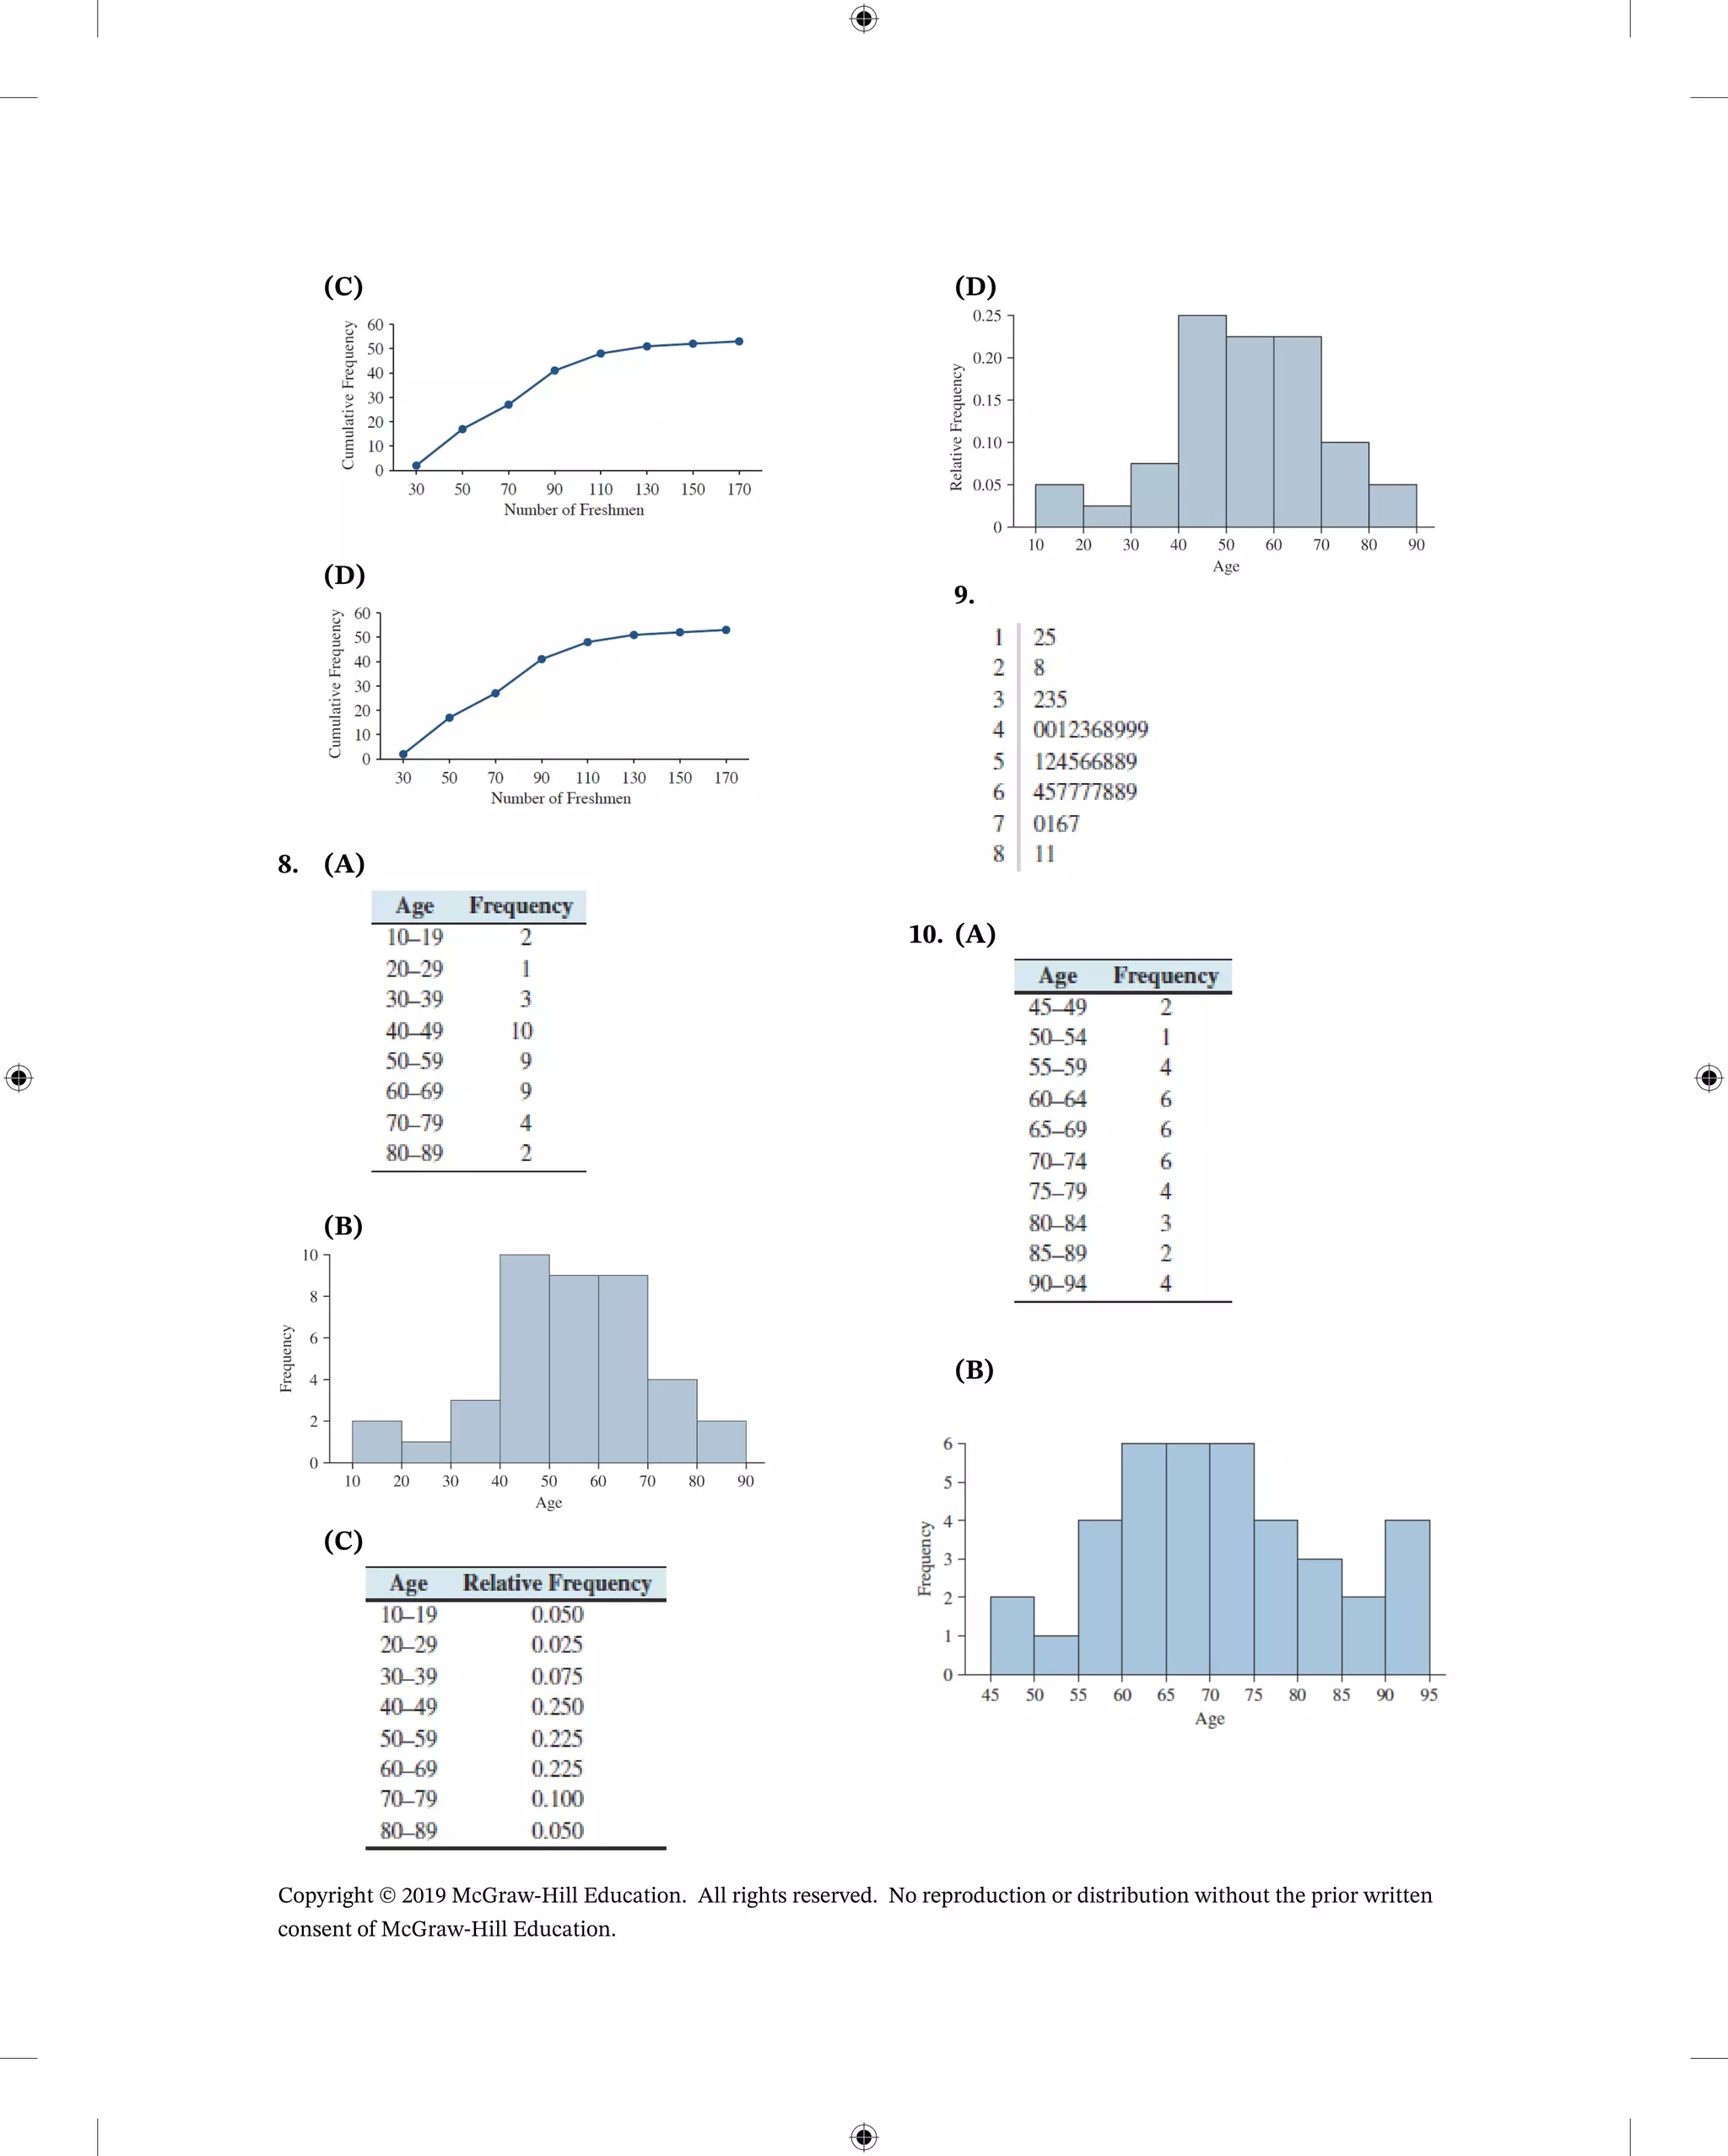
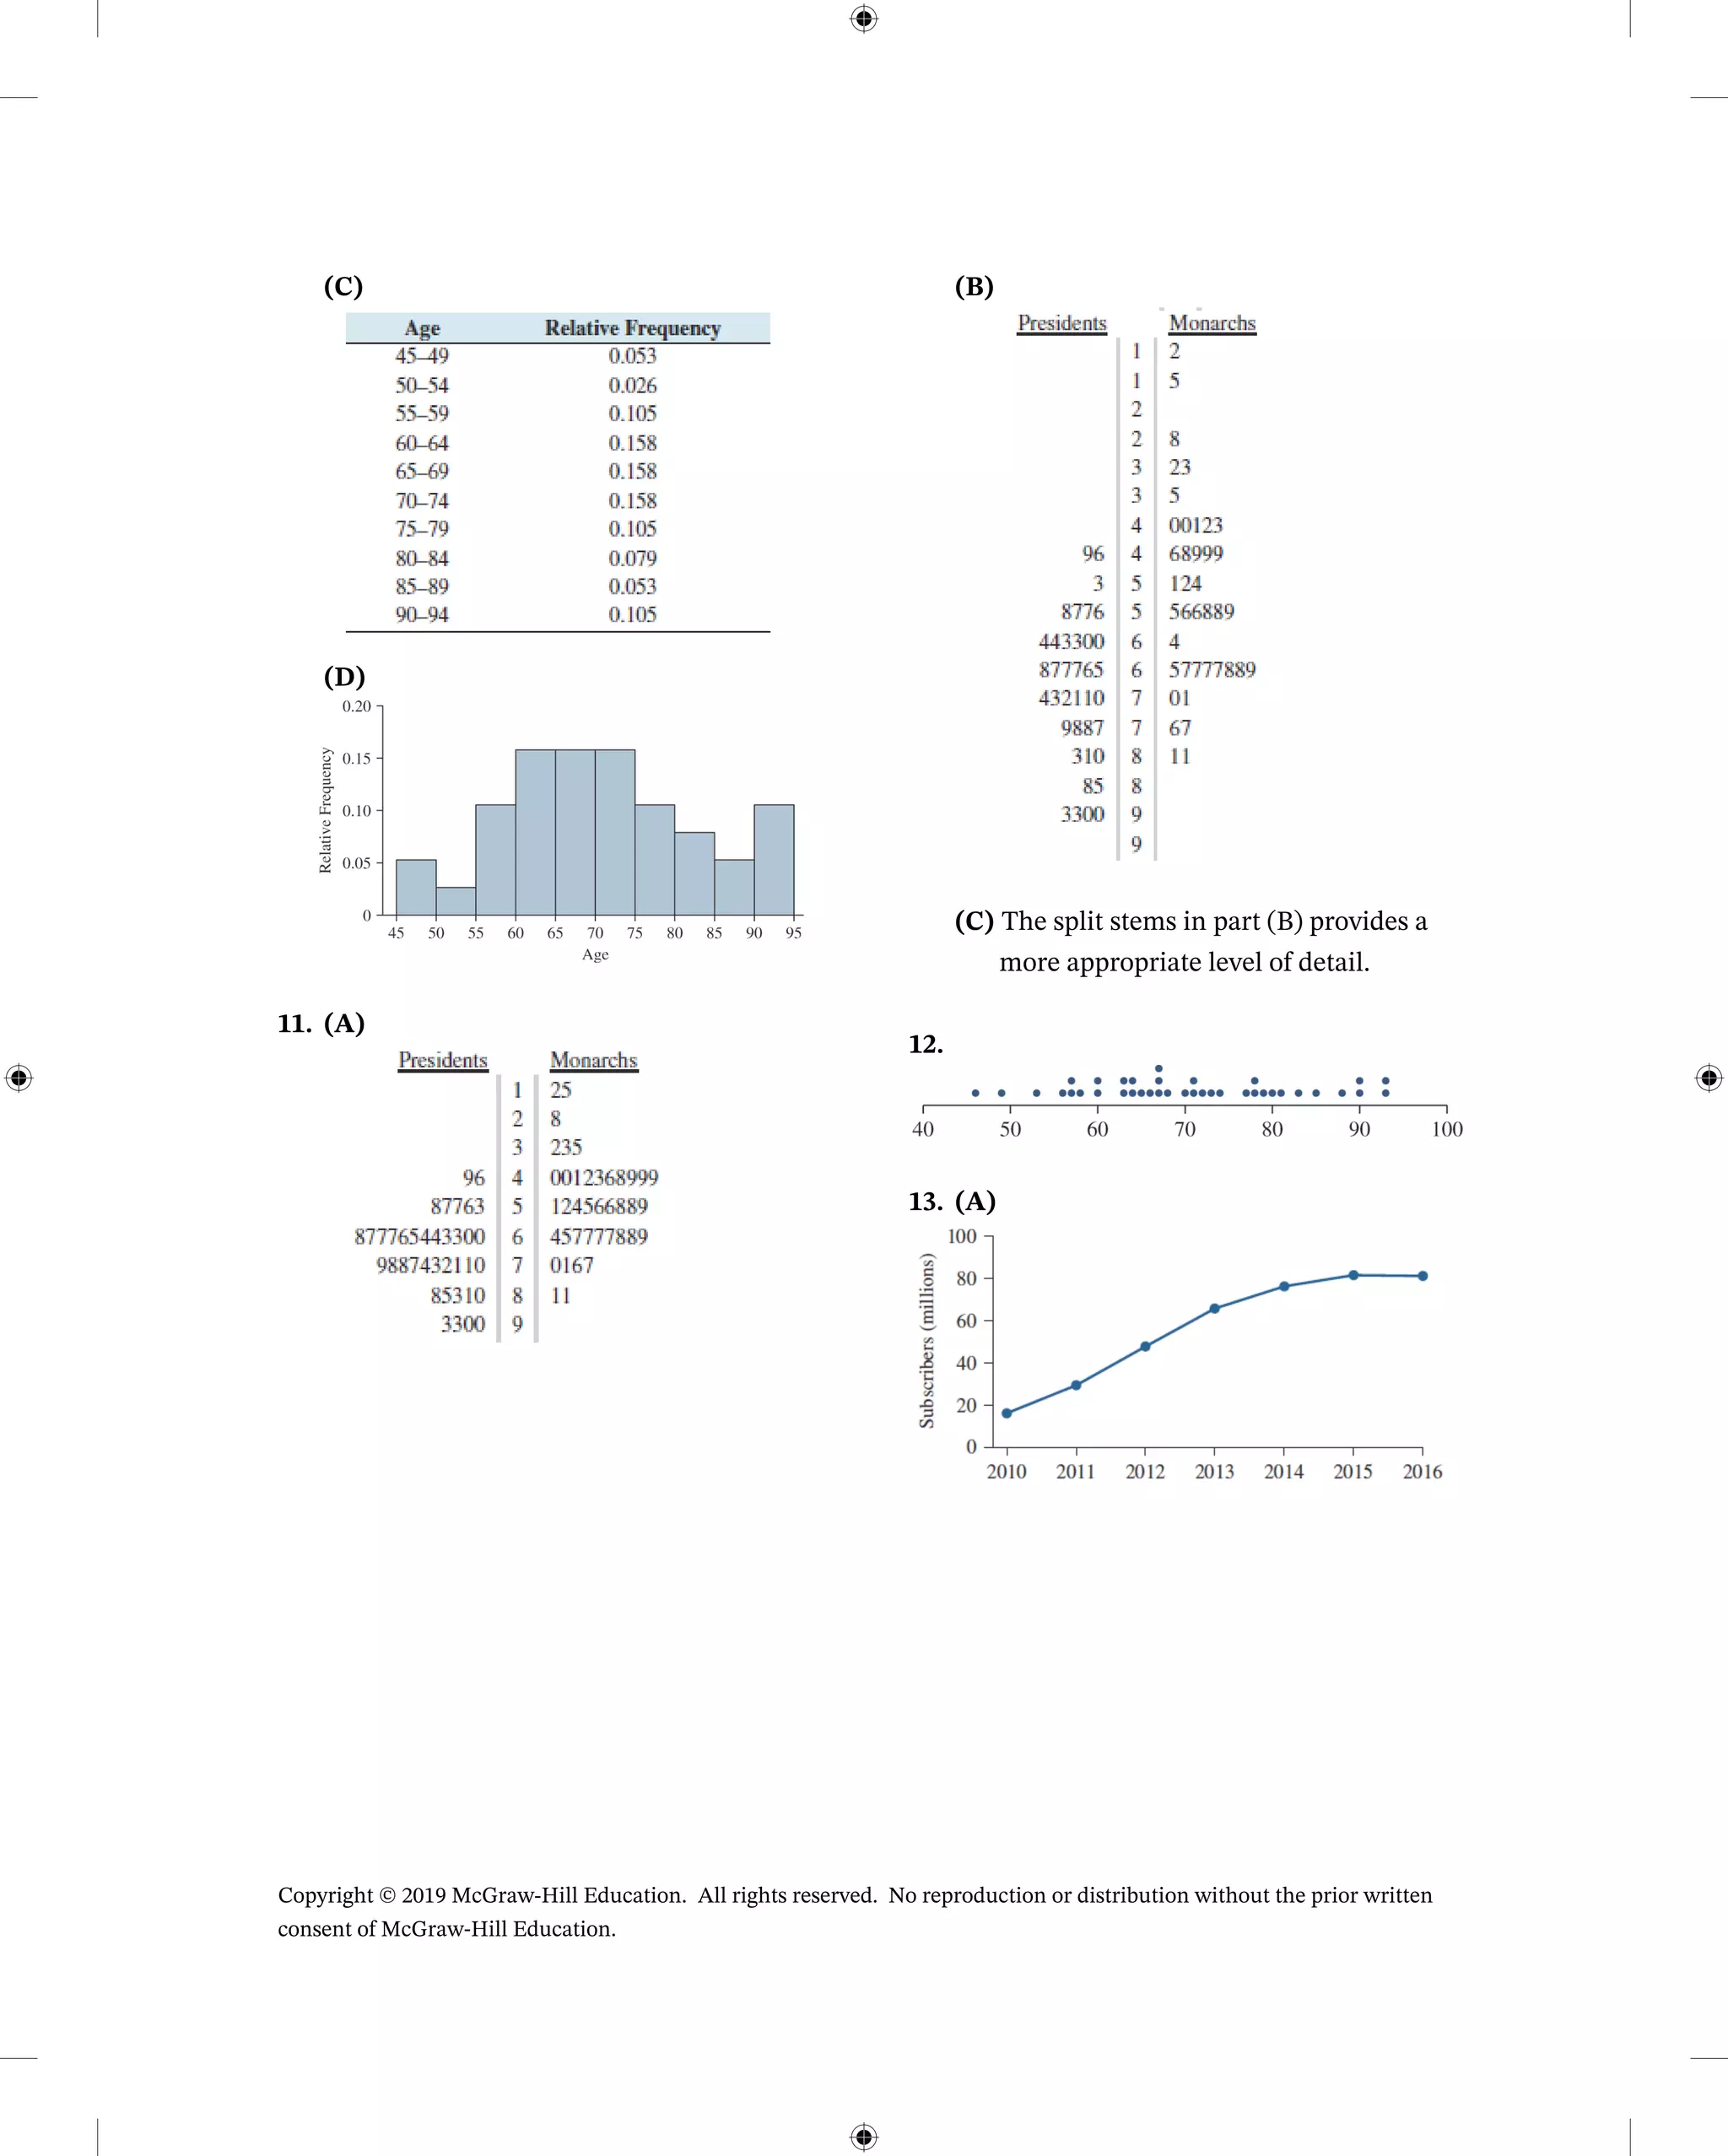
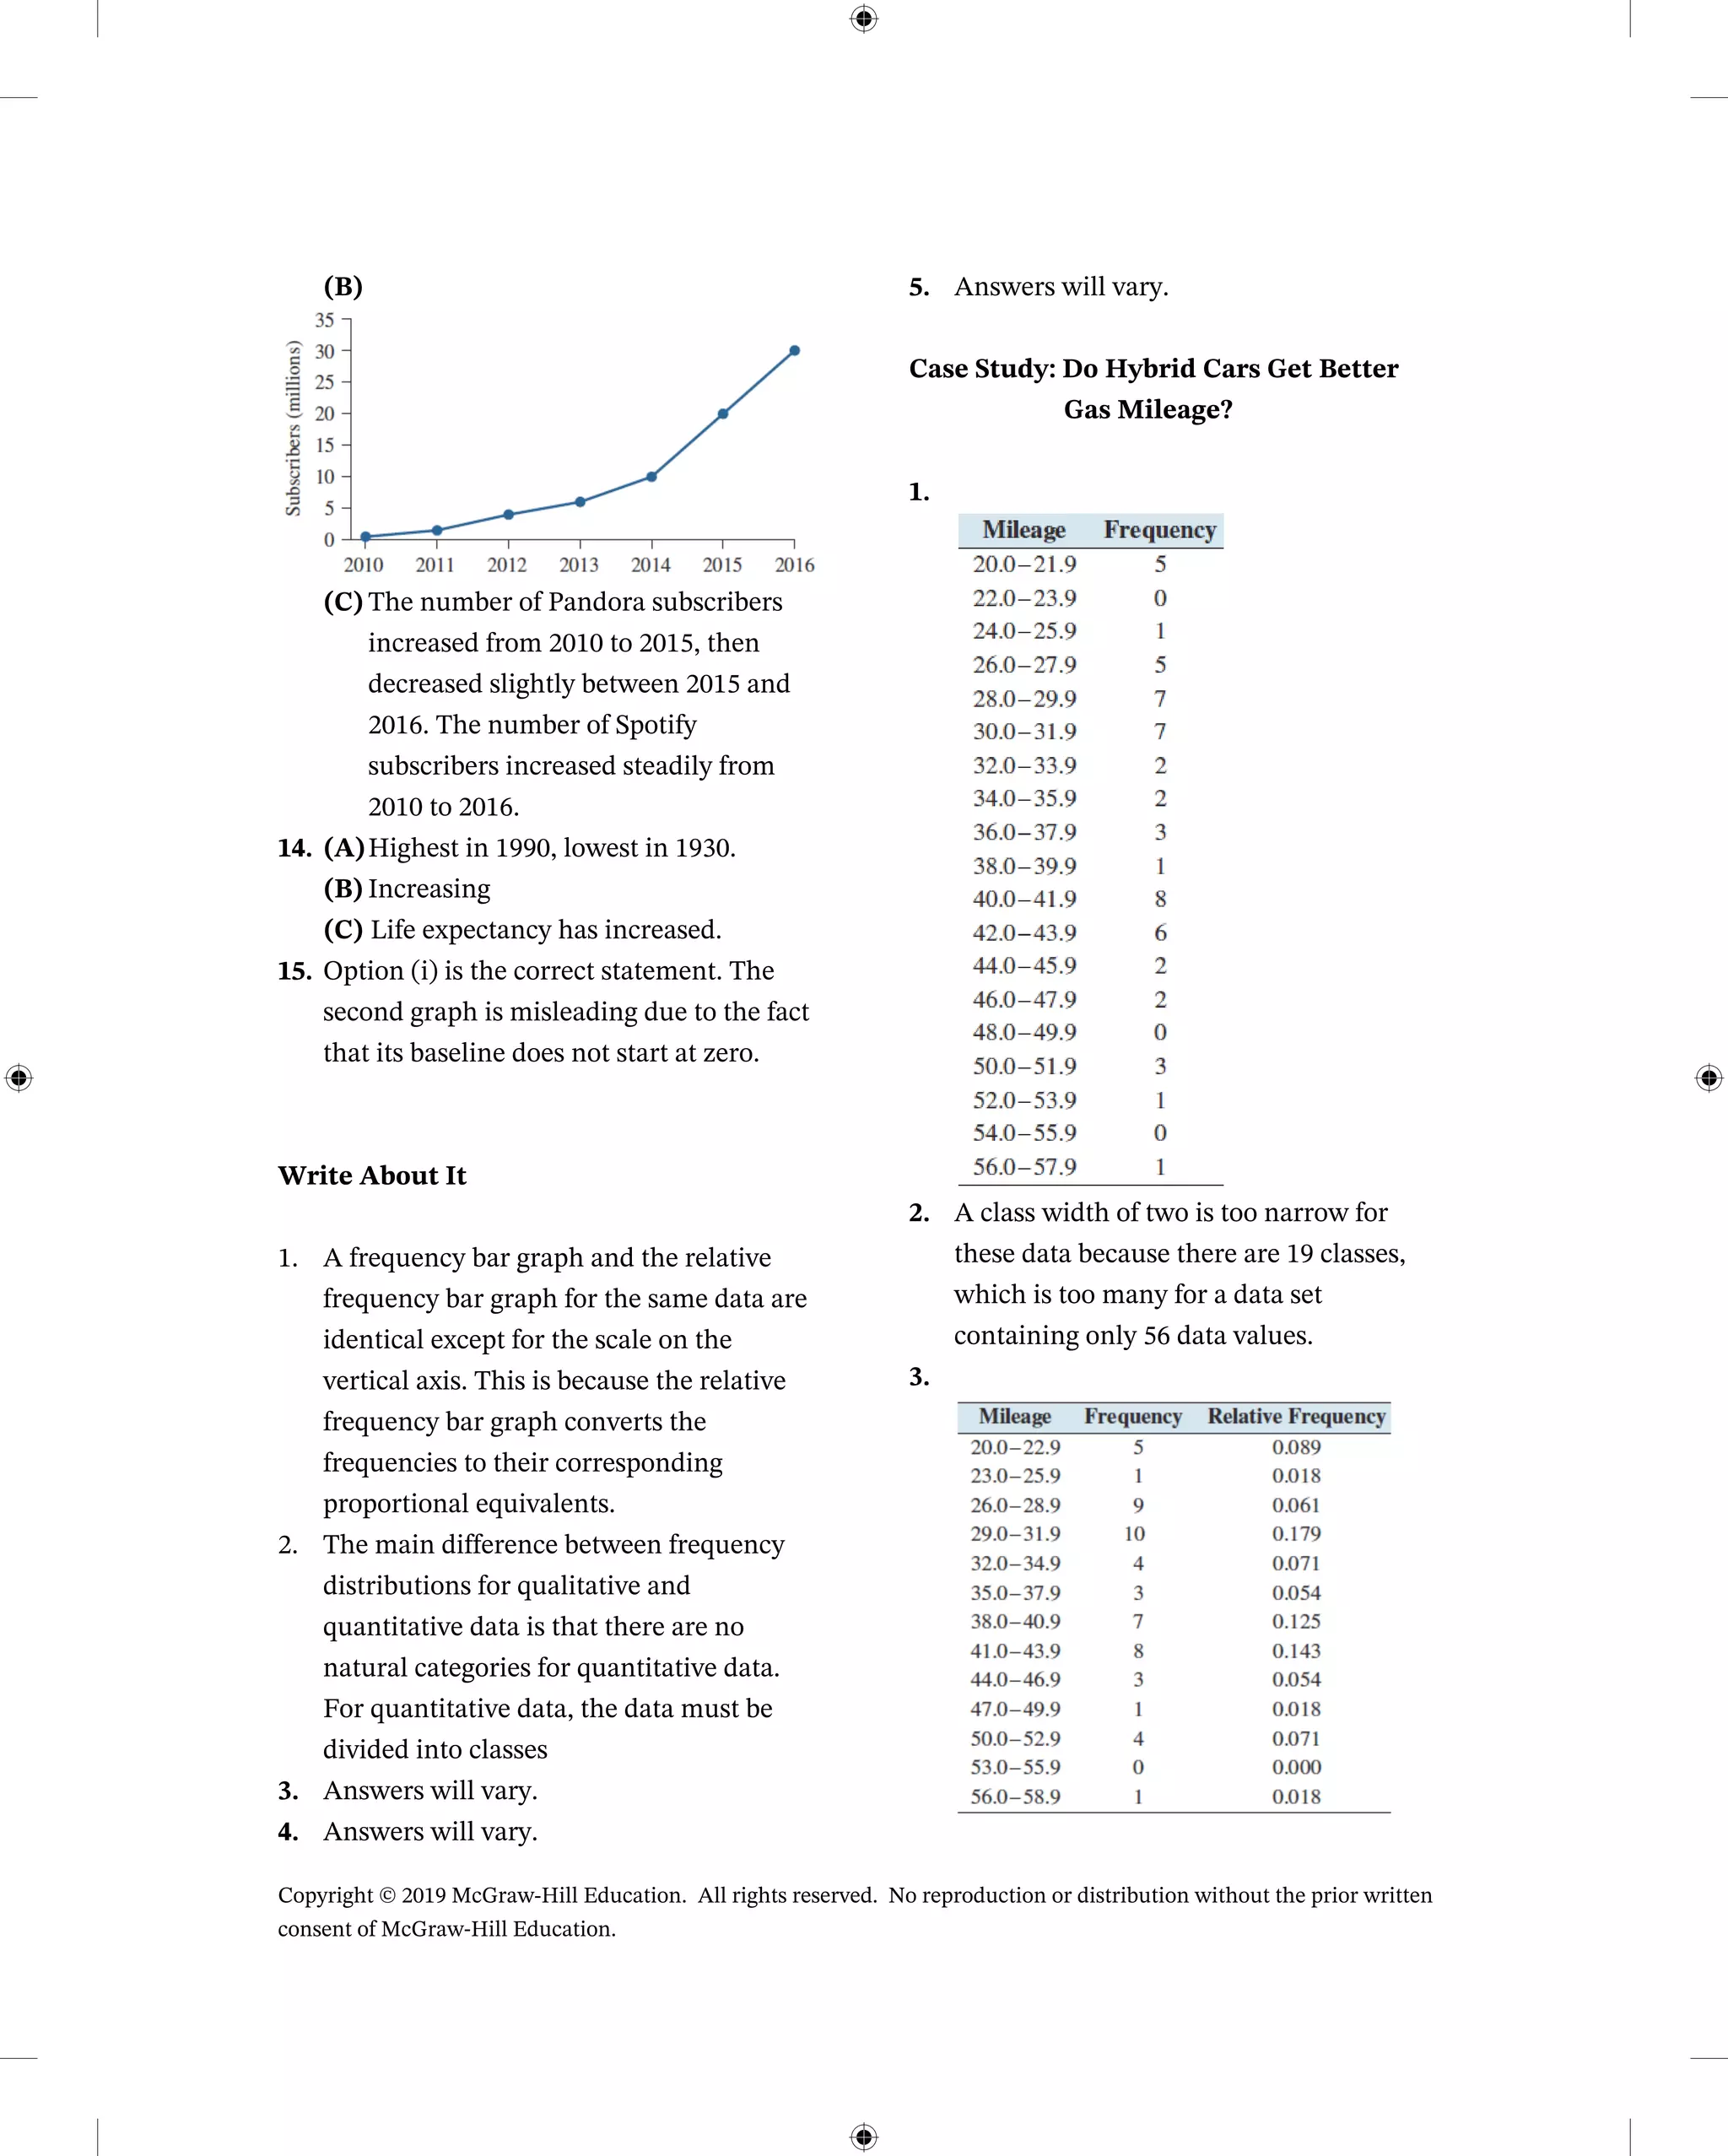
This document contains exercises and solutions from a statistics textbook chapter on graphical summaries of data. It includes over 30 multi-part exercises testing understanding of concepts like frequency distributions, histograms, and stem-and-leaf plots. The exercises cover constructing and interpreting various graphs, identifying features like shape and outliers, and calculating percentages and proportions from the graphs. The document provides detailed answers and explanations for each question.