
More Related Content
What's hot
What's hot (20)
Similar to Electrophoresis technique
Similar to Electrophoresis technique (20)
Recently uploaded
Recently uploaded (20)
Electrophoresis technique
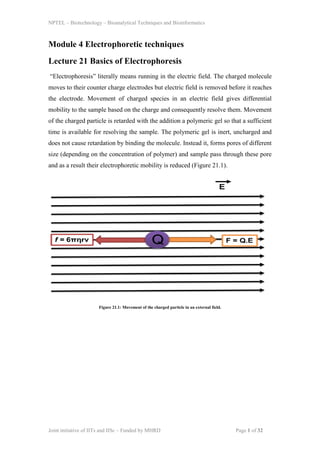
- 1. NPTEL – Biotechnology – Bioanalytical Techniques and Bioinformatics Joint initiative of IITs and IISc – Funded by MHRD Page 1 of 32 Module 4 Electrophoretic techniques Lecture 21 Basics of Electrophoresis “Electrophoresis” literally means running in the electric field. The charged molecule moves to their counter charge electrodes but electric field is removed before it reaches the electrode. Movement of charged species in an electric field gives differential mobility to the sample based on the charge and consequently resolve them. Movement of the charged particle is retarded with the addition a polymeric gel so that a sufficient time is available for resolving the sample. The polymeric gel is inert, uncharged and does not cause retardation by binding the molecule. Instead it, forms pores of different size (depending on the concentration of polymer) and sample pass through these pore and as a result their electrophoretic mobility is reduced (Figure 21.1). Figure 21.1: Movement of the charged particle in an external field.
- 2. NPTEL – Biotechnology – Bioanalytical Techniques and Bioinformatics Joint initiative of IITs and IISc – Funded by MHRD Page 2 of 32 Suppose a charged particle has net charge Q and the external electric field is E, then the force F responsible for giving electrophoretic mobility, F= Q.E…………………………………………….Eq (21.1) The friction forces F which is opposing the movement of the charged particle is as follows F= ƒ. v……………………………………………Eq (21.2), here ƒ is the friction coefficient and the v is the velocity of the electrophoretic mobility. The movement of a spherical through a liquid medium (gel) of the viscosity η, the friction coefficient ƒ is given by : ƒ = 6Πηrv……………………………………………Eq (21.3) The place where, F=F or QE=6Πηrv The electrophoretic mobility v is given by: 𝒗 = 𝐐 𝟔𝚷𝛈𝐫 As Q=ze, where z is the valency and e is the electronic charge, the electrophoretic mobility can be expressed as: 𝒗 = 𝐳𝐞 𝟔𝚷𝛈𝐫 Hence, electrophoretic mobility v is directly proportional to the charge and inversely proportional to the viscosity of the medium, size and shape of the molecule. In the case of relative mobility, it is directly related to the charge/radius of the molecule. For a globular protein, the radius (r) of the molecule is related to the molecular mass of the macromolecule. The relative mobility, v’ is as follows 𝒗′ = 𝐂𝐡𝐚𝐫𝐠𝐞 𝐦𝐚𝐬𝐬 ………………………………………Eq (21.4) Electrophoretic techniques: Different types of electrophoresis techniques are designed depending upon whether it carried out in the presence or absence of a supporting media.
- 3. NPTEL – Biotechnology – Bioanalytical Techniques and Bioinformatics Joint initiative of IITs and IISc – Funded by MHRD Page 3 of 32 Moving boundary electrophoresis-In this method, the electrophoresis is carried in solution, without a supporting media. The sample is dissolved the buffer and molecules move to their respective counter charge electrodes. Moving boundary electrophoresis is carried out in a U shape tube with platinum electrodes attached to the end of both arms (Figure 21.2). At the respective ends, tube has refractometer to measure the change in refractive index of the buffer during electrophoresis due to presence of molecule. Sample is loaded in the middle of the U tube and then the apparatus is connected to the external power supply. Charged molecule moves to the opposite electrode as they passes through the refractometer, a change can be measured. As the desirable molecule passes, sample can be taken out from the apparatus along with the buffer. Figure 21.2: Movement of the charged particle in a moving boundary electrophoresis.
- 4. NPTEL – Biotechnology – Bioanalytical Techniques and Bioinformatics Joint initiative of IITs and IISc – Funded by MHRD Page 4 of 32 Disadvantages of Moving Boundary electrophoresis-The resolution of the technique is very low due to the mixing of the sample as well as over-lapping of the sample components. The electrophoresis technique is not good to separate and analyze the complex biological sample instead it can be used to study the behavior of the molecule in an electric field. Zone electrophoresis-In this method, an inert polymeric supporting media is used between the electrodes to separate and analyze the sample. The supporting media used in zone electrophoresis are absorbent paper, gel of starch, agar and polyacrylamide. The presence of supporting media minimizes mixing of the sample and that makes the analysis and purification of the molecule from the gel much easier than the moving boundary electrophoresis. The gel electrophoresis is the best example of zone electrophoresis. Gel electrophoresis: Vertical Gel Electrophoresis: The electrophoresis in this system performed in a discontinuous way with buffer in the upper and lower tank connected by the gel slab. It has multiple modification in the running condition to answer multiple analytical questions. Horizontal Gel Electrophoresis: The electrophoresis in this susyem is performed in a continous way and the electrophoresis is performed in the horizontal direction.
- 5. NPTEL – Biotechnology – Bioanalytical Techniques and Bioinformatics Joint initiative of IITs and IISc – Funded by MHRD Page 5 of 32 Lecture 22 Vertical Electrophoresis (Part-I) Vertical Gel Electrophoresis: The electrophoresis in this system performed in a discontinuous way with buffer in the upper and lower tank connected by the gel slab. It has multiple modification in the running condition to answer several analytical questions. Vertical Gel Electrophoresis: The electrophoresis in this system performed in a discontinuous way with buffer in the upper and lower tank connected by the gel slab. It has multiple modification in the running condition to answer multiple analytical questions. 1. SDS-Polyacrylamide gel electrophoresis (SDS-PAGE) Instrument- The schematic diagram of a vertical gel electrophoresis apparatus is given in Figure 22.1. It has two buffer chamber, upper chamber and a lower chamber. Both chamber are fitted with the platinum electrodes connected to the external power supply from a power pack which supplies a direct current or DC voltage. The upper and lower tank filled with the running buffer is connected by the electrophoresis gel casted in between two glass plates (rectangular and notched). There are additional accessories needed for casting the polyacrylamide gel such as comb (to prepare different well), spacer, gel caster etc. Figure 22.1: Different components of vertical gel electrophoresis apparatus.
- 6. NPTEL – Biotechnology – Bioanalytical Techniques and Bioinformatics Joint initiative of IITs and IISc – Funded by MHRD Page 6 of 32 Buffer and reagent for electrophoresis- The different buffer and reagents with their purpose for vertical gel electrophoresis is as follows- 1. N, N, N', N'-tetramethylethylenediamine (TEMED)-it catalyzes the acrylamide polymerization. 2. Ammonium persulfate (APS)-it is an initiator for the acrylamide polymerization. 3. Tris-HCl- it is the component of running and gel casting buffer. 4. Glycine- it is the component of running buffer. 5. Bromophenol blue- it is the tracking dye to monitor the progress of gel electrophoresis. 6. Coomassie brilliant blue R250-it is used to stain the polyacrylamide gel. 7. Sodium dodecyl sulphate-it is used to denature and provde negative charge to the protein. 8. Acrylamide- monomeric unit used to prepare the gel. 9. Bis-acrylamide- cross linker for polymerization of acrylamide monomer to form gel. Casting of the gel: The acrylamide solution (a mixture of monomeric acrylamide and a bifunctional crosslinker bisacrylamide ) is mixed with the TEMED and APS and poured in between the glass plate fitted into the gel caster. Ammoinum persupfate in the presence of TEMED forms oxygen free radicals and induces the polymerization of acryalide monomer to form a linear polymer (Figure 22.2). These linear monomers are interconnected by the cross linking with bis-acrylamide monomer to form a 3-D mesh with pores. The size of pore is controlled by the concentration of acrylamide and amount of bis-acrylamide in the gel. IN a vertical gel electrophoresis system, we cast two types of gels, stacking gel and resolving gel. First the resolving gel solution is prepared and poured into the gel cassette for polymerization. A thin layer of organisc solvent (such as butanol or isoproponal) is layered to stop the entry of oxygen (oxygen neutralizes the free radical and slow down the polymerization) and make the top layer smooth. After polymerization of the resolving gel, a stacking gel is
- 7. NPTEL – Biotechnology – Bioanalytical Techniques and Bioinformatics Joint initiative of IITs and IISc – Funded by MHRD Page 7 of 32 poured and comb is fitted into the gel for construction of different lanes for the samples (Figure 22.3). Figure 22.2: Mechanism of acylamide polymerization.
- 8. NPTEL – Biotechnology – Bioanalytical Techniques and Bioinformatics Joint initiative of IITs and IISc – Funded by MHRD Page 8 of 32 Figure 22.3: Different steps in performace of vertical gel electrophoresis to resolve sample. Running of the gel: The sample is prepared in the loading dye containing SDS, β- mercaptoethanol in glycerol to denature the sample and presence of glycerol facilitates the loading of sample in the well. As the samples are filled vertically there is a distance drift between the molecules at the top Vs at the bottom in a lane. This problem is taken care once the sample run through the stacking gel. The pH of the stacking gel is 6.8 and at this pH, glycine is moving slowly in the front where as Tris- HCl is moving fast. As a result, the sample gets sandwiched between glycine-Tris and get stacked in the form of thin band. As the sample enters into the resolving gel with a pH 8.8, the glycine is now charged, it moves fast and now sample runs as per their molecular weight (due to SDS they have equal negative charge). After tracking dye reaches to the bottom of the gel, gel is taken out from the glass plate with the help of a spatula and it is stained with coomassie brilliant blue R250 dye. The dye stains protein present on the gel. A typical SDS-PAGE is given in the Figure 22.4.
- 9. NPTEL – Biotechnology – Bioanalytical Techniques and Bioinformatics Joint initiative of IITs and IISc – Funded by MHRD Page 9 of 32 In SDS-PAGE, the relative mobility and the log molecular weight as given by 𝒗′ = 𝐕𝐨 𝐀−𝐥𝐨𝐠 𝐌 𝐀 ………………………………………Eq (22.1) Molecular weight of a protein can be determined by plotting relative migration Rf with the log molecular weight of standard protein. 𝑹𝒇 = 𝐦𝐢𝐠𝐫𝐚𝐭𝐢𝐨𝐧 𝐨𝐟 𝐩𝐫𝐨𝐭𝐞𝐢𝐧 𝐟𝐫𝐨𝐦 𝐭𝐡𝐞 𝐥𝐚𝐧𝐞 𝐦𝐢𝐠𝐫𝐚𝐭𝐢𝐨𝐧 𝐨𝐟 𝐭𝐫𝐚𝐜𝐤𝐢𝐧𝐠 𝐝𝐲𝐞 …………Eq (22.2) Figure 22.4: SDS-PAGE Profile of a typical bacterial lysate.
- 10. NPTEL – Biotechnology – Bioanalytical Techniques and Bioinformatics Joint initiative of IITs and IISc – Funded by MHRD Page 10 of 32 2. Native PAGE: SDS-PAGE discussed in the previous lecture is using anionic detergent sodium dodecyl sulfate and β-mercaptoethanol to give equal charge to all protein and breaks the disulphide linkage. As a result, the 3-D structure of the protein is destroyed and it migrate as per their subunit molecular weight. In the native PAGE, sample is prepared in the loading dye does not contains detergent or denaturating agent and as a result sample runs on the basis of charge/mass. In native PAGE, the 3- D conformation as well as activity of the protein remains unaffected. 3. Urea PAGE: In this method, insoluable protein is dissolved in Urea and samples separate based on their charge/subunit mass. A gradient Ura PAGE is used to monitor the folding states of a protein.
- 11. NPTEL – Biotechnology – Bioanalytical Techniques and Bioinformatics Joint initiative of IITs and IISc – Funded by MHRD Page 11 of 32 Lecture 23 Vertical Electrophoresis (Part-II) Applications of Vertical Electrophoresis Determination of Molecular Weight- Molecular weight of a protein can be determined by plotting relative migration Rf with the log molecular weight of standard protein. 𝑹𝒇 = 𝐦𝐢𝐠𝐫𝐚𝐭𝐢𝐨𝐧 𝐨𝐟 𝐩𝐫𝐨𝐭𝐞𝐢𝐧 𝐟𝐫𝐨𝐦 𝐭𝐡𝐞 𝐥𝐚𝐧𝐞 𝐦𝐢𝐠𝐫𝐚𝐭𝐢𝐨𝐧 𝐨𝐟 𝐭𝐫𝐚𝐜𝐤𝐢𝐧𝐠 𝐝𝐲𝐞 …………Eq (23.1) The value of the relative migration (Rf) is calculated from the SDS-PAGE. For each protein band, a line is drawn from the middle of the band and then the distance from the lane is measured. A distance for dye front is also measured. The values of relative migration (Rf) and log molecular weight of the standard protein is used to draw the calibration curve to calculate the molecular weight of the unknown sample (Figure 23.1). Figure 23.1: Determination of molecular weight using SDS-PAGE. (A) SDS-PAGE (B) Determinaion of Rf.
- 12. NPTEL – Biotechnology – Bioanalytical Techniques and Bioinformatics Joint initiative of IITs and IISc – Funded by MHRD Page 12 of 32 Determination of Oligomeric status of the protein-The polyacrylamide gel electrophoresis can be use to determine the oligomeric status of the protein. A protein sample can be run under the denaturating as well as in the native conditions in two separate gel. The protein of the known molecular weight runs on both gels and a Rf value is calculated for the standard proteins as described. A calibration curve from native and denaturating gel is used to determine the molecular weight (native and denaturating) of the protein. The oligomeric status of the protein is calculated from the formula given below: 𝐎𝐥𝐢𝐠𝐨𝐦𝐞𝐫𝐢𝐜 𝐒𝐭𝐚𝐭𝐮𝐬 = 𝐌𝐨𝐥𝐞𝐜𝐮𝐥𝐚𝐫 𝐖𝐞𝐢𝐠𝐡𝐭 ( 𝐍𝐚𝐭𝐢𝐯𝐞) 𝐌𝐨𝐥𝐞𝐜𝐮𝐥𝐚𝐫 𝐖𝐞𝐢𝐠𝐡𝐭 (𝐒𝐃𝐒 − 𝐏𝐀𝐆𝐄) Studying protein folding/unfolding-The urea disrupts electrostatic and hydrophobic interaction between amino acid residues of protein to induce unfolding of the 3-D conformation of the protein. It has been extensively used to study the protein unfolding and to identify different structural intermediates in the folding pathways. In a typical unfolding experiment, protein is exposed to the different concentration of urea and then the structural changes in protein can be monitored by the spectroscopic or gel filitration techniques. Unfolding of protein causes an increase in the hydrodynamic volume of the protein and it results in slower mobility in polyacryalmide gels. In the urea PAGE, a polyacrylamide gel is prepared with a horizontal gradient of urea (0-8M). The same protein sample is loaded in different lanes and it is allowed to run vertically, perpendicular to the urea gradient. As sample runs in different lanes, it gets exposed to different concentration of urea and consequently at a particular urea concentration the protein is unfolded with an increase in hydrodynamic volume. The unfolded protein sample will migrate slower due to increase in friction forces and it gives a unique protein band pattern to provide qualitative or semi-quantitative information about the protein folding intermediates (Figure 23.2). The information from the gradient urea PAGE needs further verification from other analytical techniques. In addition to protein folding, urea PAGE can also be used to analyze the protein complexes as well as covalent heterogenecity of the protein.
- 13. NPTEL – Biotechnology – Bioanalytical Techniques and Bioinformatics Joint initiative of IITs and IISc – Funded by MHRD Page 13 of 32 Figure 23.2: Use of SDS-PAGE to study protein folding-unfolding. Purification of the antigen-Preparative SDS-PAGE is routinely been used to purify the protein (antigen) to generate antibody (Figure 23.3). Protein of interest is produced in large quantity in the bacteria or other suitable expression system. Afterwards, the crude bacterial lysate is resolved on a midi or maxi gel containing a fused lane to load large amount (~2-3ml) of the lysate. A single lane of the gel can be analyzed either by staining or with western blotting to identify the position of the protein in the gel. The gel portion containing the desired protein is cut and the protein is electroeluted from the gel. The protein is lyophilized and used for immunization of the animal such as mouse or rabbit. Protein-protein interaction-There are two approaches in which vertical gel electrophoresis can be used to study the protein-protein interaction. In approach I, protein A and B is incubated in an invitro reaction to form the complex AB. Now the formation of complex AB can be analyzed on a native PAGE (Figure 23.4). As shown in figure 23.4, once the complex is formed there will be a shift of the band position in comparison to the individual protein bands. In approach 2, the protein A is resolved on the SDS-PAGE and transferred on the nitrocellulose membrane. The membrane is
- 14. NPTEL – Biotechnology – Bioanalytical Techniques and Bioinformatics Joint initiative of IITs and IISc – Funded by MHRD Page 14 of 32 blocked with the 1% BSA over-night at 40 C. Nitrocellulose membrane is incubated with the protein B over-night at 40 C. Membrane is washed with the buffer and probed Figure 23.3: Purification of antigen with the anti-B antibody followed by HRP cupled secondary antibody (antiIgG-HRP). Blot is developed by the di-amino benzidine (DAB). Figure 23.4: Study of the protein-protein interaction. Detection of glycoprotein and phosphoprotein- Protein sample resolved on SDS- PAGE is stained with the different reagents to specifically detect glycoprotein and phosphoprotein. Periodic acid Schiff (PAS) reagent specifically stain the glycoprotein. Where as phosphorylated protein can be detected by labeling with 32P followed by the autoradiography.
- 15. NPTEL – Biotechnology – Bioanalytical Techniques and Bioinformatics Joint initiative of IITs and IISc – Funded by MHRD Page 15 of 32 Lecture 24 Horizontal Gel Electrophoresis (Part-I) Horizontal gel electrophoresis- The electrophoresis in this gel system is performed in a continuous fashion with both electrodes and gel cassette submersed within the buffer. The schematic diagram of a vertical gel electrophoresis apparatus is given in Figure 24.1. The electrophoresis chamber has two platinum electrodes placed on the both ends are connected to the external power supply from a power pack which supplies a direct current or DC voltage. The tank filled with the running buffer and the gel casted is submerged inside the buffer. There are additional accessories needed for casting the agarose gel such as comb (to prepare different well), spacer, gel caster etc. Figure 24.1: Different components of horizontal gel electrophoresis apparatus. Buffer and reagent for electrophoresis- The purpose of each reagents used in horizontal gel electrophoresis are as follows- 1. Agarose-polymeric sugar used to prepare horizontal gel for DNA analysis. 2. Ethidium bromide- for staining of the agarose gel to visualize the DNA. 3. Sucrose-For preparation of loading dye for horizontal gel. 4. Tris-HCl- The component of the running buffer. 5. Bromophenol blue-Tracking dye to monitor the progress of the electrophoresis.
- 16. NPTEL – Biotechnology – Bioanalytical Techniques and Bioinformatics Joint initiative of IITs and IISc – Funded by MHRD Page 16 of 32 Casting of the agarose gel- Different steps to cast the agarose gel for horizontal gel electrophoresis are given in Figure 24.2. The agarose powder is dissolved in a buffer (TAE or TBE) and heated to melt the agarose. Hot agarose is poured into the gel cassette and allowed it to set. A comb can be inserted into the hot agarose to cast the well for loading the sample. In few cases, we can add ethidium bromide within the gel so that it stains the DNA while electrophoresis. Figure 24.2: Different steps in casting of the agarose gel for horizontal gel electrophoresis apparatus.
- 17. NPTEL – Biotechnology – Bioanalytical Techniques and Bioinformatics Joint initiative of IITs and IISc – Funded by MHRD Page 17 of 32 Running and staining-The gel cassette is placed in the electrophoresis tank submerged completely and DNA loaded into the well with the help of pipetman and run with a constant voltage. DNA runs from negative to positive end and ethidium bromide (EtBr) present in the gel stain the DNA. Observing the agarose gel in a UV- chamber shows the DNA stained with EtBr as organe colored fluorescence (Figure 36.3). Plasmid DNA RNA Figure 24.3: Observation of DNA stained with EtBr in a UV chamber.
- 18. NPTEL – Biotechnology – Bioanalytical Techniques and Bioinformatics Joint initiative of IITs and IISc – Funded by MHRD Page 18 of 32 Lecture 25 Horizontal Gel Electrophoresis (Part-II) Applications of Horizontal Agarose Gel Electrophoresis: Horizontal gel electrophoresis is used to answer several biological, molecular biology and cell biology question. Here, in today’s lecture we will discuss few selected example of application of horizontal gel electrophoresis- 1. Determination of size of DNA-The size of a DNA can be determined by comparing the size of the known DNA molecules. The DNA of known sizes are resolved on 0.8% agarose along with the unknown sample. The value of the relative migration (Rf) of each DNA band is calculated from the agarose gel. The values of relative migration (Rf) and size of the DNA is used to draw the calibration curve to calculate the size of the unknown DNA samples. 2. DNA-Protein Interaction-DNA is a negatively charged molecule and it interact with positively charged protein to form DNA-protein complex. The size and the hydrodynamic volume changes when DNA is interacting with protein to form DNA- protein complex. To study the DNA-protein interaction, a fix amount of DNA is incubated with the increasing concentration of protein (Figure 25.1). Due to the formation of DNA- protein complex, the hydrodynamic volume of the complex increases and a shift in band is observed. The DNA has a extended structure and it provides docking site for several protein molecules such as single stranded binding protein (SSB). As a result, a gradual shift in DNA band will be observed until the DNA binding site is not saturated with the protein molecules. Hence, at the end of the experiment, we can be able to understand several aspects of DNA-protein interaction: 1. Whether protein-X has a affinity for DNA and the interaction is specific or non- specific in nature. 2. What will be affinity parameters of the interaction of DNA to protein in making DNA-protein complex?
- 19. NPTEL – Biotechnology – Bioanalytical Techniques and Bioinformatics Joint initiative of IITs and IISc – Funded by MHRD Page 19 of 32 Figure 25.1: DNA-Protein interaction analysis by agarose gel electrophoresis.
- 20. NPTEL – Biotechnology – Bioanalytical Techniques and Bioinformatics Joint initiative of IITs and IISc – Funded by MHRD Page 20 of 32 3. Electroelution-As discussed in previous lecture, protein band present within the polyacrylamide gel block is removed by electroelution for further usage (Figure 25.2). In the electroelution, a gel band is cut from the SDS-PAGE and placed in a dialysis bag and sealed from both ends. The dialysis bag is choosen so that the molecular weight cut off of dialysis membrane should be lower than the protein of interest. The dialysis bag is placed in the horizontal gel apparatus with buffer and electrophoresis is performed with a constant voltage. During electrophoresis the protein band migrate and ultimately comes out from the gel block. Due to dialysis bag, salt and other small molecule contaminant moves out of the dialysis bag but protein remain trapped within the dialysis bag. Protein can be recovered from the dialysis bag for further use in downstream processing. Figure 25.2: Electroelution using horizontal gel electrophoresis apparatus.
- 21. NPTEL – Biotechnology – Bioanalytical Techniques and Bioinformatics Joint initiative of IITs and IISc – Funded by MHRD Page 21 of 32 4. Southern blotting- In southern blotting, the genomic DNA is digested with the EcoRI or BamHI and the DNA fragments are resolved on the agarose gel. The gel is incubated in an alkaline solution to denature the double stranded DNA to single stranded form. DNA is transferred on the nitrocellulose membrane by capillary action by applying a uniform pressure either by suction pressure or by placing wet paper towels. The membrane is incubated with a non-specific DNA such as sonicated calf thymus genomic DNA to block the binding sites on the membrane. A single stranded radioactive probe is added to the membrane and allowed to bind. Membrane is washed and the blot is developed by autoradiography. The DNA fragment complementary to the probe sequence binds the radioactive probe and give positive signal (Figure 25.3). Figure 25.3: Southern Blotting using horizontal gel electrophoresis apparatus.
- 22. NPTEL – Biotechnology – Bioanalytical Techniques and Bioinformatics Joint initiative of IITs and IISc – Funded by MHRD Page 22 of 32 5. Protein kinase assay-During a kinase reaction, protein kinase transfers a phosphate group from ATP to the substrate and impart a net negative charge on the substrate molecule. In the protein kinase assay, a peptide with net +1 charge is incubated in assay buffer containing enzyme, non-radioactive ATP. A control reaction is also performed where the enzyme is removed from the assay mixture. Both experimental and control reactions are loaded in the middle of the agarose gel. Peptide present in the control reaction has a net +1 charge and it will migrate towards –ve electrode where as peptide in experimental reaction has a net -1 charge and it will migrate towards +Ve electrode (Figure 25.4). The assay gives qualitative or semi- quantitative information about the protein kinase activity. But this assay can be used test different peptide sequences to known optimal peptide sequence of the substrate. The assay is easy to perform and it does not require any specialized equipments. Figure 25.4: protein kinase assay using agarose gel electrophoresis.
- 23. NPTEL – Biotechnology – Bioanalytical Techniques and Bioinformatics Joint initiative of IITs and IISc – Funded by MHRD Page 23 of 32 Lecture 26 Horizontal Gel Electrophoresis (Part-III) Introduction- Complex protein mixture or nucleic acids are analyzed using polyacrylamide or agarose gel respectively. The vertical gel system has limitation of being not been able to use to analyze proteins of both charge (negative or positive) in the same gel. Horizontal Polyacryalamide gel electrophoresis- In this apparatus, the complex biological sample is resolved as per their charge and move to the counter charge electrode. The sample loaded in the middle of the gel get resolved based on their mass/charge ratio. The gel cassette designed to prepare agarose gel is not appropriate to cast polyacrylamide gel due to exposure of gel with the environmental oxygen [Presence of oxygen inhibits the polymerization of acrylamide to form polyacrylamide gel]. The horizontal native PAGE separates protein mixture with high resolution and protein migration (Rf) correlates well with mass/charge ratio. Instrumentation Design of the Gel Cassette- The horizontal native PAGE cassette and comb is given in Figure 26.1. The gel cassette consists of 3 plates, one big plate and 2 small plates. A 2mm thick glass slide is sticked to the large glass plate to give in build spacers. The gel cassette is sealed with a thick foam impregnated with agarose to avoid leakage. Gel cassette is assembled with the help of binder clips with a 1 cm gap to place comb. Comb is also made up of glass slide.
- 24. NPTEL – Biotechnology – Bioanalytical Techniques and Bioinformatics Joint initiative of IITs and IISc – Funded by MHRD Page 24 of 32 Runnining of the Horizontal Native polyacrylamide gel Casting of the Horizontal Native polyacrylamide gel- Gel cassette is assembled by binder clips to keep 1cm gap between them to place comb. Leakage of the cassette was checked by water before pouring acrylamide solution. Gel cassette kept in vertical position and acrylamide solution is poured into the cassette through 1cm gap. A thin layer of water equilibrated butanol is over-layed on top of resolving gel. Same procedure is adopted to cast the resolving gel on other side of glass plate. Gel cassette is placed horizontally and stacking gel is poured and a comb is place to cast the wells. Figure 26.1: Design of the horizontal gel cassette. Sample preparation-Protein samples are mixed with 5x loading dye, containing 40% sucrose, 10% bromophenol blue (BPB), and 10% methylene blue (MB). BPB is an anionic dye and used to monitor mobility of proteins on the anodic side whereas MB is a cationic dye to track the movement on the other side (cathode) of the gel.
- 25. NPTEL – Biotechnology – Bioanalytical Techniques and Bioinformatics Joint initiative of IITs and IISc – Funded by MHRD Page 25 of 32 Electrophoresis of proteins in Horizontal Native PAGE- Once the stacking gel is polymerized, comb, binder clips and foam pads are removed and wells are washed with water or 1x native Tris-Glycine running buffer (pH 8.3). Gel cassettes is placed in the horizontal direction in the electrode chambers. The chamber is filled with chilled 1x native Tris-glycine running buffer to the level just enough to reach up-to glass plate level. Load the sample (up-to 20µl) into the wells and electrophoresis is performed on constant 100V in a cold room. Staining and destaining of the horizontal native gel- After electrophoresis is over, gel is removed from the cassette with the help of scalpel and stained with coomassie brilliant blue. The whole process of staining and destaining of gel completes in less than 3 hrs. A representative protein profile is given in Figure 26.2. Figure 26.2: Profile of protein sample run in the native horizontal PAGE. Advantages of the native horizontal PAGE 1. The horizontal PAGE can be used in conjugation with SDS-PAGE to separate and analyze complex biological samples. 2. User friendly and no specialized equipment. 3. Native preparative gel to purify proteins in bulk for activity assay, antibody development etc. 4. More-over, our design doesn’t need any specialized fabrication and it allows user to cast stacking and resolving gel together.
- 26. NPTEL – Biotechnology – Bioanalytical Techniques and Bioinformatics Joint initiative of IITs and IISc – Funded by MHRD Page 26 of 32 A native horizontal gel electrophoresis in conjugation with SDS-PAGE to resolve complex biological samples. Bacterial lysate is prepared and resolved on the native horizontal PAGE until dye reaches to the end of gel (Figure 26.3). Sample strip from the native PAGE is cut with the help of a sharp razor and soaked into de-naturation buffer (100mM Tris pH 8.8, 3% SDS, 5mM ß-mercaptomethanol, 1mM EDTA) at 60°C for 2 hrs. The stripe from the native horizontal PAGE is placed on the top of 12% resolving gel. The gap between resolving gel and sample stripe is filled with 5% stacking gel. Once the stacking gel is polymerized, SDS-PAGE is allowed to run at constant voltage (initially 100V and then after wards at higher voltage) up-to the end of the gel. Gel is removed from the glass plates and developed by coomassie staining (Figure 26.3). Figure 26.3: A 2-D gel profile of the bacterial lysate using native horizontal PAGE in Ist dimension and SDS-PAGE in the 2nd dimension.
- 27. NPTEL – Biotechnology – Bioanalytical Techniques and Bioinformatics Joint initiative of IITs and IISc – Funded by MHRD Page 27 of 32 Lecture 27 Application of High Resolution PAGE Introduction: Protein and DNA are polymeric molecules made up of the monomeric constituent. DNA is made up of 4 different types of nucleotide, A, T, G and C where as protein is made up 20 amino acids. Information present on the DNA is in the form of combination of these 4 nucleotides and responsible for phenotypic changes in an organism. After generation of recombinant DNA, it is also important to confirm its nucleotide sequence before further manipulation in the down-stream processing. DNA sequencing-Historically there are two methods of DNA sequencing with a similar principle of breaking the DNA (chemical or enzymatic method) into the small fragment followed by separation and analyze them on a high resolution electrophoresis gel. Di-Deoxy Chain termination or Sanger Methods: This method is originally developed by Frederick Sanger in 1977. In this method, a single stranded DNA is used as a template to synthesize complementary copy with the help of polymerase and in the presence of nucleotides (Figure 27.1). The polymerization reaction contains a primer and nucleotides, 3 normal nucleotides and 2’3’-dideoxynucleotide triphosphate (ddNTPs). When DNA polymerase utilizes ddNTPs as nucleotide, it gets incorporated into the growing chain but chain elongation stops at ddNTPs due to absence of 3’- hydroxyl group. In the typical sequencing reactions, 4 different ddNTPs are taken into the 4 separate reactions and analyzed on high resolution polyacrylamide gel electrophoresis. The ratio of NTPs/ddNTPS is adjusted so that chain termination occurs at each position of the base in the template. Protocol for Di-deoxy sequencing- There are two protocols people adopt to sequence DNA following di-deoxy chain termination method (Figure 27.2). Original sanger protocol uses klenow fragment as polymerase for DNA synthesis where as termination protocol uses a T7 polymerase or sequenase. The DNA sequencing by original sanger protocol has following steps: Step 1: A primer is added and annealed to the 3’ of the DNA template. Step 2: The radiolabeled 35 S ATP to label the primer. Step 3: The polymerease reaction is divided into 4 reactions.
- 28. NPTEL – Biotechnology – Bioanalytical Techniques and Bioinformatics Joint initiative of IITs and IISc – Funded by MHRD Page 28 of 32 Step 4: DNA synthesis continues until terminated by the incorporation of the specific ddNTPs (either A, T, G or C). Figure 27.1: Principle of Di-Deoxy Method. Step 5: A chase of polymerization reaction is performed in the presence of high concentration of NTPs to extend all non-terminated sequences into high molecular weight DNA. These high molecular sequences will not enter into the sequencing gel. The different steps in labeling/termination protocol differ from sanger protocol after step-1 and it has following steps: Step 2: A limited amount of NTPs are added along with the one of the radiolabeled nucleotide to label the DNA through the length. Step 3: The polymerease reaction is divided into 4 reactions. Step 4: The polymerase reaction continues with 4 nucleotide and one ddNTPs. Synthesis is terminated at the specific ddNTPs (either A, G. C. T) to give DNA fragment of different length.
- 29. NPTEL – Biotechnology – Bioanalytical Techniques and Bioinformatics Joint initiative of IITs and IISc – Funded by MHRD Page 29 of 32 Figure 27.2: Different Steps in Di-deoxy Method The polymerization reaction is analyzed on a high resolution polyacrylamide gel. The use of sequenase allow to perform sequencing of long DNA stretches where as original sanger method is more appropriate for short length DNA.
- 30. NPTEL – Biotechnology – Bioanalytical Techniques and Bioinformatics Joint initiative of IITs and IISc – Funded by MHRD Page 30 of 32 Maxam-Gilbert method: DNA cloning and polymerization reactions made the sanger method less popular than maxam-gilbert DNA sequencing method. This method was discovered by Allan Maxam and Walter Gilbert in 1977 which is based on chemical modification and subsequent cleavage. In this method, a 3’ or 5’ radiolabeled DNA is treated with a base specific chemicals which randomly cleaves the DNA at their specific target nucleotide. These fragments are analyzed on a high resolution polyacrylamide gel and a autoradiogram is developed (Figure 27.3). The fragment with terminal radiolabel appears as band in the gel. The chemical reactions are performed in two steps; Base Specific Reaction: Different base specific reagents are used to modify the target nucleotide. Reaction 1: Dimethylsulfate (DMS) modifies the N7 of guanine and then opens the ring between C8 and N9. Reaction 2: Formic acid acts on purine nucleotide (G+A) by attacking on glycosidic bond. Reaction 3: Hydrazine breaks the ring of pyridine (T+C). Reaction 4: Where as in the presence of salt (NaCl), it breaks the ring of cytosine. Cleavage reaction : After the base specific reactions, piperidine is added which will replace the modified base and catalyzes the cleavage of phsophodiester bond next to the modified nucleotide.
- 31. NPTEL – Biotechnology – Bioanalytical Techniques and Bioinformatics Joint initiative of IITs and IISc – Funded by MHRD Page 31 of 32 Interpretation of the band in autoradiogram: The fragment in G lane is read as “G” where as fragment present in G+A but absent in G is read as “A”. Similarly fragment in C is read as “C” where as fragment present in T+C but absent in C is read as “T”. To get the DNA sequence, the band with the lowest molecular weight is read followed by next band in the four lane. For example in the given figure 27.3, in G lane the band is of lowest molecular weight followed by band in A lane etc. Figure 27.3: Different Steps in Maxam-Gilbert Method
- 32. NPTEL – Biotechnology – Bioanalytical Techniques and Bioinformatics Joint initiative of IITs and IISc – Funded by MHRD Page 32 of 32 Next generation sequencing methods: With the advancement in cloning and requirement for cheap sequencing methodology, several next generation sequencing methods are developed. These have lower cost of sequencing as well increased the output by processing multiple sample at the same time. The next generation DNA sequencing technologies developed as follows- • Massively parallel signature sequencing (MPSS) • Polony sequencing • 454 pyrosequencing • Illumina (Solexa) sequencing • SOLiD sequencing • Ion semiconductor sequencing • DNA nanoball sequencing • Heliscope single molecule sequencing • Single molecule real time (SMRT) sequencing Student are advised to follow these publications to know more about different next generation sequencing technologies and their comparison, (1) Quail, Michael; Smith, Miriam E; Coupland, Paul et al. "A tale of three next generation sequencing platforms: comparison of Ion torrent, pacific biosciences and illumina MiSeq sequencers". BMC Genomics 13 (1): 341 PMID 22827831 (2) Liu, Lin; Li, Yinhu; Li, Siliang et al. Comparison of Next-Generation Sequencing Systems. Journal of Biomedicine and Biotechnology 2012: 1–11.