Downloaded 434 times


![Indicator
Indicator
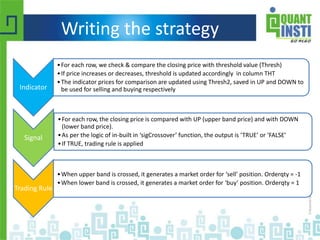
•For each row, we check & compare the closing price with threshold value (Thresh)
•If price increases or decreases, threshold(Thresh) is updated accordingly in column THT
•The indicator prices for comparison are updated using band limit (Thresh2), saved in UP
and DOWN to be used for selling and buying respectively
THTFunc<-function(CompTh=NSEI,Thresh=6, Thresh2=3){
numRow<- nrow(CompTh)
xa<-coredata(CompTh)[,4]
xb<-xa
tht<-xa[1]
for(i in 2:numRow){
if(xa[i]>(tht+Thresh)){ tht<-xa[i]}
if(xa[i]<(tht-Thresh)){ tht<-xa[i]}
xb[i]<-tht
}
up <- xb + Thresh2
dn<- xb-Thresh2
res <- cbind(xb, dn,up)
colnames(res) <- c("THT", "DOWN", "UP")
reclass(res,CompTh)
}
THTFunc()](https://image.slidesharecdn.com/howtodesignquanttradingstrategiesusingr-150516064002-lva1-app6891/85/How-to-design-quant-trading-strategies-using-R-12-320.jpg)
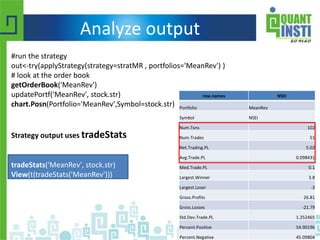


This document outlines a comprehensive guide on designing quantitative trading strategies using the R programming language and its associated packages, particularly 'quantstrat'. It details the steps involved in strategy development, including hypothesis formation, testing, refining, and implementing in a live trading environment. Additionally, it introduces an educational program on algorithmic trading offered by QuantInsti, designed for professionals looking to enhance their knowledge and skills in financial technology.


![Awareness of digital currency[1] (1).pptx](https://cdn.slidesharecdn.com/ss_thumbnails/awarenessofdigitalcurrency11-260125155504-b1badee4-thumbnail.jpg?width=640&height=640&fit=bounds)


