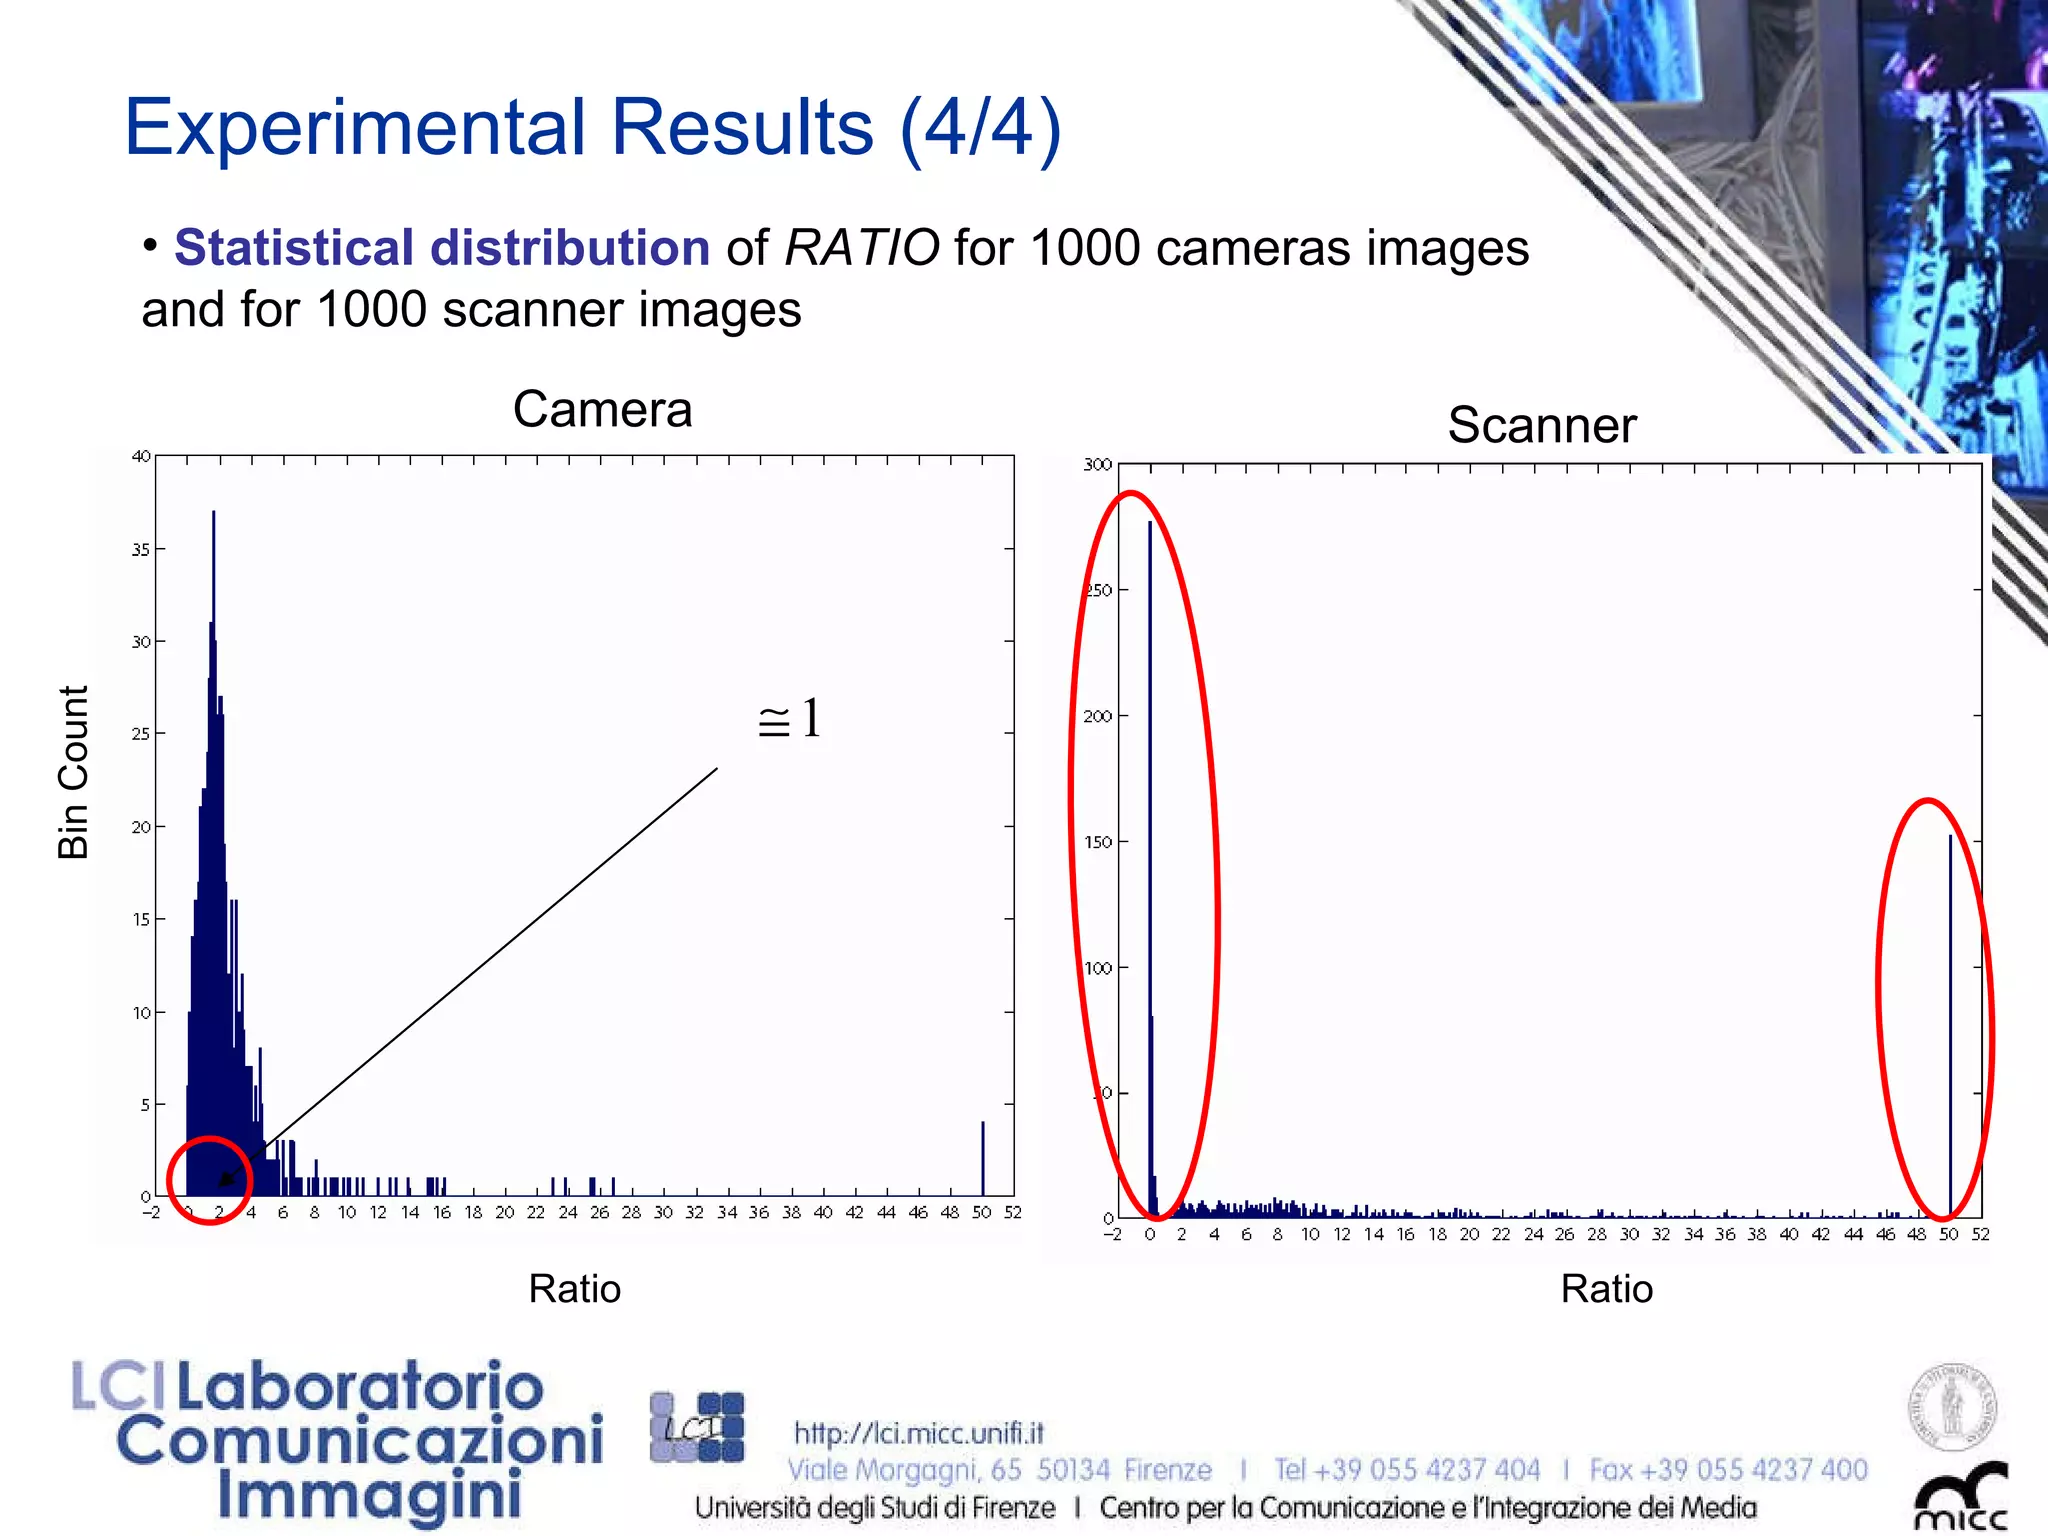
Distinguishing between camera and scanned images by means of frequency analysis Roberto Caldelli, Irene Amerini and Francesco Picchioni {roberto.caldelli, irene.amerini, francesco.picchioni}@unifi.it 20 January 2009
Outline Multimedia Forensics Camera vs Scanner Sensor fingerprint Proposed methodology Experimental results Conclusions
Multimedia Forensics The goal of  multimedia forensics  is to detect image forgeries determine the source of an image (scanner, CG, digital camera, ...) recover  image history Acquisition device identification Kind of device Brand Specific device Assessing image integrity Copy-move Splicing Double JPEG compression
Camera vs Scanner-  Acquisition Process Digital Camera CFA and demosaicking Bidimensional sensor array Flat-bed Scanner Tri-linear color filter array: no demosaicing Mono dimensional sensor array
Sensor fingerprint & PRNU Sensor imperfections defective pixels: hot/dead pixels  (removed by post-processing) ‏ shot noise (random) pattern noise (systematic):  Properties PRNU: unique for each sensor  multiplicative noise  Fixed Pattern Noise : dark current (exposure, temperature) suppressed by subtracting a dark frame from the image. Photo Response Non-Uniformity : inhomogenities over the silicon wafer and imperfections generated during sensor manufacturing process (flat fielding)
M N scanning direction PRNU characterization (1/2) De-noised image-DWT Because of the scanner sensor, it is expected that:  All the rows are equal, at least ideally!
This is true only ideally, being S corrupted its periodical structure is altered, but most of the energy is located in such spikes!! PRNU characterization (2/2) Consequently, the spectrum of the periodical signal S will be made by spikes equispaced of (NxM)/M=N. By concatenating all the rows in a single signal S composed by NxM samples:  Periodical of period M and  contains N repetitions
Proposed methodology (1/3) To improve the possible presence of 1-D PRNU, the noise image R is divided in non-overlapping stripes whose height is  L : horizontally and vertically to investigate both scanning directions rows (columns) in a stripe are averaged  M L M N M Ideal  Bar Code This is done horizontally obtaining Rr and vertically obtaining Rc N/L
Proposed methodology (2/3) Digital Camera Scanner (scanning direction row) Ideal M N/L Then, as explained before, two mono-dimensional signals S r  and S c  are constructed by tailing all the rows and all the columns.
Proposed methodology (3/3) DFT (Discrete Fourier Transform)  is applied to signals S r  and S c   and the magnitude of the coefficients is computed.  Samples located in the expected periodical positions and with an amplitude above a defined threshold  T  are taken. Two energy factors F r  and F c  are then calculated by adding all the DFT coefficients satisfying the previous criterion and the  RATIO = F r  /F c  is evaluated:  High value : image scanned in a row direction Small value : image scanned in a column direction Around  1 : image coming from a digital camera (neither energy factor are predominant)
Experimental Results (1/4) 4 scanners :  Epson Expression XL 10000; HP Scanjet 8300, HP Deskjet F4180, Brother DCP 7010  7 commercial cameras :  Canon DIGITAL IXUS i ZOOM, Nikon COOLPIX L12, Fuji Finepix F10, HP Photosmart C935, Nikon D80, Samsung VP-MS11, Sony DSC-P200 2000 images, JPEG, TIFF Image patch 1024x768 Camera vs Scanner Scanning direction
Experimental Result (2/4) Energy  RATIO  for 200 scanned images and 200 cameras Clustering, no information on scanning direction  RATIO >1 inverse taken Digital camera Scanner
Experimental Results (3/4) Energy  RATIO  for 950 scanned images  Column scanning direction row scanning direction
Experimental Results (4/4) Statistical distribution  of  RATIO  for 1000 cameras images and for 1000 scanner images Scanner Camera Ratio Ratio Bin Count
Conclusions A novel technique, based on a DFT analysis, to distinguish between digital camera and scanned images has been presented. Scanning direction can be detected too. Future Trends   To establish a statistical threshold  T
Distinguishing between camera and scanned images by means of frequency analysis Roberto Caldelli, Irene Amerini and Francesco Picchioni {roberto.caldelli, irene.amerini, francesco.picchioni}@unifi.it 20 January 2009

E-Forensics

  • 1.
    Distinguishing between cameraand scanned images by means of frequency analysis Roberto Caldelli, Irene Amerini and Francesco Picchioni {roberto.caldelli, irene.amerini, francesco.picchioni}@unifi.it 20 January 2009
  • 2.
    Outline Multimedia ForensicsCamera vs Scanner Sensor fingerprint Proposed methodology Experimental results Conclusions
  • 3.
    Multimedia Forensics Thegoal of multimedia forensics is to detect image forgeries determine the source of an image (scanner, CG, digital camera, ...) recover image history Acquisition device identification Kind of device Brand Specific device Assessing image integrity Copy-move Splicing Double JPEG compression
  • 4.
    Camera vs Scanner- Acquisition Process Digital Camera CFA and demosaicking Bidimensional sensor array Flat-bed Scanner Tri-linear color filter array: no demosaicing Mono dimensional sensor array
  • 5.
    Sensor fingerprint &PRNU Sensor imperfections defective pixels: hot/dead pixels (removed by post-processing) ‏ shot noise (random) pattern noise (systematic): Properties PRNU: unique for each sensor multiplicative noise Fixed Pattern Noise : dark current (exposure, temperature) suppressed by subtracting a dark frame from the image. Photo Response Non-Uniformity : inhomogenities over the silicon wafer and imperfections generated during sensor manufacturing process (flat fielding)
  • 6.
    M N scanningdirection PRNU characterization (1/2) De-noised image-DWT Because of the scanner sensor, it is expected that: All the rows are equal, at least ideally!
  • 7.
    This is trueonly ideally, being S corrupted its periodical structure is altered, but most of the energy is located in such spikes!! PRNU characterization (2/2) Consequently, the spectrum of the periodical signal S will be made by spikes equispaced of (NxM)/M=N. By concatenating all the rows in a single signal S composed by NxM samples: Periodical of period M and contains N repetitions
  • 8.
    Proposed methodology (1/3)To improve the possible presence of 1-D PRNU, the noise image R is divided in non-overlapping stripes whose height is L : horizontally and vertically to investigate both scanning directions rows (columns) in a stripe are averaged M L M N M Ideal Bar Code This is done horizontally obtaining Rr and vertically obtaining Rc N/L
  • 9.
    Proposed methodology (2/3)Digital Camera Scanner (scanning direction row) Ideal M N/L Then, as explained before, two mono-dimensional signals S r and S c are constructed by tailing all the rows and all the columns.
  • 10.
    Proposed methodology (3/3)DFT (Discrete Fourier Transform) is applied to signals S r and S c and the magnitude of the coefficients is computed. Samples located in the expected periodical positions and with an amplitude above a defined threshold T are taken. Two energy factors F r and F c are then calculated by adding all the DFT coefficients satisfying the previous criterion and the RATIO = F r /F c is evaluated: High value : image scanned in a row direction Small value : image scanned in a column direction Around 1 : image coming from a digital camera (neither energy factor are predominant)
  • 11.
    Experimental Results (1/4)4 scanners : Epson Expression XL 10000; HP Scanjet 8300, HP Deskjet F4180, Brother DCP 7010 7 commercial cameras : Canon DIGITAL IXUS i ZOOM, Nikon COOLPIX L12, Fuji Finepix F10, HP Photosmart C935, Nikon D80, Samsung VP-MS11, Sony DSC-P200 2000 images, JPEG, TIFF Image patch 1024x768 Camera vs Scanner Scanning direction
  • 12.
    Experimental Result (2/4)Energy RATIO for 200 scanned images and 200 cameras Clustering, no information on scanning direction RATIO >1 inverse taken Digital camera Scanner
  • 13.
    Experimental Results (3/4)Energy RATIO for 950 scanned images Column scanning direction row scanning direction
  • 14.
    Experimental Results (4/4)Statistical distribution of RATIO for 1000 cameras images and for 1000 scanner images Scanner Camera Ratio Ratio Bin Count
  • 15.
    Conclusions A noveltechnique, based on a DFT analysis, to distinguish between digital camera and scanned images has been presented. Scanning direction can be detected too. Future Trends To establish a statistical threshold T
  • 16.
    Distinguishing between cameraand scanned images by means of frequency analysis Roberto Caldelli, Irene Amerini and Francesco Picchioni {roberto.caldelli, irene.amerini, francesco.picchioni}@unifi.it 20 January 2009

Editor's Notes

  • #4 image, video and audio forensic image analysis is the application of image science and domain expertise to interpret the content of an image or the image itself in legal matters (SWGIT- www.fbi.gov)
  • #5 Lens system: concave e convesse per prevenire aberrazione cromatica e sferica oppure lenti asferiche Auto-esposimetro Auto-focus Unità di stabilizzazione Filtri infrarossi; anti-aliasing filter CFA per produrre un’immagine a colori Sensor: matrice di fotodiodi; quando la luce colpisce il sensore ciascun pixel del sensore generano un segnale proprorzionale all’intensità luminosa che è poi convertita in un segnale digitale con un convertitore analogico-digitale DIP Digital Image Processor
  • #6 Crypto: il digest è legato strettamente al contenuto e viene definito un particolare formato e non è possibile usarne altri; per ogni midifca fatta sull’immagine il digest cambia.
  • #7 È stato utilizzato con successo per la compressione delle immagini
  • #8 È stato utilizzato con successo per la compressione delle immagini
  • #11 DFT analysis