Download to read offline
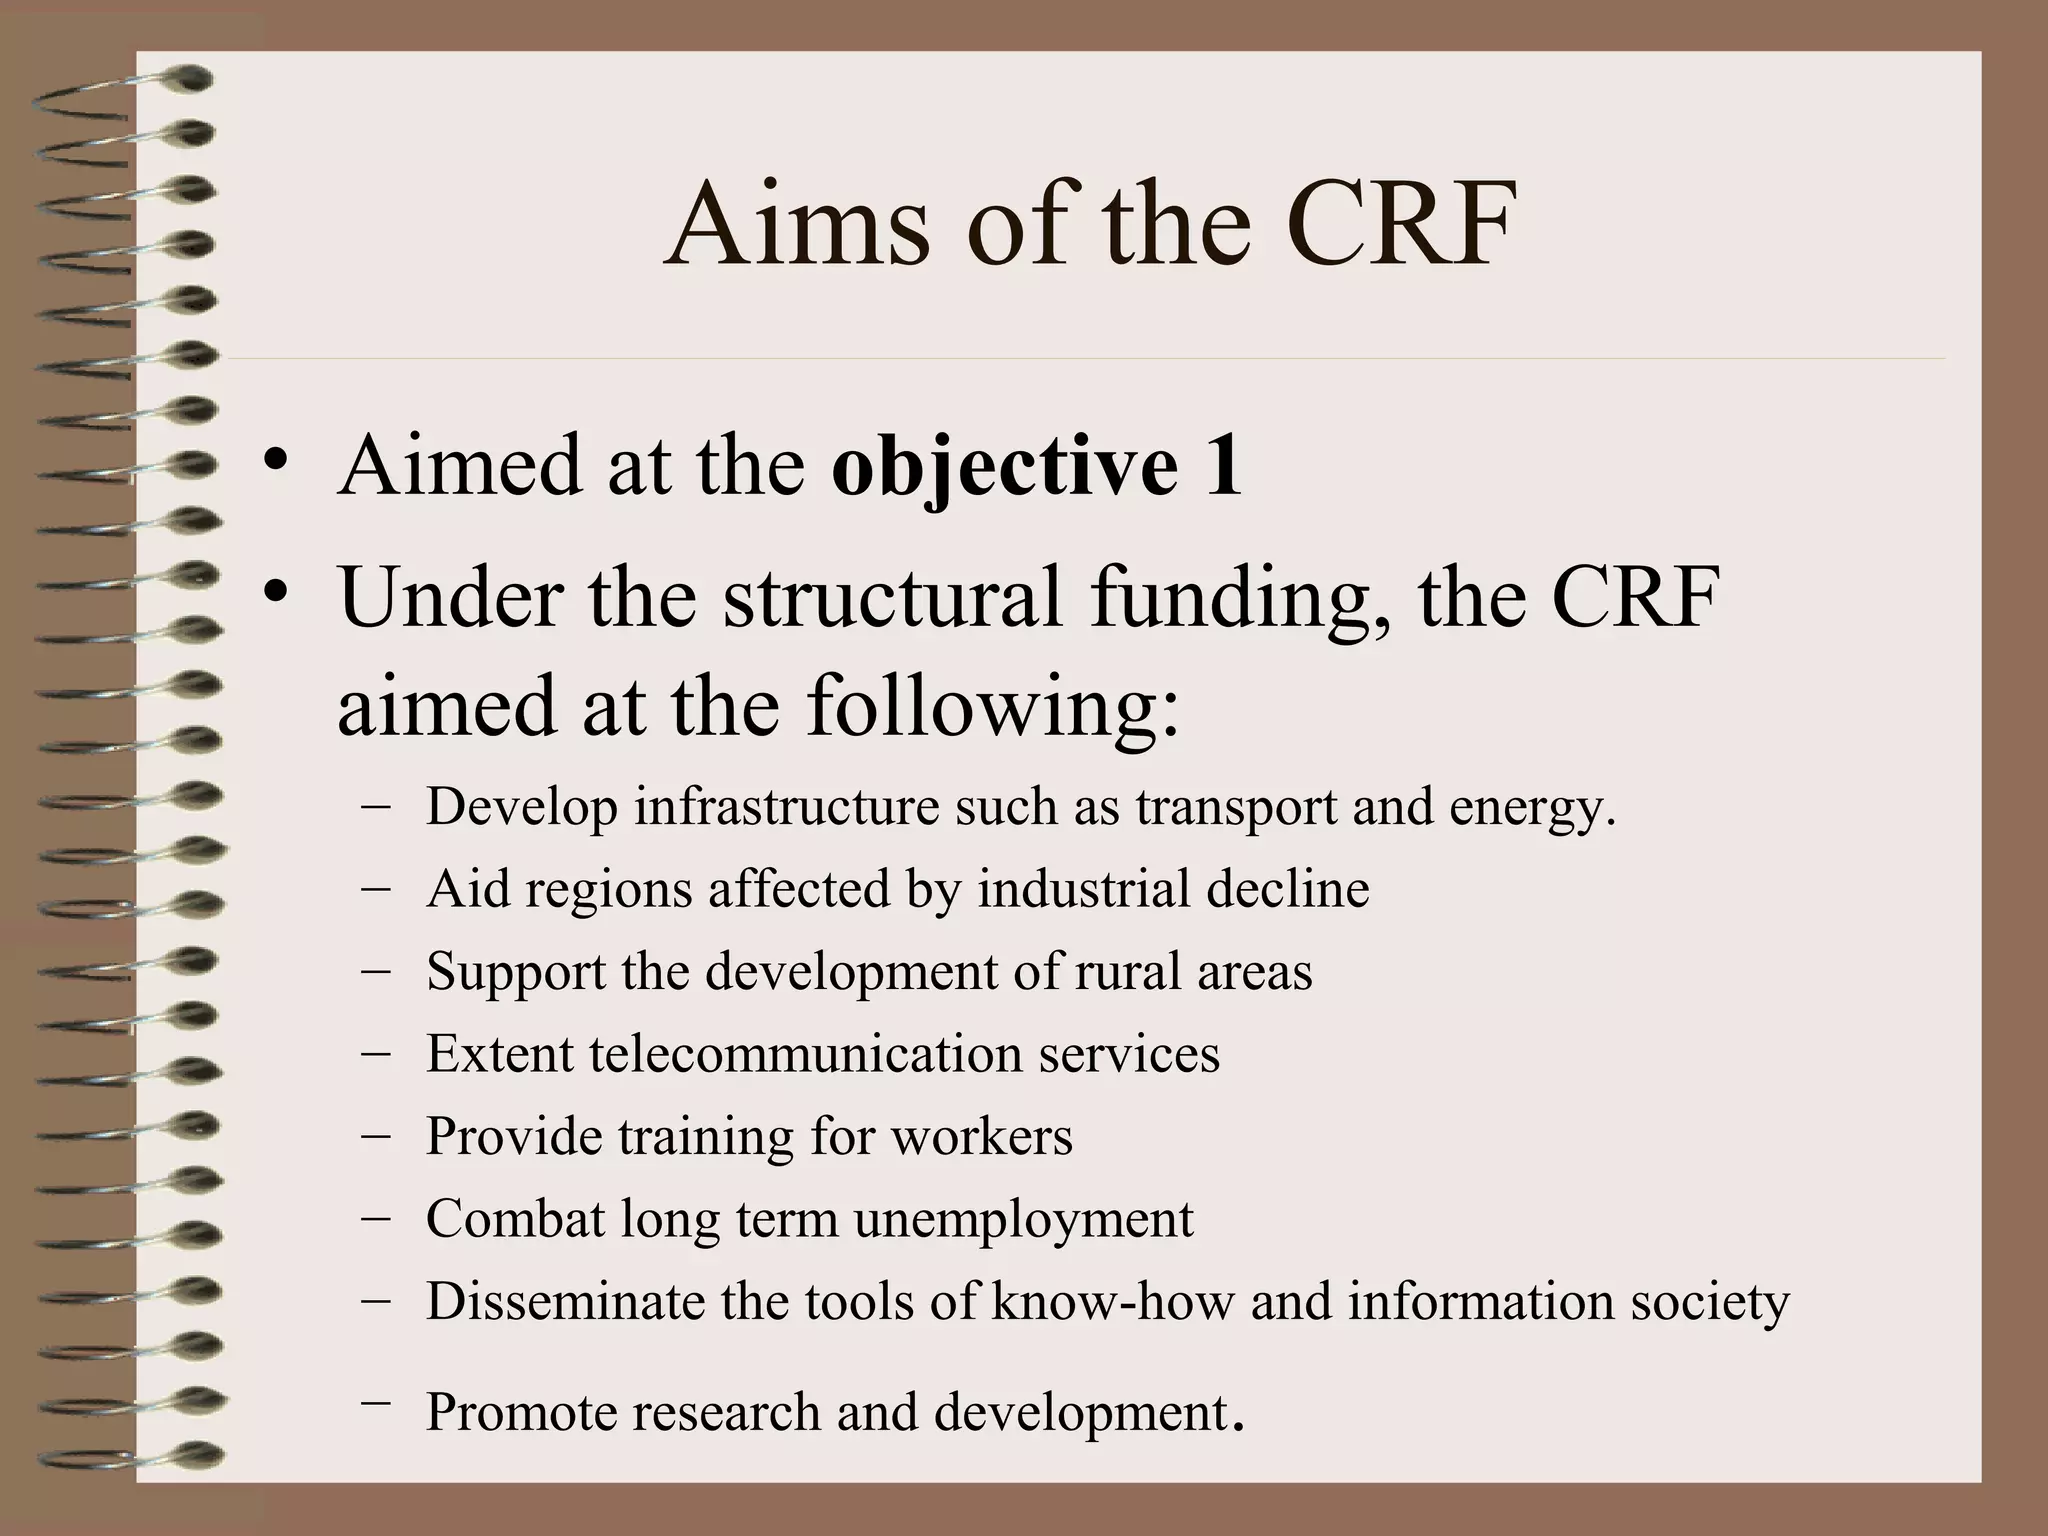
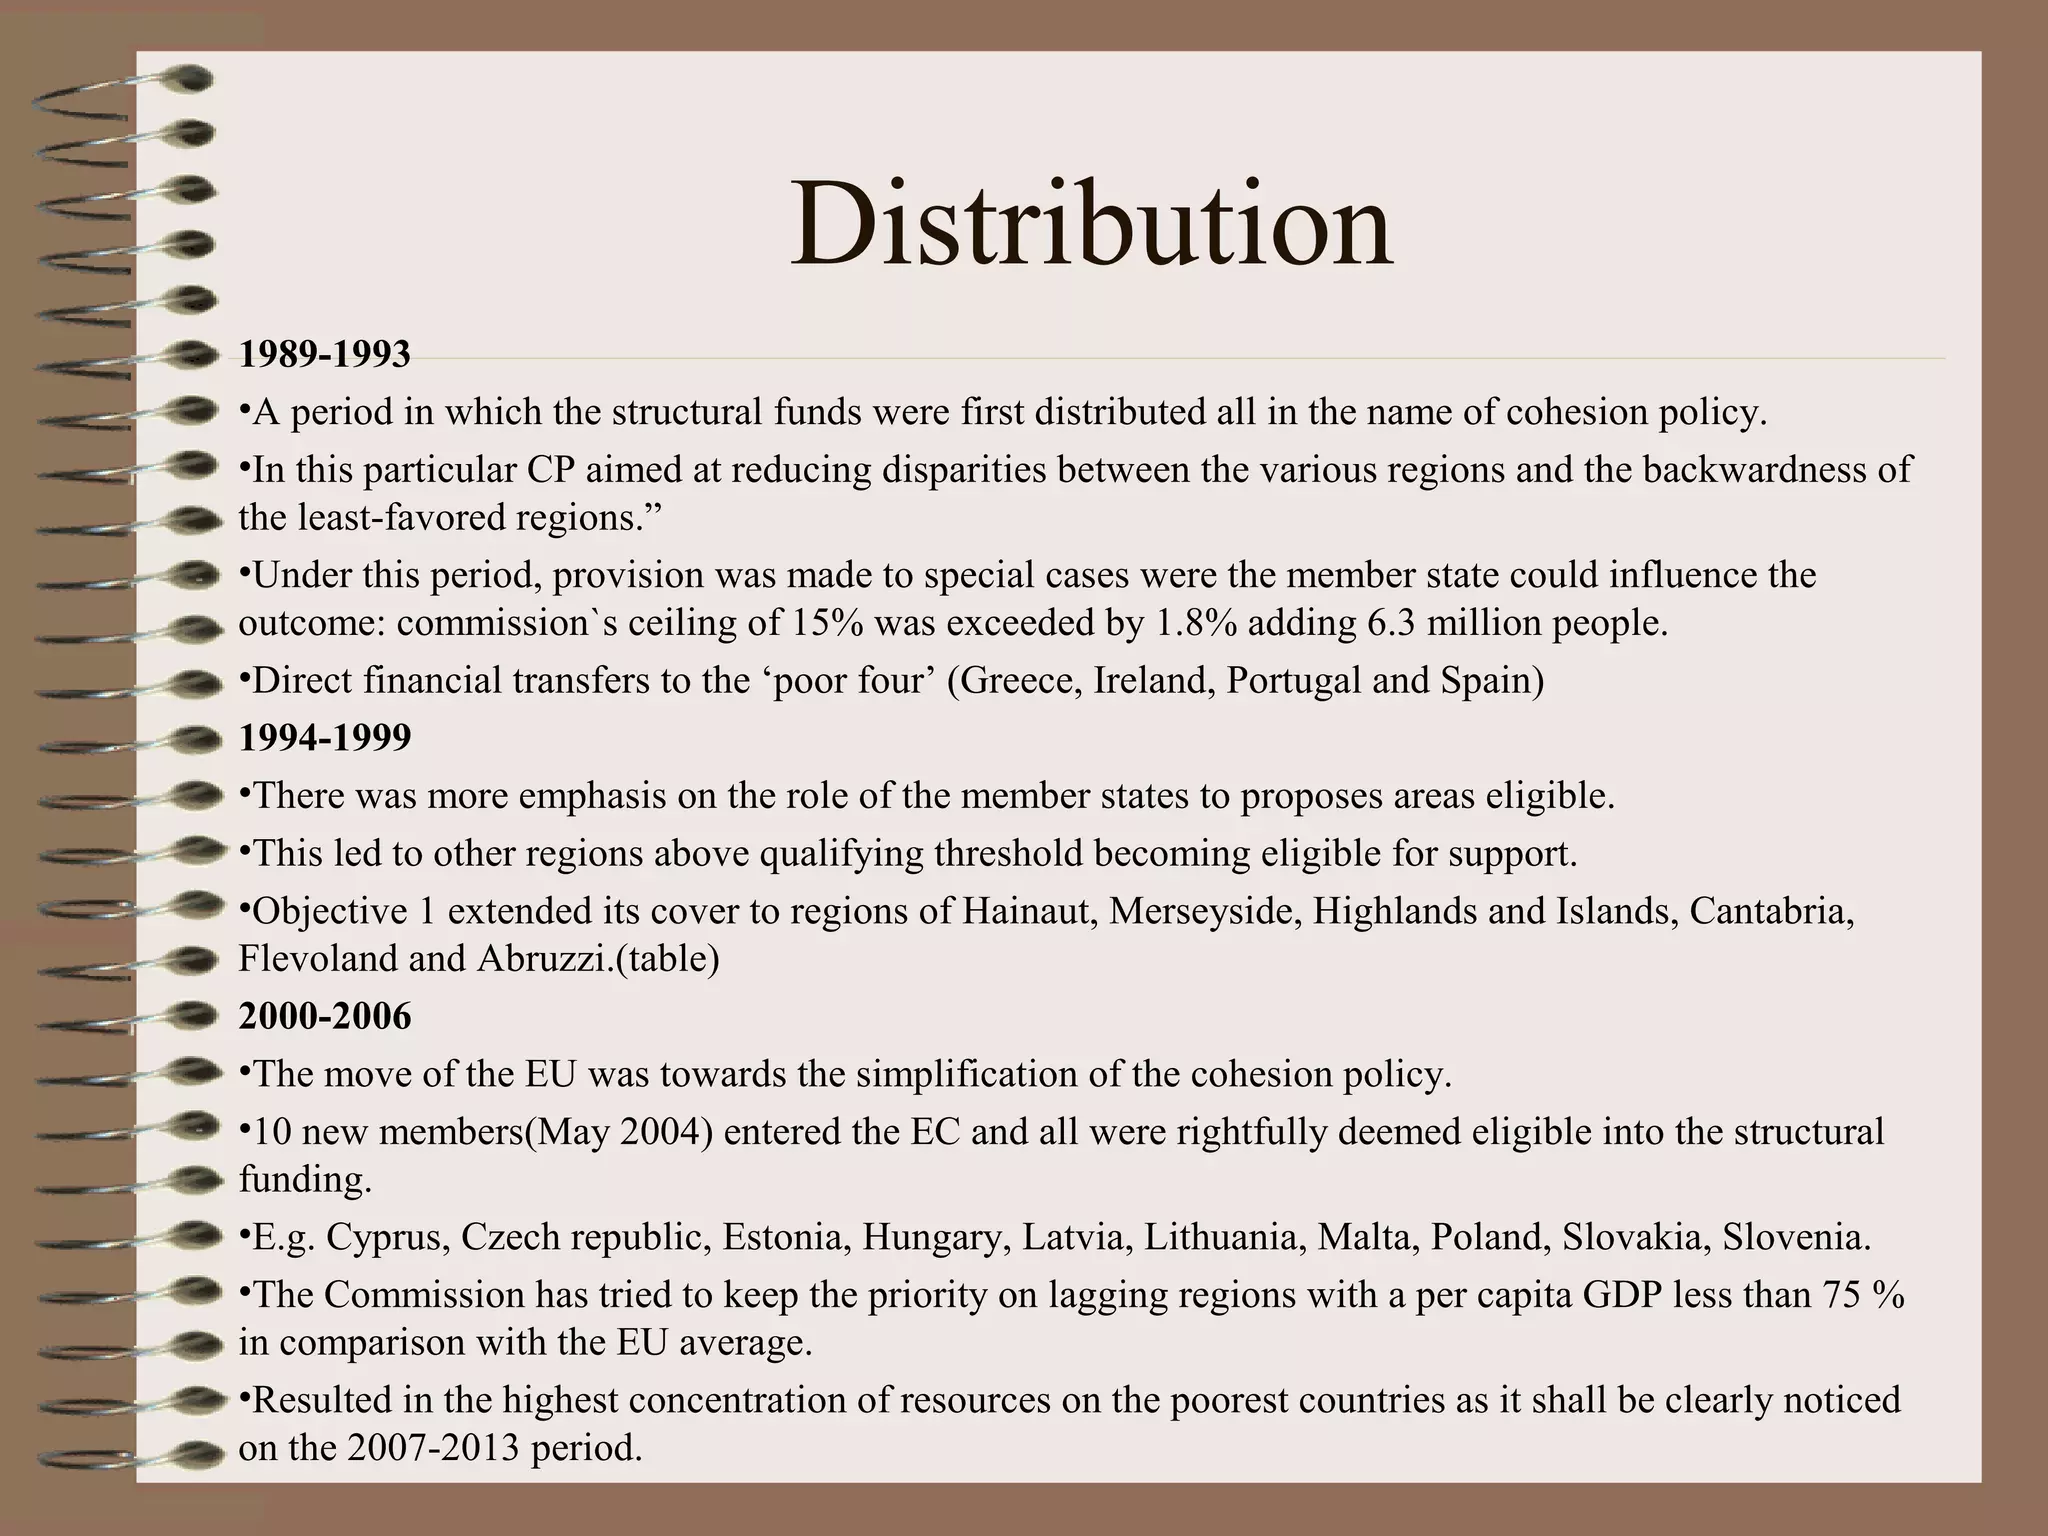
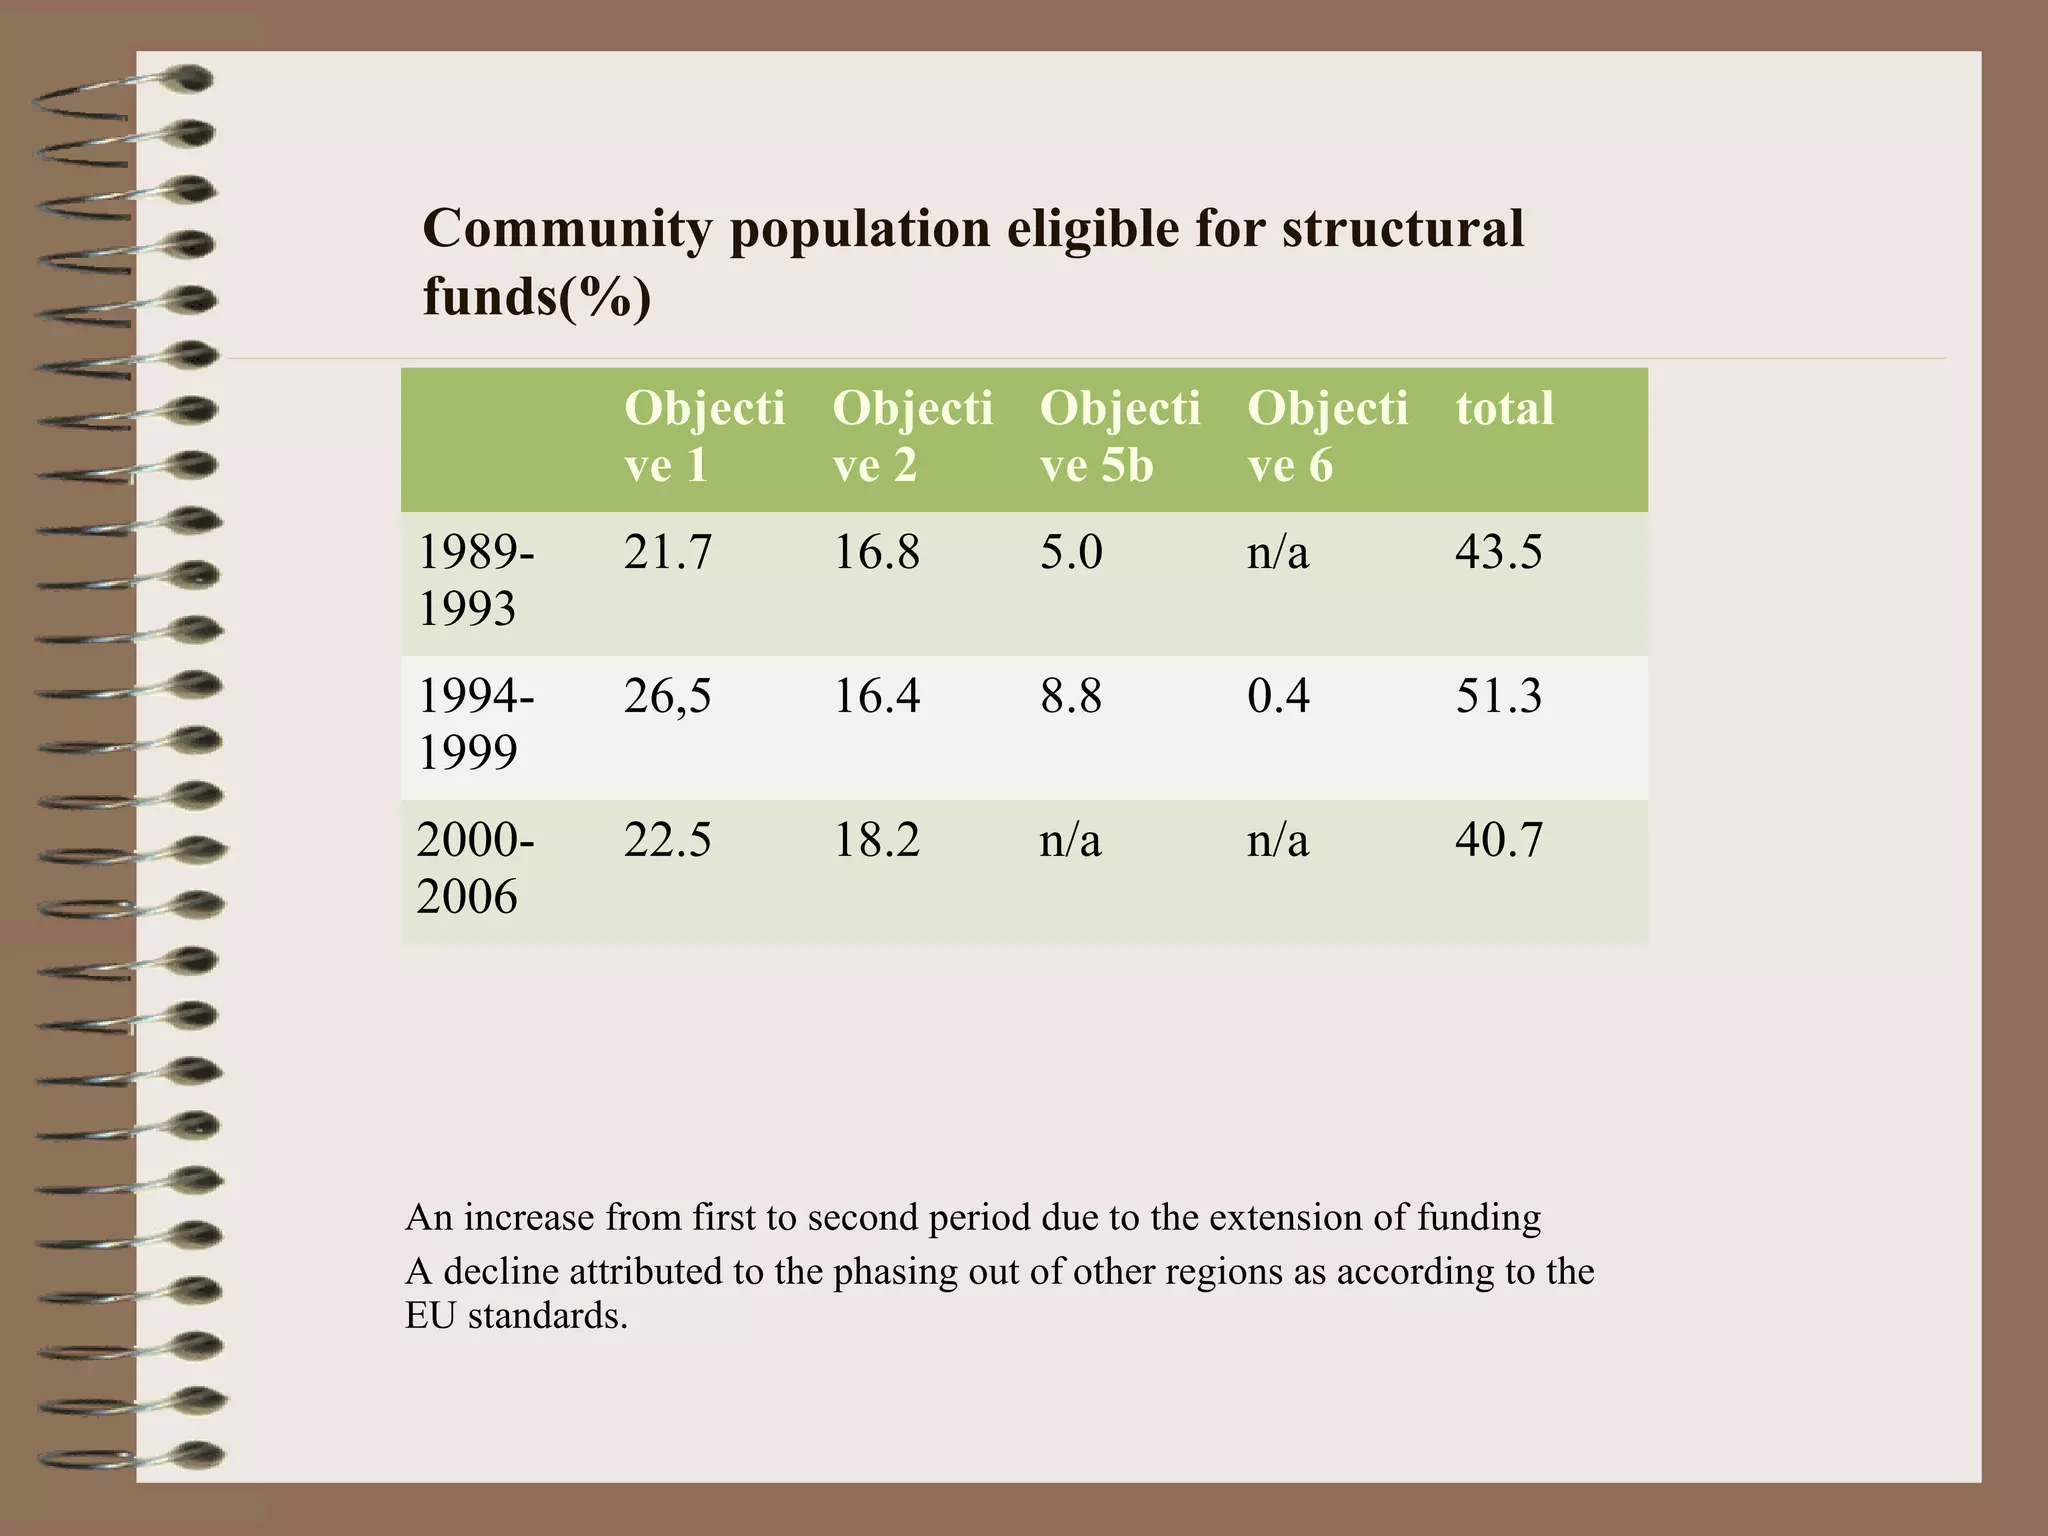

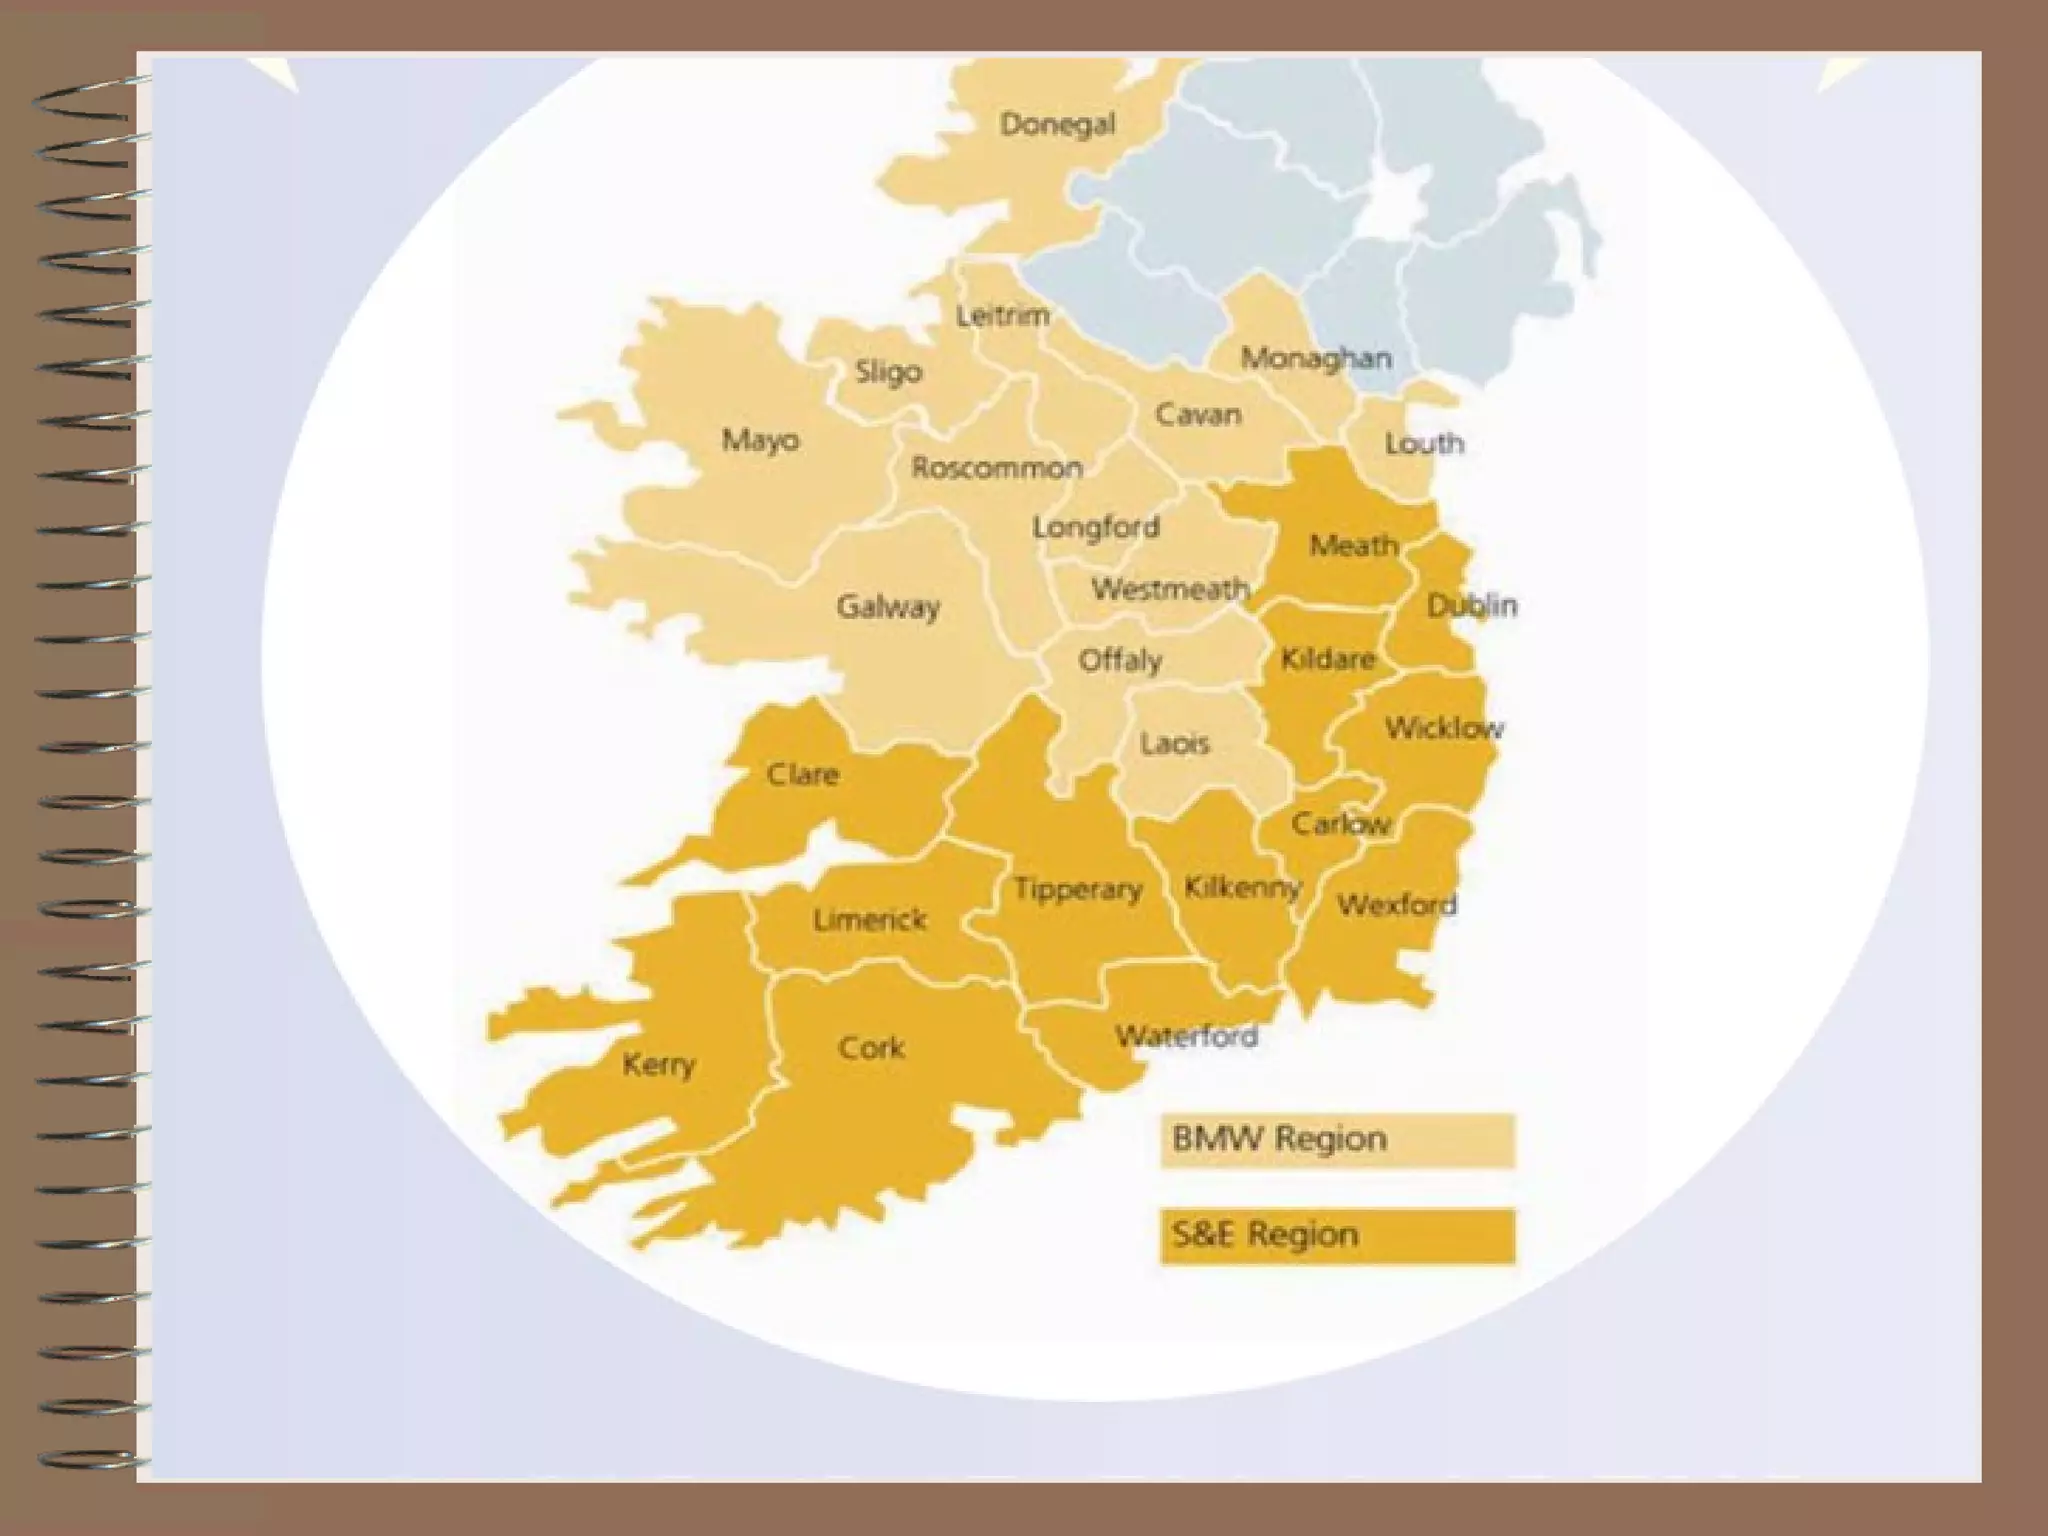

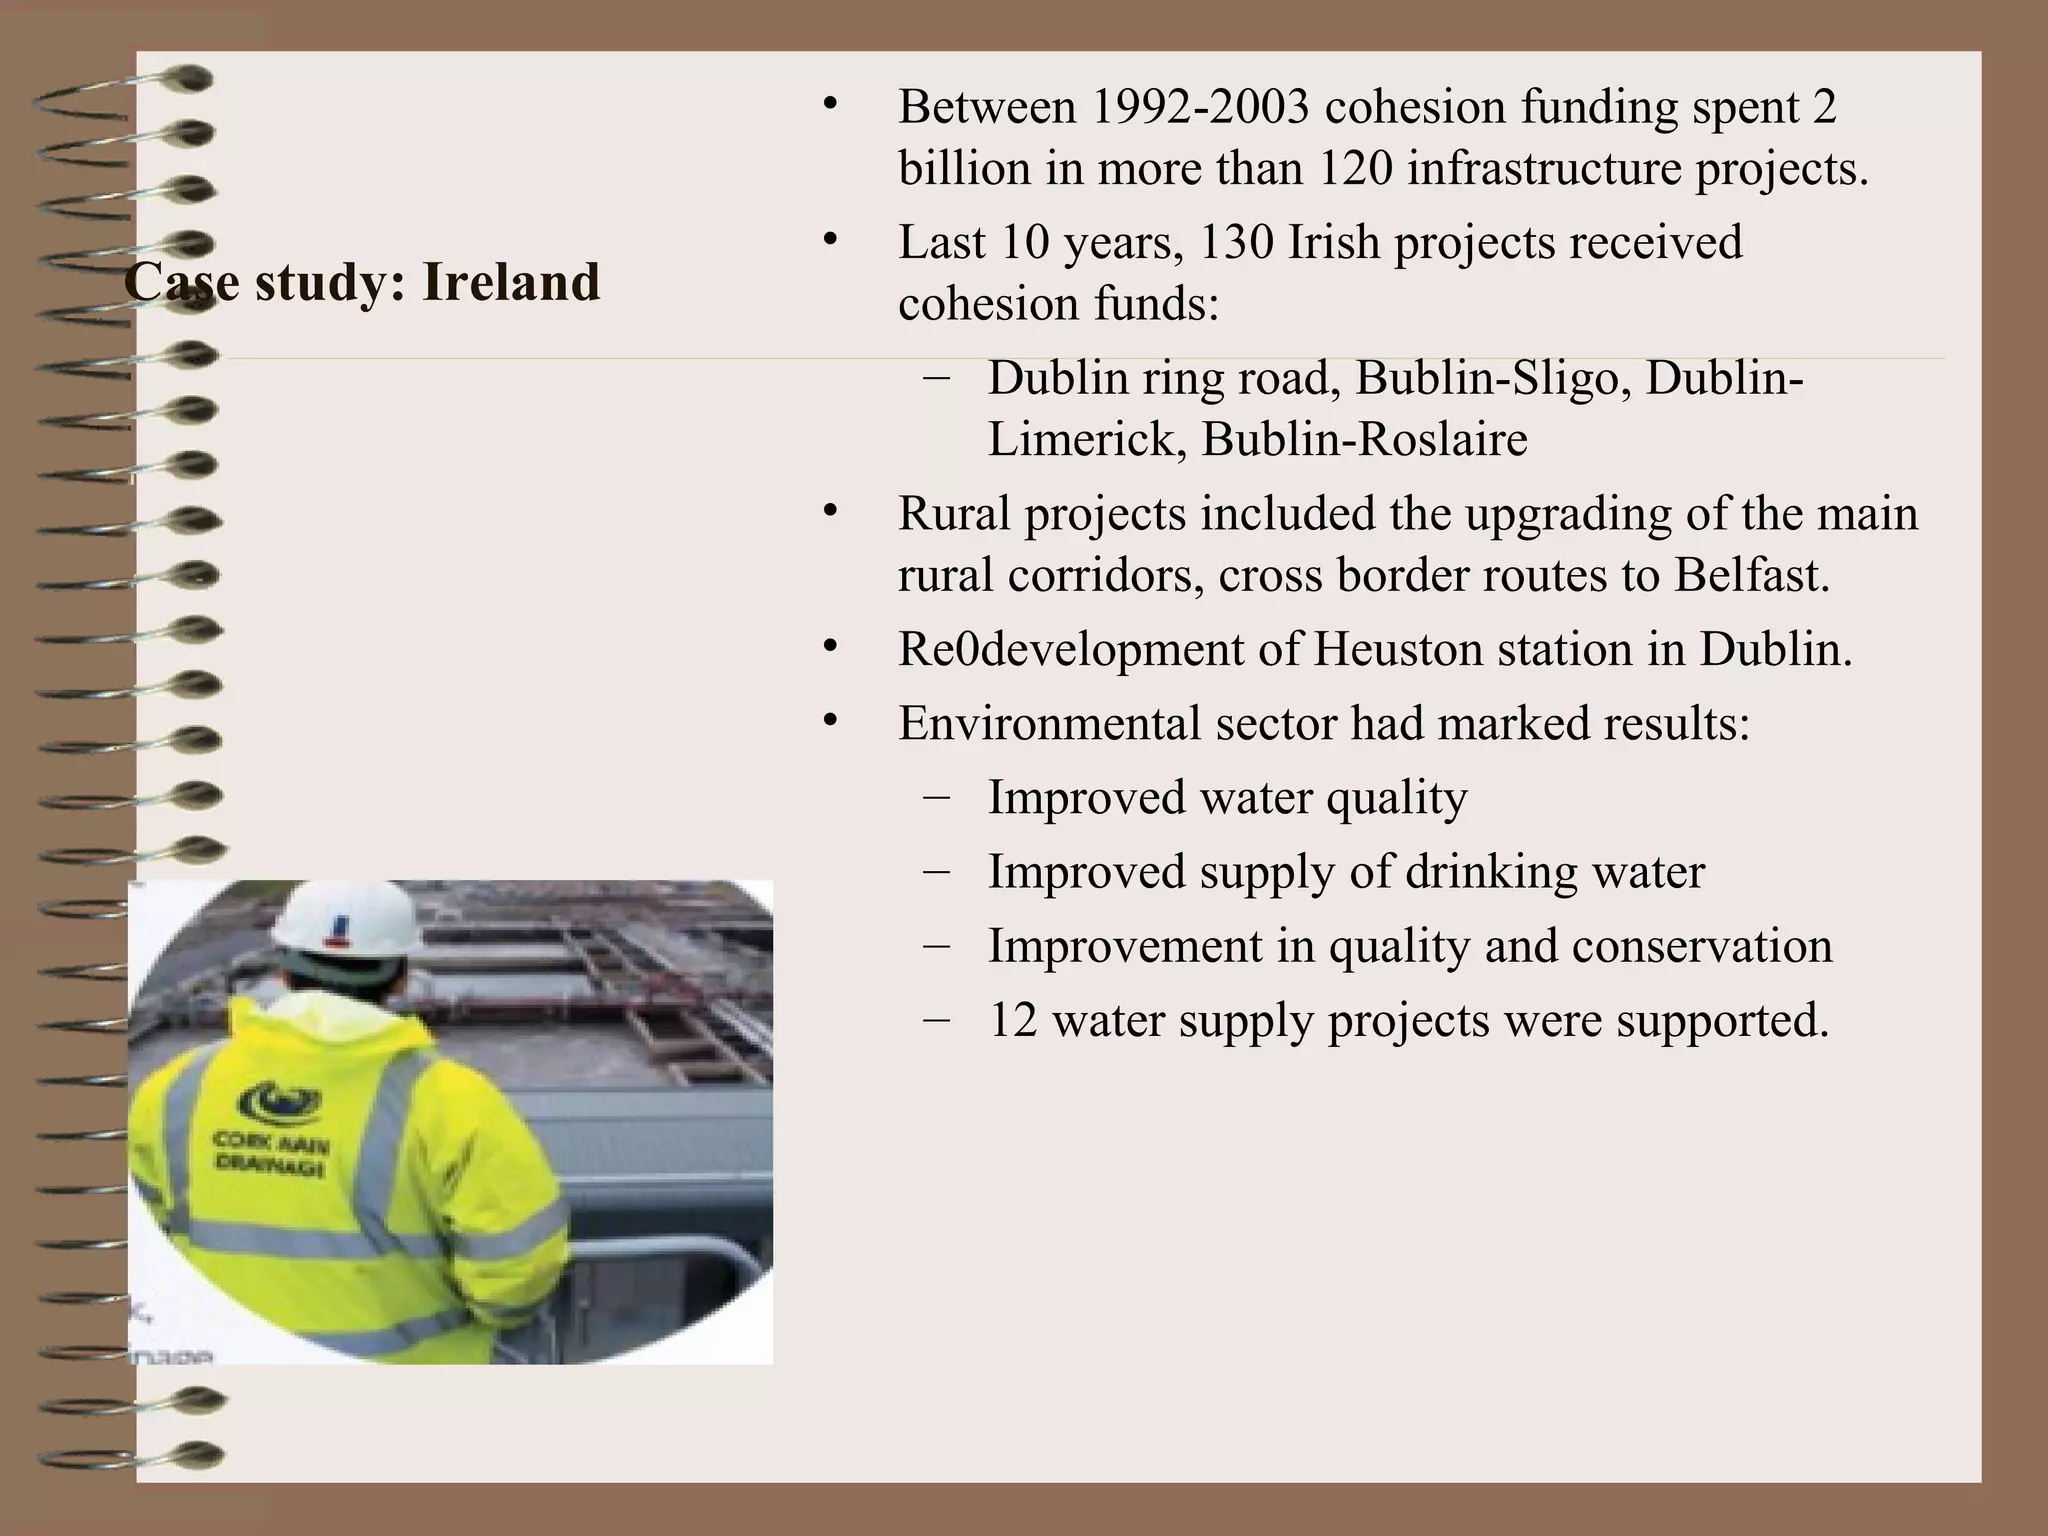

The EU convergence regional funding aims to transfer resources from rich to poor regions of the EU to promote solidarity and reduce economic and social disparities. Over time, the funds have been targeted to an increasing number of eligible regions, starting with the poorest and expanding to include others above the GDP threshold. Case studies of Ireland show that between 1989-1999, EU funding accounted for increases in Ireland's GDP and was invested in infrastructure, productive sectors, human resources and local development, contributing to Ireland's economic growth. Evaluations find that EU cohesion policy and coordination of regional policies can improve national policies and reduce barriers to integration.


