Download as PDF, PPTX


![7
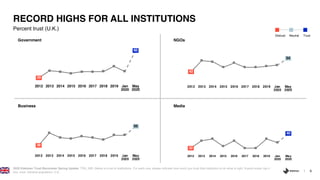
Percent trust in government
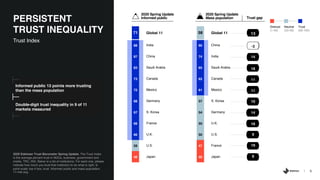
DOUBLE-DIGIT RISE IN GOVERNMENT TRUST
IN 6 OF 11 MARKETS MEASURED
2020 Edelman Trust Barometer Spring Update. TRU_INS. [Government in general] Below is a list of institutions. For each one, please indicate how much you trust that institution to do what is
right. 9-point scale; top 4 box, trust. General population, 11-mkt avg.
95
87 83
70 67 64 60 56
48 48
38
C
hina
India
SaudiA
rabia
C
anada
S.K
orea
G
erm
any
U
.K
.
M
exico
France
U
.S.
Japan
Global 11
l l l l+5 +6 +5 +20 +16 +19 +24 +12 +13 +9 -5
Change,
Jan 2020 to
May 2020
+11
pts
Change, Jan 2020 to May 2020
- 0
+
Distrust Neutral Trust
65TRUST](https://image.slidesharecdn.com/2020edelmantrustbarometerspringupdateglobalreport-200505114352/85/2020-Edelman-Trust-Barometer-Spring-Update-UK-7-320.jpg)


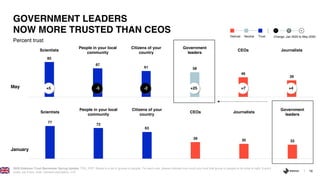
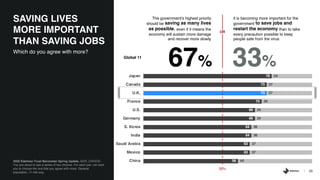


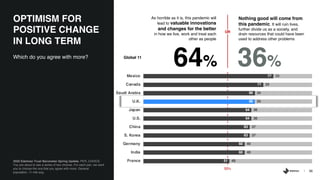


The 2020 Edelman Trust Barometer Spring Update reveals significant increases in trust towards government amid the COVID-19 pandemic, with government emerging as the most trusted institution across various markets. An informed public shows a higher level of trust compared to the general population, reflecting persistent trust inequality. The report emphasizes the need for accurate information and communication about pandemic responses, highlighting societal divides in the effects of the crisis.


