Download as PDF, PPTX


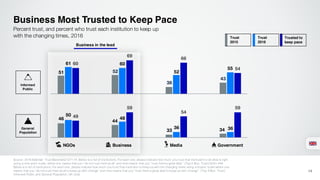
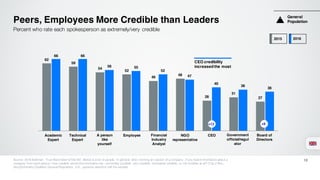
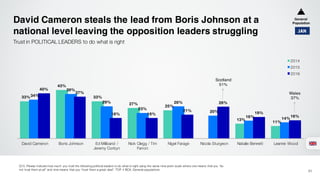
![Better Performance and More Competent Leadership Drives Trust
Amongst Informed Publics
11
Reasons why trust in business has increased in the last year
3%
10%
17%
28%27%
25%
40%
19%
13%
15%
3%
Informed Public Mass
Less corruption or fraud
Increased transparency
Better regulations or control
Better performance or more competent leaders
The right incentives in place
Don’t know
JAN
General
Population
Source: UK Supplement, Which of the following is the main reason why your trust in business [decreased / increased] over the last year?](https://image.slidesharecdn.com/trustbarometer2016-ukdeck-160118144728/85/Edelman-Trust-Barometer-2016-UK-Results-11-320.jpg)
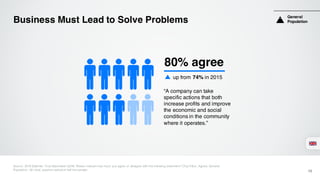
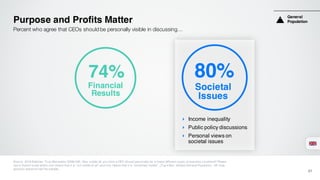
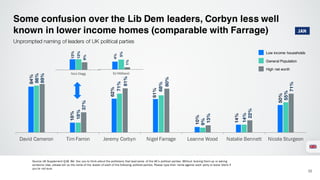
![Corruption, Fraud, and Wrong Incentives Driving Distrust In
Business
12
Reasons why trust in business has decreased in the last year
28% 29%
8%
11%11%
16%
3%
12%
50%
28%
Informed Public Mass
Corruption or fraud
Transparency issues
Lack of regulation or control
Poor performance or incompetence
Wrong incentives driving business decisions (such as too much
focus on bonuses/ compensation)
Don’t know
JAN
General
Population
Source: UK Supplement, Which of the following is the main reason why your trust in business [decreased / increased] over the last year?](https://image.slidesharecdn.com/trustbarometer2016-ukdeck-160118144728/85/Edelman-Trust-Barometer-2016-UK-Results-12-320.jpg)
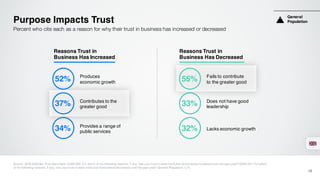

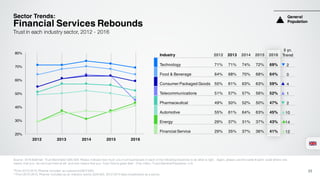
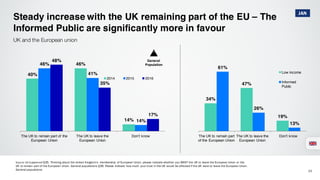
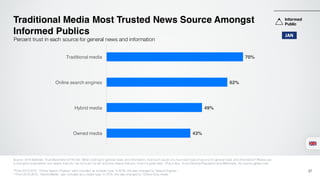
![CEO Focus Misplaced
20
Percent who agree with each statement about CEOs
Focus on short-term
financial results
Lobbying
Too Much
71%
50%
Positive
long-term impact
Job Creation
Not Enough
59%
67%
General
Population
Source: 2016 Edelman Trust Barometer Q451-461. Thinking about CEOs, how strongly do you agree or disagree with the following statements? [‘CEOs do too much lobbying,’ ‘Given that the
average tenure of CEOs is just 4 years, CEOs aren’t in their role long enough to make a positive impact,’ (Top 4 Box, Agree) ‘CEOs are too focused on short-term financial results,’ ‘CEOs can
be trust to create jobs’ ] (Bot 5 Box, Do not agree) General Population, U.K.](https://image.slidesharecdn.com/trustbarometer2016-ukdeck-160118144728/85/Edelman-Trust-Barometer-2016-UK-Results-20-320.jpg)
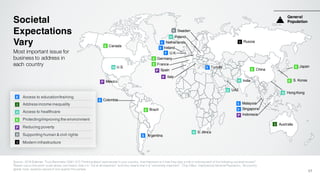
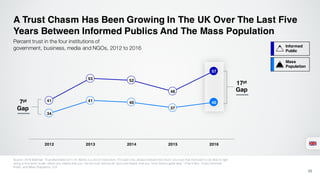
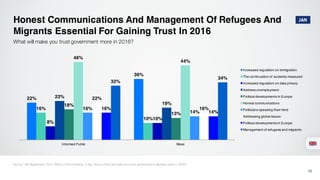
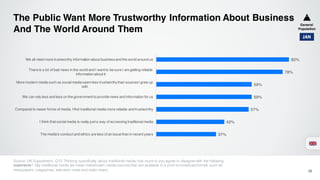
![47%
60%61%
76%
Their education and
how it shaped them
Their personal
success story
The obstacles
they have overcome
Their personal
values
Personal Values and History Matter
Source: 2016 Edelman Trust Barometer Q507-514. Thinking about how a CEO communicates with a variety of groups and individuals, how important are each of the following activities a CEO could engage in? Please use a 9-point scale where one
means that attribute is “not at all important to building your trust” and nine means it is “extremely important to building your trust”. (Top 4 Box, Important) General Population, 28-country global total, question asked of half the sample. [Media
Engagement net = Q507 ‘Interviews with the media,’ and ‘Q512 ‘Sharing their views on a blog or on social media.’ Direct Engagement net = Q508 ‘Communications with employees,’ and ‘Participation in industry conferences.’] Q516-524. For you to
trust a CEO, how important is it that you have information on each of the following aspects of the CEO’s personal life outside of their business? Please use a 9-point scale where one means that attribute is “not at all important to building your trust”
and nine means it is “extremely important to building your trust. (Top 4 Box, Important) General Population, UK total, question asked of half the sample.
Percent who agree that each type of information
is important in building trust in a CEO
via company communications
or conferences is 14% more
important than media
engagement
General
Population
22
Direct Engagement](https://image.slidesharecdn.com/trustbarometer2016-ukdeck-160118144728/85/Edelman-Trust-Barometer-2016-UK-Results-22-320.jpg)


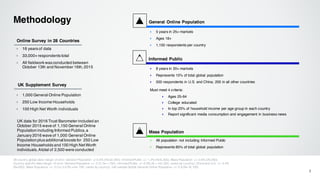
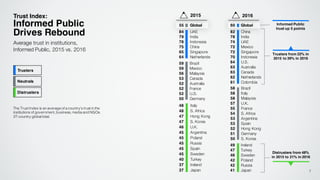
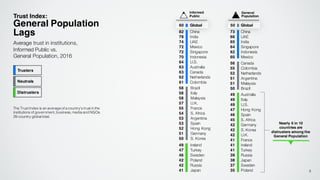
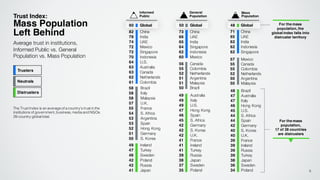
The document provides information about the methodology used for the 2016 Edelman Trust Barometer in the United Kingdom. It details the sample sizes and criteria for the informed public, general online population, and mass population surveys in the UK. It also lists the margin of error for country-specific and global data. The UK supplement survey included additional waves in October 2015 and January 2016 totaling 2,500 respondents.


