Download to read offline

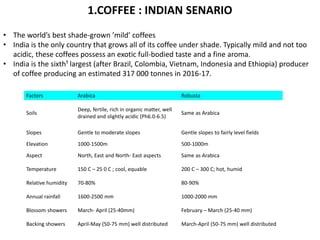
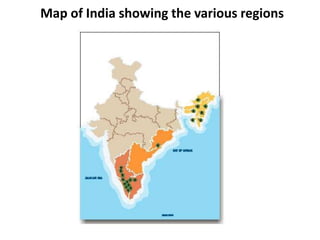
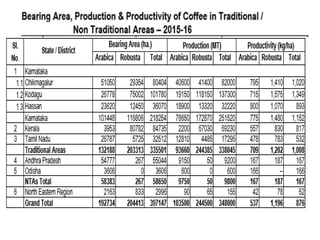
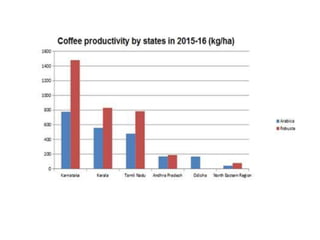
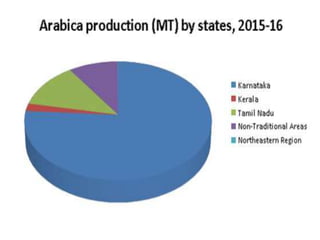
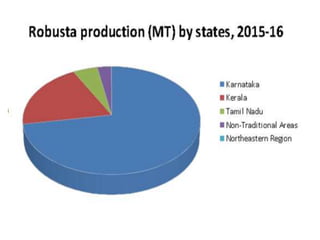
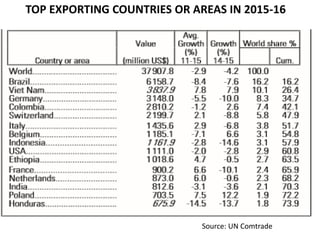
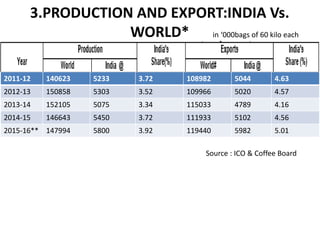
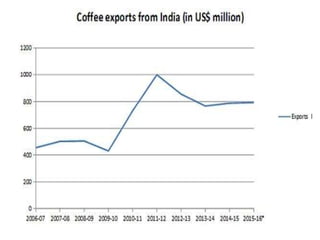
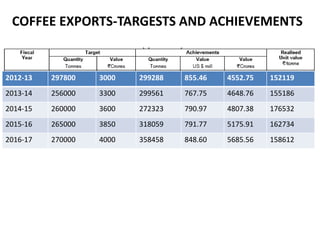
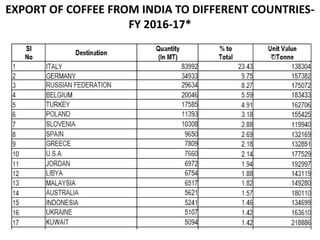
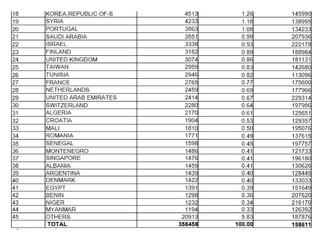
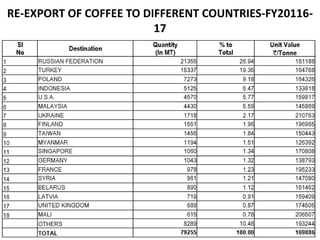
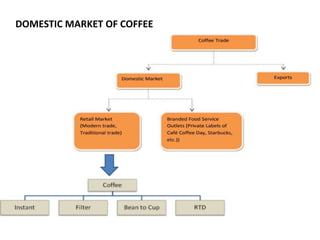
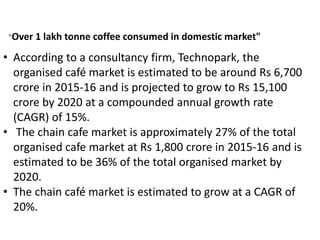
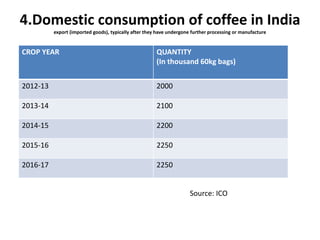
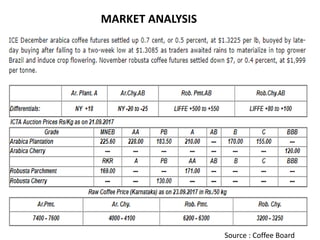


India is the 6th largest producer of coffee in the world, producing around 317,000 tonnes annually. Coffee production is concentrated in the states of Karnataka, Kerala, and Tamil Nadu. India produces mild, shade-grown Arabica and Robusta coffee varieties. While coffee production and exports have increased in recent years, the industry faces challenges such as rising production costs, declining coffee quality, pest infestation, and price fluctuations in the global market. Domestic coffee consumption is also growing and estimated at over 1 lakh tonnes annually.


![SecurityBoat_Service_Pitch_Deck[24158].pdf](https://cdn.slidesharecdn.com/ss_thumbnails/securityboatservicepitchdeck24158-260121113056-452683e3-thumbnail.jpg?width=640&height=640&fit=bounds)


