Presiding Officer Training module 2024 lok sabha elections
Symbols
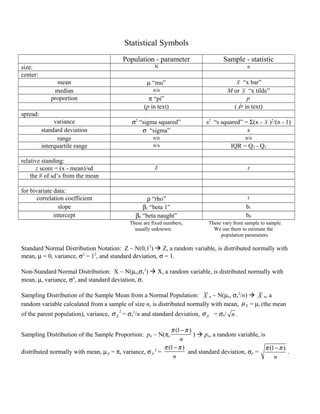
1. Statistical Symbols
Population - parameter Sample - statistic
size: N n
center:
mean µ “mu” x “x bar”
median n/a M or ~x “x tilde”
proportion π “pi” p
(p in text) ( pˆ in text)
spread:
variance σ2
“sigma squared” s2
“s squared” = Σ(x - x )2
/(n - 1)
standard deviation σ “sigma” s
range n/a n/a
interquartile range n/a IQR = Q3 - Q1
relative standing:
z score = (x - mean)/sd Z z
the # of sd’s from the mean
for bivariate data:
correlation coefficient ρ “rho” r
slope β1 “beta 1” b1
intercept β0 “beta naught” b0
These are fixed numbers, These vary from sample to sample.
usually unknown. We use them to estimate the
population parameters.
Standard Normal Distribution Notation: Z ~ N(0,12
) Z, a random variable, is distributed normally with
mean, µ = 0, variance, σ2
= 12
, and standard deviation, σ = 1.
Non-Standard Normal Distribution: X ~ N(µx,σx
2
) X, a random variable, is distributed normally with
mean, µ, variance, σ2
, and standard deviation, σ.
Sampling Distribution of the Sample Mean from a Normal Population: X n ~ N(µx, σx
2
/n) X n, a
random variable calculated from a sample of size n, is distributed normally with mean, X
µ = µx (the mean
of the parent population), variance,
2
X
σ = σx
2
/n and standard deviation, X
σ = σx/ n .
Sampling Distribution of the Sample Proportion: pn ~ N(π,
(1 )
n
π π−
) pn, a random variable, is
distributed normally with mean, µp = π, variance, σp
2
=
(1 )
n
π π−
and standard deviation, σp =
(1 )
n
π π−
.