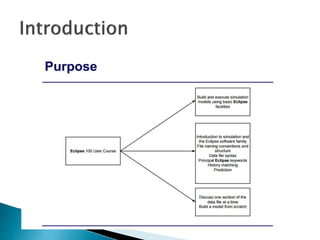
This document contains information from a reservoir simulation project. It includes:
1. Names of team members and thanks to the project supervisor.
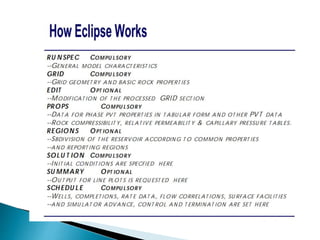
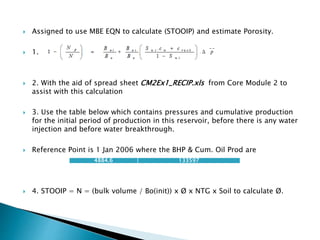
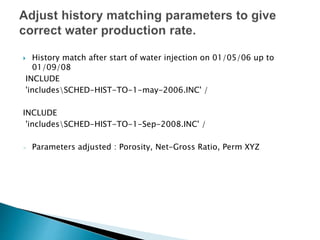
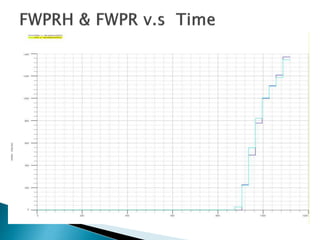
2. An assignment to calculate the original oil in place (OOIP) using material balance and estimate porosity, and match the water production rate in the history.
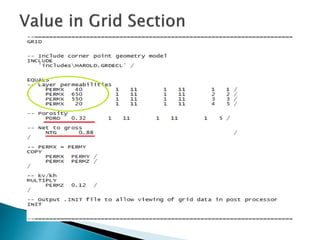
3. Details of the reservoir data, equations, and spreadsheets used to calculate OOIP and porosity.
4. Comments that the model achieved a good history match for wellhead pressure and oil rate and that changes made to parameters like porosity and permeability were reasonable.

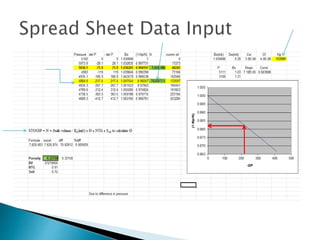
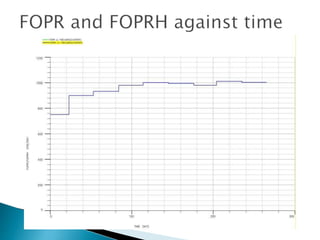
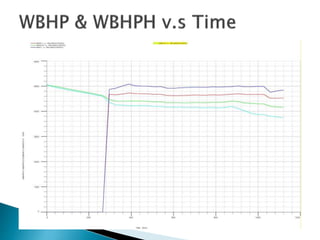
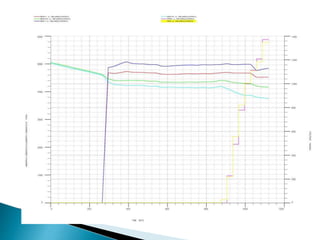
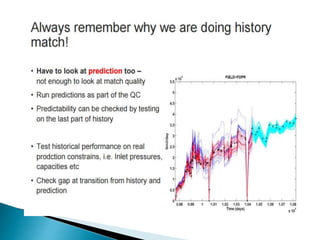
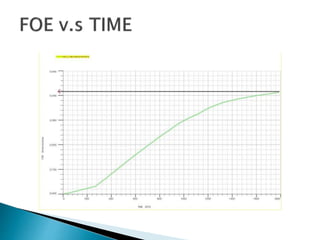
![ According to previous data, it has shown a
good match on the model.
Usually we determine a good match from
matching individual well RFT pressure,
individual well gas/oil ratio, water-cut and
shut-in pressure and avg Reservoir pressure
In Harold Case, we are able to match WBHP &
FOPR [ Line overlapping ]
With % diff only 0.000929](https://image.slidesharecdn.com/eclipsereservoirsimulationprojectpresentationslides-teamucsi-160731080456/85/Eclipse-reservoir-simulation-project-presentation-slides-team-ucsi-14-320.jpg)
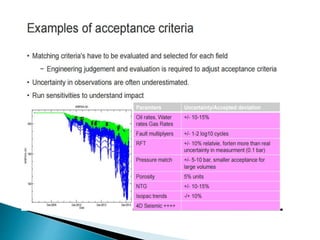
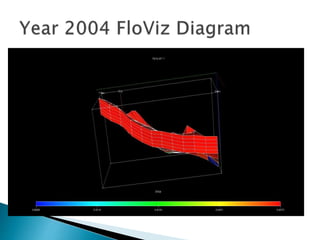
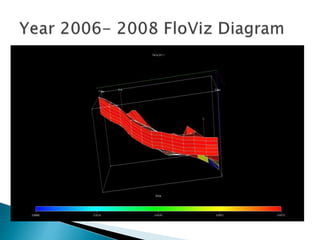
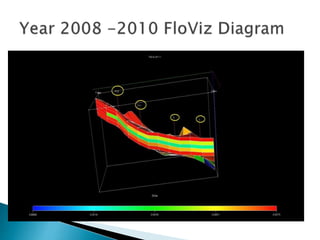
![ Several ways to decide if a match is satisfactory. If a
coarse study is being performed, the quality of the
match between observed and simulated parameters
does not need to be as accurate as it would be for a
more detailed study.
If the model has a good match but the changes made
were not realistic, then the model results should be
viewed with skepticism.
[ Changes in Harold case are reasonable ]
Ultimate objective of reservoir simulation is not
achieving a history match; it is being able to
reasonably predict the future performance of the
reservoir. The history match is only an intermediate
step in the modeling process.](https://image.slidesharecdn.com/eclipsereservoirsimulationprojectpresentationslides-teamucsi-160731080456/85/Eclipse-reservoir-simulation-project-presentation-slides-team-ucsi-15-320.jpg)


![[Deck] What's New in Spark-Iceberg Integration via DSV2.pptx](https://cdn.slidesharecdn.com/ss_thumbnails/deckwhatsnewinspark-icebergintegrationviadsv2-260210005337-25955b12-thumbnail.jpg?width=640&height=640&fit=bounds)


