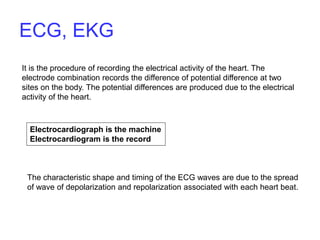
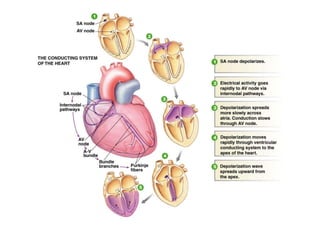
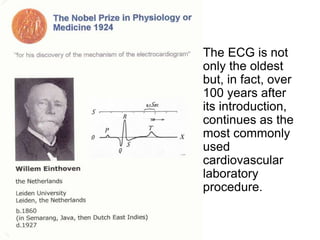
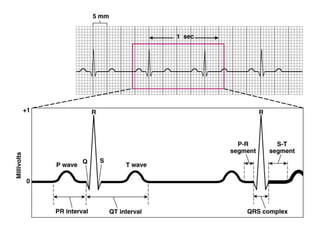
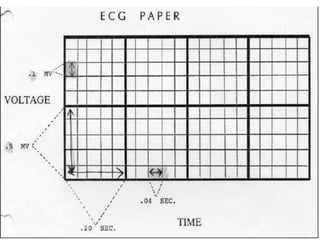
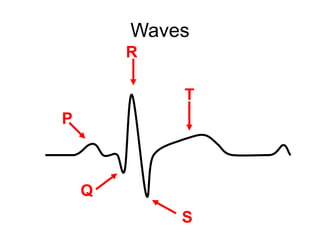
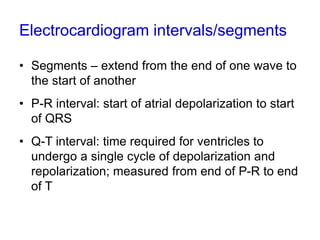
Electrocardiography
Specific learning objectives
• Introduction
• History
• Normal ECG
• Procedure
• Limb Leads
It is the procedure of recording the electrical activity of the heart. The
electrode combination records the difference of potential difference at two
sites on the body. The potential differences are produced due to the electrical
activity of the heart.
Electrocardiograph is the machine
Electrocardiogram is the record
The characteristic shape and timing of the ECG waves are due to the spread
of wave of depolarization and repolarization associated with each heart beat.
ECG, EKG
• The ECG is not
only the oldest
but, in fact, over
100 years after
its introduction,
continues as the
most commonly
used
cardiovascular
laboratory
procedure.
What does the ECG look like?
Waves
P
Q
R
S
T
Electrocardiogram waves
• P-wave – depolarization of atria
– Atria begin contracting about 25msec after the start of
the p-wave
• QRS-complex – ventricular depolarization
– Ventricles begin contracting shortly after the peak of
the R wave
• T-wave – ventricular repolarization
Electrocardiogram intervals/segments
• Segments – extend from the end of one wave to
the start of another
• P-R interval: start of atrial depolarization to start
of QRS
• Q-T interval: time required for ventricles to
undergo a single cycle of depolarization and
repolarization; measured from end of P-R to end
of T
Thank You

ECG ppt.ppt

  • 1.
  • 2.
    Specific learning objectives •Introduction • History • Normal ECG • Procedure • Limb Leads
  • 3.
    It is theprocedure of recording the electrical activity of the heart. The electrode combination records the difference of potential difference at two sites on the body. The potential differences are produced due to the electrical activity of the heart. Electrocardiograph is the machine Electrocardiogram is the record The characteristic shape and timing of the ECG waves are due to the spread of wave of depolarization and repolarization associated with each heart beat. ECG, EKG
  • 5.
    • The ECGis not only the oldest but, in fact, over 100 years after its introduction, continues as the most commonly used cardiovascular laboratory procedure.
  • 6.
    What does theECG look like?
  • 9.
  • 10.
    Electrocardiogram waves • P-wave– depolarization of atria – Atria begin contracting about 25msec after the start of the p-wave • QRS-complex – ventricular depolarization – Ventricles begin contracting shortly after the peak of the R wave • T-wave – ventricular repolarization
  • 11.
    Electrocardiogram intervals/segments • Segments– extend from the end of one wave to the start of another • P-R interval: start of atrial depolarization to start of QRS • Q-T interval: time required for ventricles to undergo a single cycle of depolarization and repolarization; measured from end of P-R to end of T
  • 12.