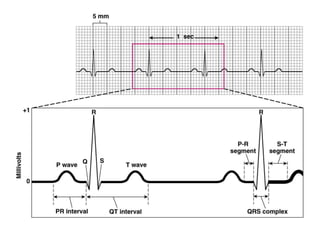
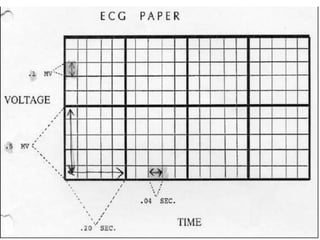
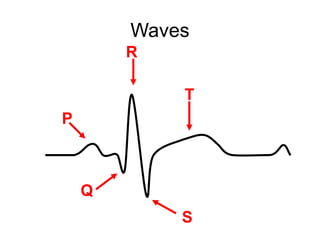
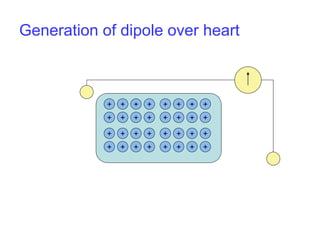
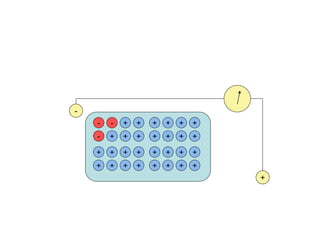
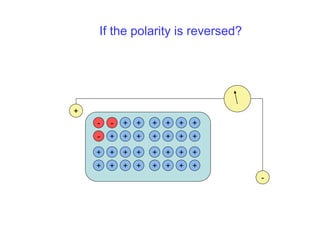
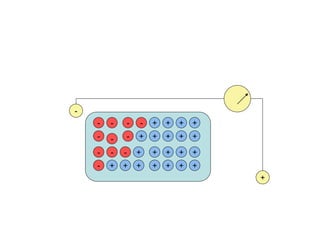
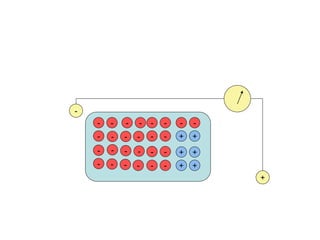
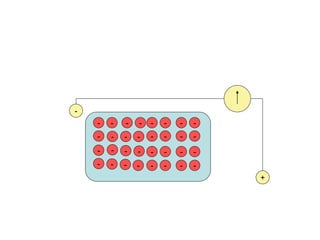
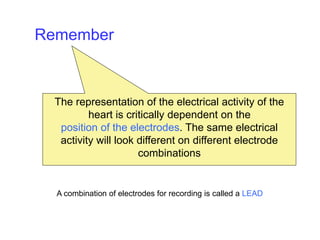
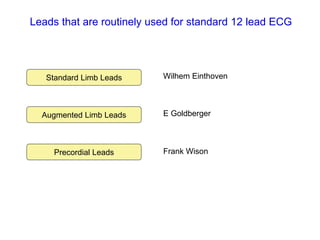
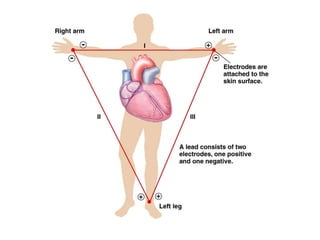
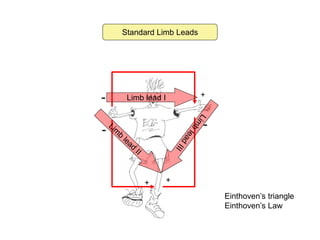
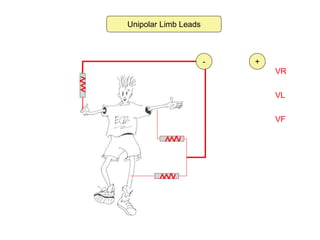
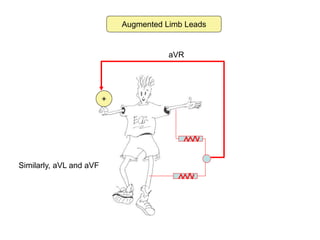
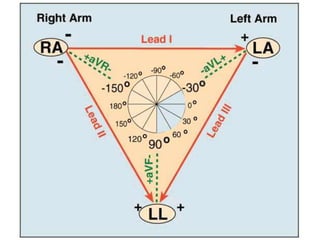
Electrocardiography
Dr. Arun Goel
Associate professor
Department of Physiology
Specific learning objectives
• Introduction
• History
• Normal ECG
• Procedure
• Limb Leads
It is the procedure of recording the electrical activity of the heart. The
electrode combination records the difference of potential difference at two
sites on the body. The potential differences are produced due to the electrical
activity of the heart.
Electrocardiograph is the machine
Electrocardiogram is the record
The characteristic shape and timing of the ECG waves are due to the spread
of wave of depolarization and repolarization associated with each heart beat.
ECG, EKG
• The ECG is not
only the oldest
but, in fact, over
100 years after
its introduction,
continues as the
most commonly
used
cardiovascular
laboratory
procedure.
What does the ECG look like?
Waves
P
Q
R
S
T
Electrocardiogram waves
• P-wave – depolarization of atria
– Atria begin contracting about 25msec after the start of
the p-wave
• QRS-complex – ventricular depolarization
– Ventricles begin contracting shortly after the peak of
the R wave
• T-wave – ventricular repolarization
Electrocardiogram intervals/segments
• Segments – extend from the end of one wave to
the start of another
• P-R interval: start of atrial depolarization to start
of QRS
• Q-T interval: time required for ventricles to
undergo a single cycle of depolarization and
repolarization; measured from end of P-R to end
of T
Instantaneous potentials developed
on the surface of a cardiac muscle mass
Recording depolarization
and repolarization waves
Flow of current in the chest around
partially depolarized ventricles
+ + + + + + + +
+ + + + + + + +
+ + + + + + + +
+ + + + + + + +
Generation of dipole over heart
+ + + + + +
+ + + + + + +
+ + + + + + + +
+ + + + + + + +
-
+
-
-
-
+ + + + + +
+ + + + + + +
+ + + + + + + +
+ + + + + + + +
+
-
-
-
-
If the polarity is reversed?
+ + + +
+ + + + +
+ + + + +
+ + + + + + +
-
+
-
-
-
-
-
-
-
-
-
-
-
+ +
+ +
+ +
-
+
-
-
-
-
-
-
-
-
-
-
-
-
-
-
-
-
-
-
-
- -
-
-
-
-
-
-
+
-
-
-
-
-
-
-
-
-
-
-
-
-
-
-
-
-
-
-
- -
-
-
-
-
-
-
-
-
-
-
-
The representation of the electrical activity of the
heart is critically dependent on the
position of the electrodes. The same electrical
activity will look different on different electrode
combinations
Remember
A combination of electrodes for recording is called a LEAD
Leads that are routinely used for standard 12 lead ECG
Standard Limb Leads
Augmented Limb Leads
Precordial Leads
Wilhem Einthoven
E Goldberger
Frank Wison
Standard Limb Leads
- +
Limb lead I
-
+ +
-
Einthoven’s triangle
Einthoven’s Law
Unipolar Limb Leads
VR
VL
VF
- +
Augmented Limb Leads
+
aVR
Similarly, aVL and aVF
Augmented lead is 1.5 X unipolar lead
aVL = VL – (VR + VF) /2
2 aVL = 2 VL – (VR + VF)
VL + VR + VF = 0
VL = - ( VR + VF)
2 aVL = 2VL + VL
aVL = 3/2 VL
Thank You

348_ecg_1.ppt

  • 1.
    Electrocardiography Dr. Arun Goel Associateprofessor Department of Physiology
  • 2.
    Specific learning objectives •Introduction • History • Normal ECG • Procedure • Limb Leads
  • 3.
    It is theprocedure of recording the electrical activity of the heart. The electrode combination records the difference of potential difference at two sites on the body. The potential differences are produced due to the electrical activity of the heart. Electrocardiograph is the machine Electrocardiogram is the record The characteristic shape and timing of the ECG waves are due to the spread of wave of depolarization and repolarization associated with each heart beat. ECG, EKG
  • 5.
    • The ECGis not only the oldest but, in fact, over 100 years after its introduction, continues as the most commonly used cardiovascular laboratory procedure.
  • 6.
    What does theECG look like?
  • 9.
  • 10.
    Electrocardiogram waves • P-wave– depolarization of atria – Atria begin contracting about 25msec after the start of the p-wave • QRS-complex – ventricular depolarization – Ventricles begin contracting shortly after the peak of the R wave • T-wave – ventricular repolarization
  • 11.
    Electrocardiogram intervals/segments • Segments– extend from the end of one wave to the start of another • P-R interval: start of atrial depolarization to start of QRS • Q-T interval: time required for ventricles to undergo a single cycle of depolarization and repolarization; measured from end of P-R to end of T
  • 12.
    Instantaneous potentials developed onthe surface of a cardiac muscle mass
  • 13.
  • 14.
    Flow of currentin the chest around partially depolarized ventricles
  • 15.
    + + ++ + + + + + + + + + + + + + + + + + + + + + + + + + + + + Generation of dipole over heart
  • 16.
    + + ++ + + + + + + + + + + + + + + + + + + + + + + + + + - + - - -
  • 17.
    + + ++ + + + + + + + + + + + + + + + + + + + + + + + + + + - - - - If the polarity is reversed?
  • 18.
    + + ++ + + + + + + + + + + + + + + + + + - + - - - - - - - - - - -
  • 19.
    + + + + ++ - + - - - - - - - - - - - - - - - - - - - - - - - - - -
  • 20.
  • 21.
    The representation ofthe electrical activity of the heart is critically dependent on the position of the electrodes. The same electrical activity will look different on different electrode combinations Remember A combination of electrodes for recording is called a LEAD
  • 22.
    Leads that areroutinely used for standard 12 lead ECG Standard Limb Leads Augmented Limb Leads Precordial Leads Wilhem Einthoven E Goldberger Frank Wison
  • 24.
    Standard Limb Leads -+ Limb lead I - + + - Einthoven’s triangle Einthoven’s Law
  • 25.
  • 26.
  • 27.
    Augmented lead is1.5 X unipolar lead aVL = VL – (VR + VF) /2 2 aVL = 2 VL – (VR + VF) VL + VR + VF = 0 VL = - ( VR + VF) 2 aVL = 2VL + VL aVL = 3/2 VL
  • 29.