Download to read offline

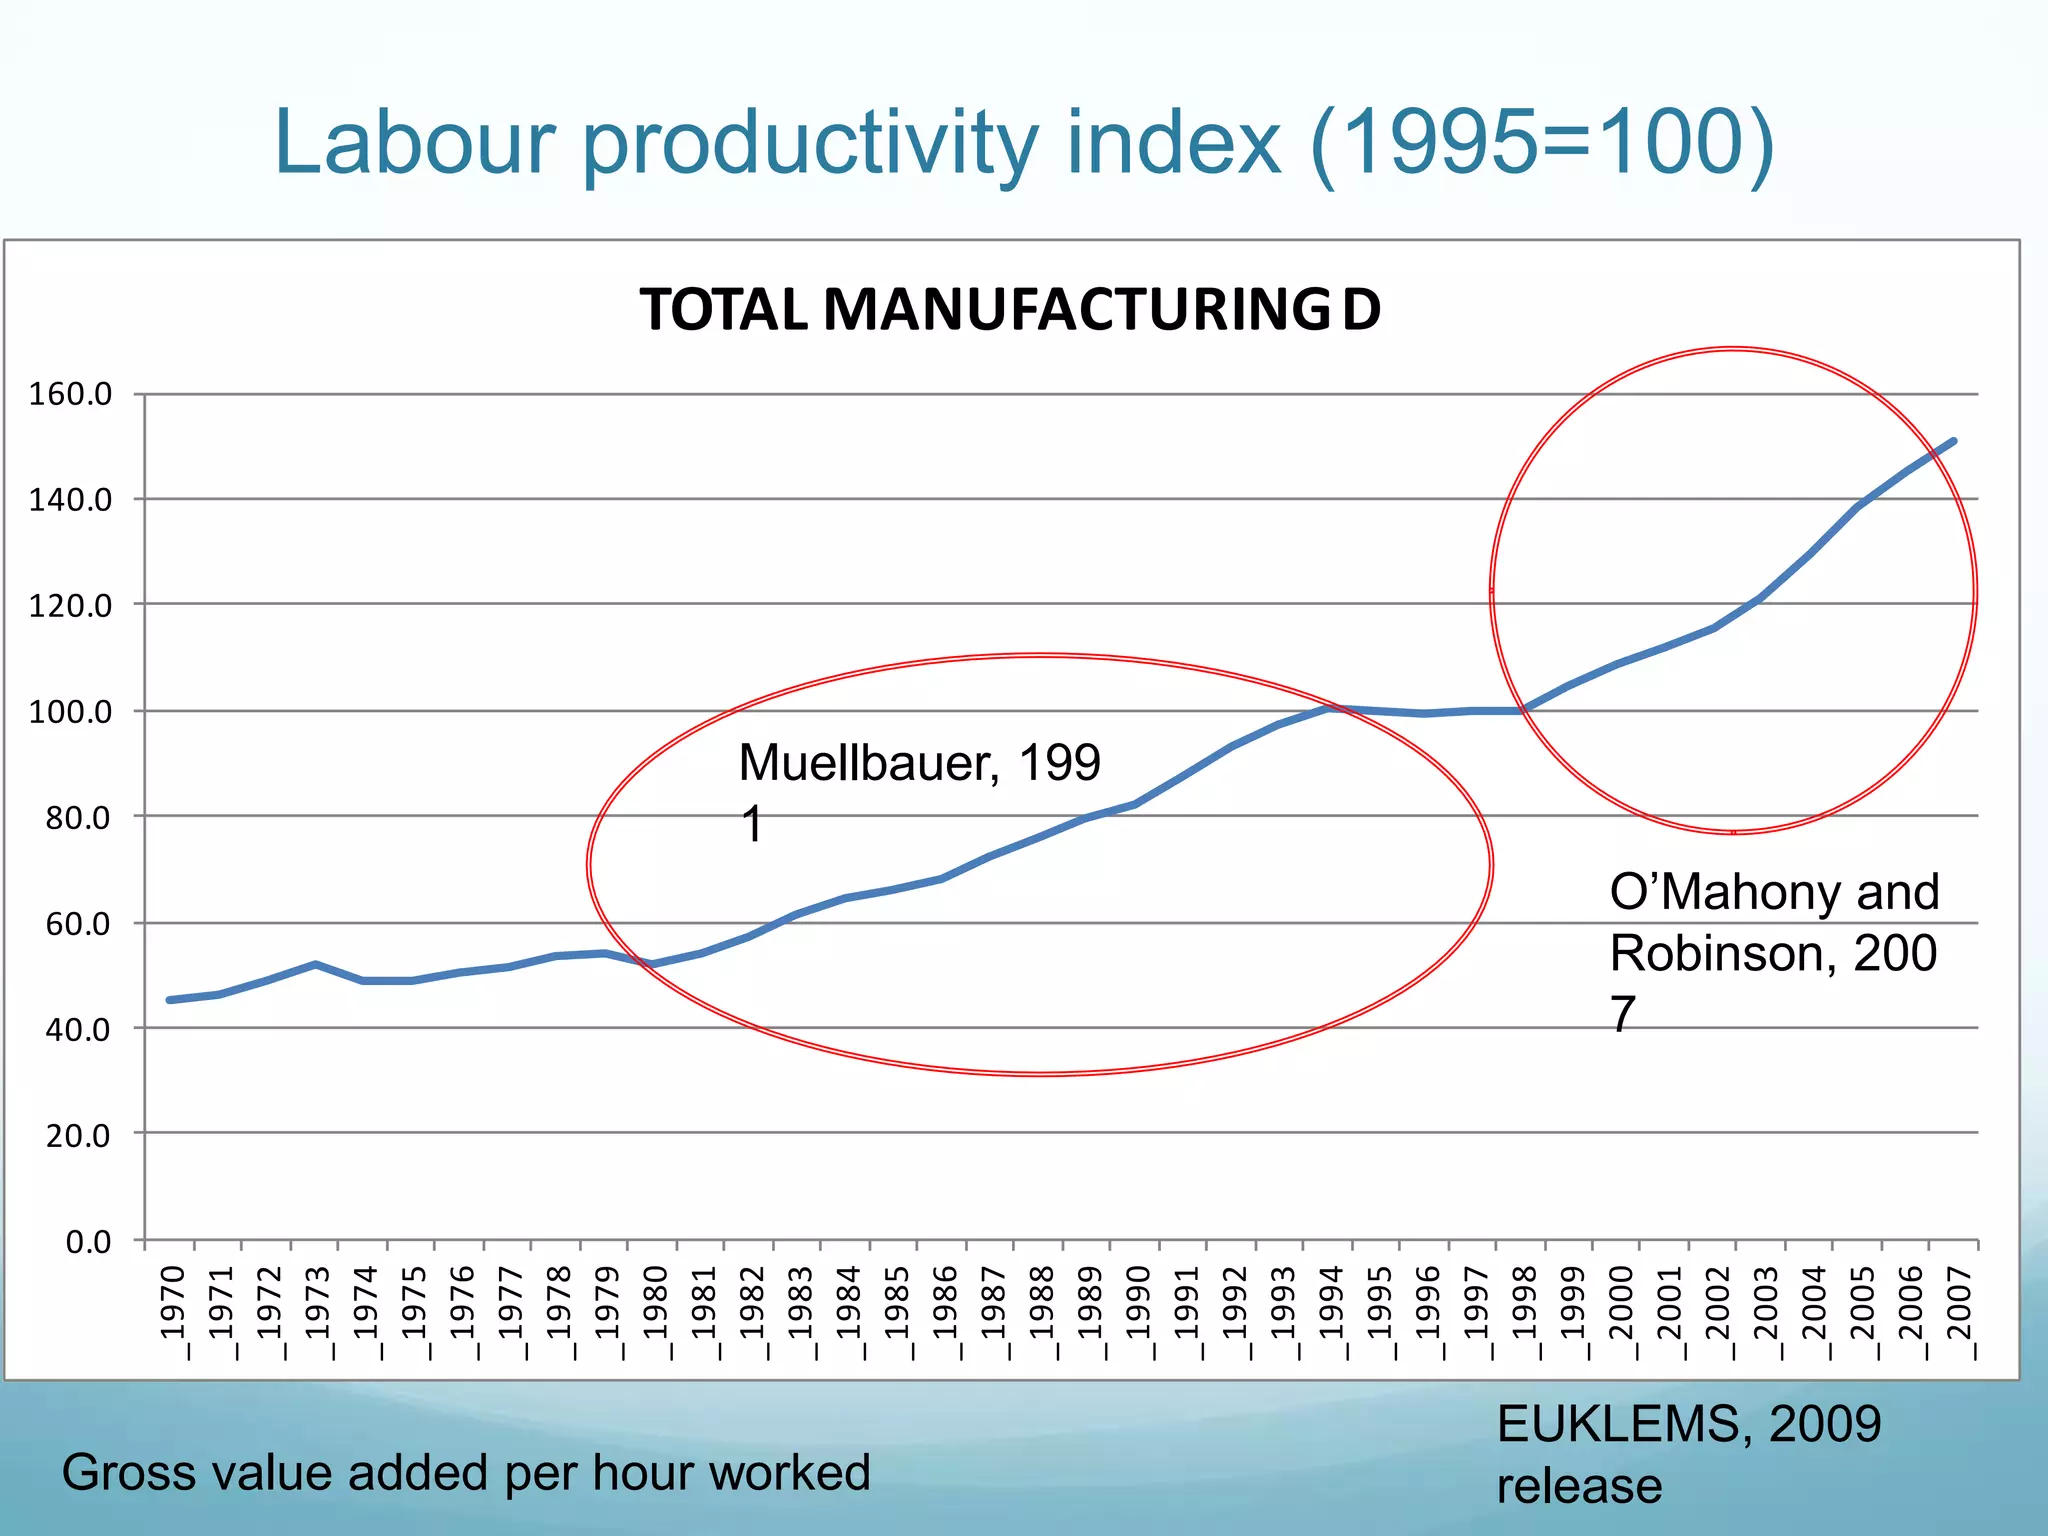
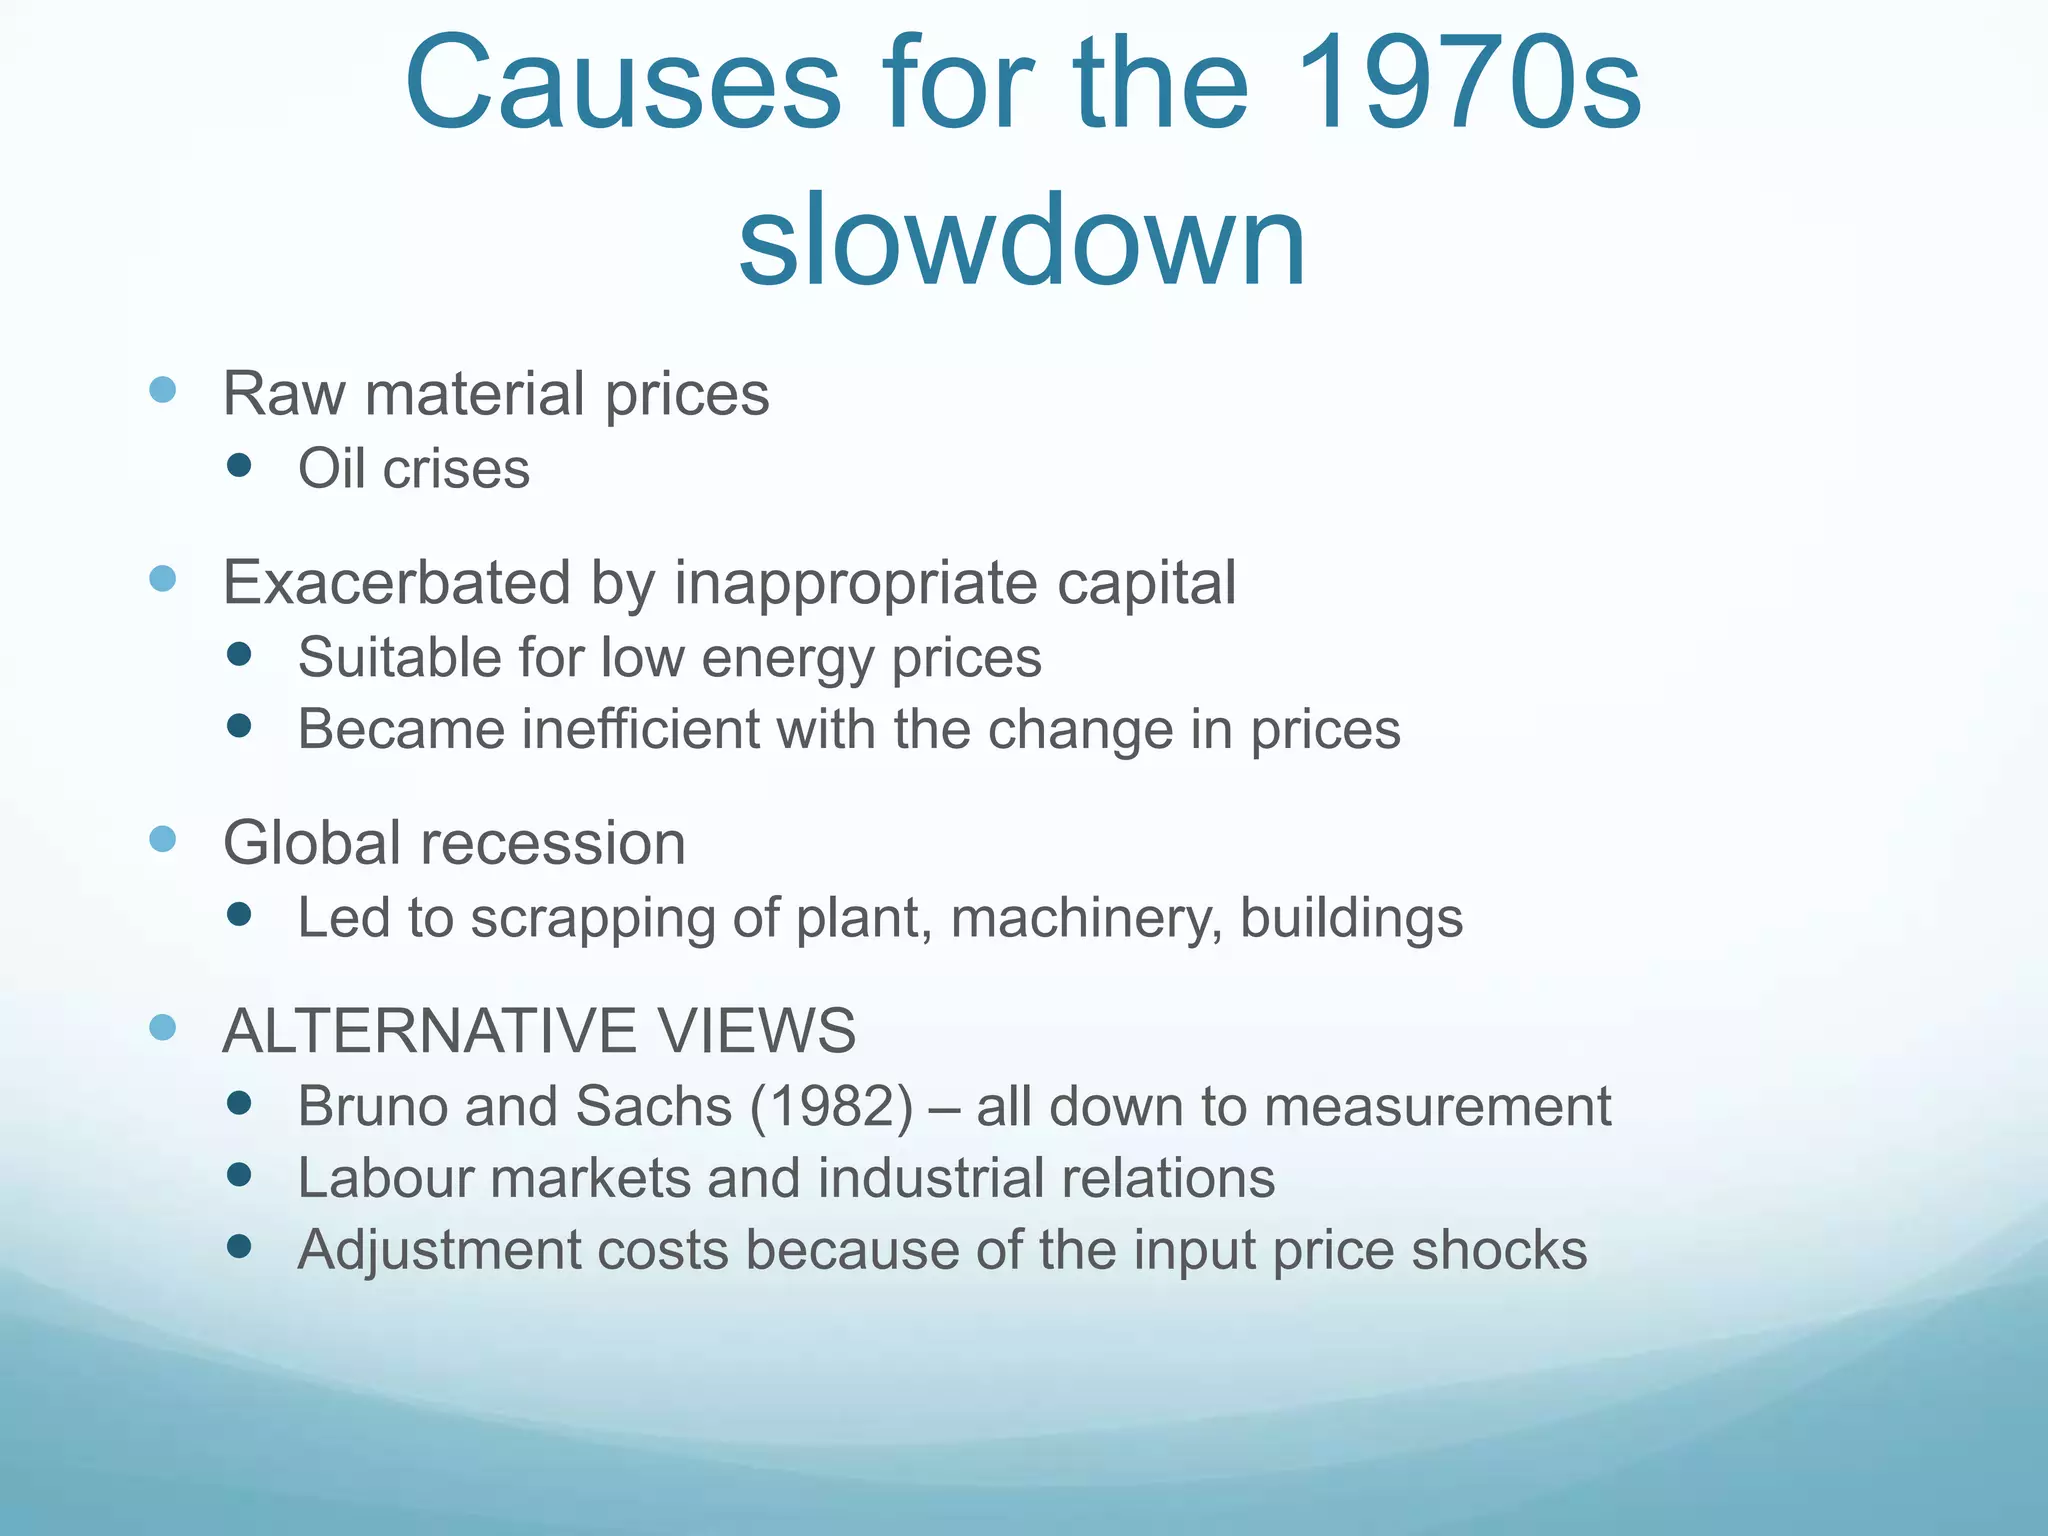
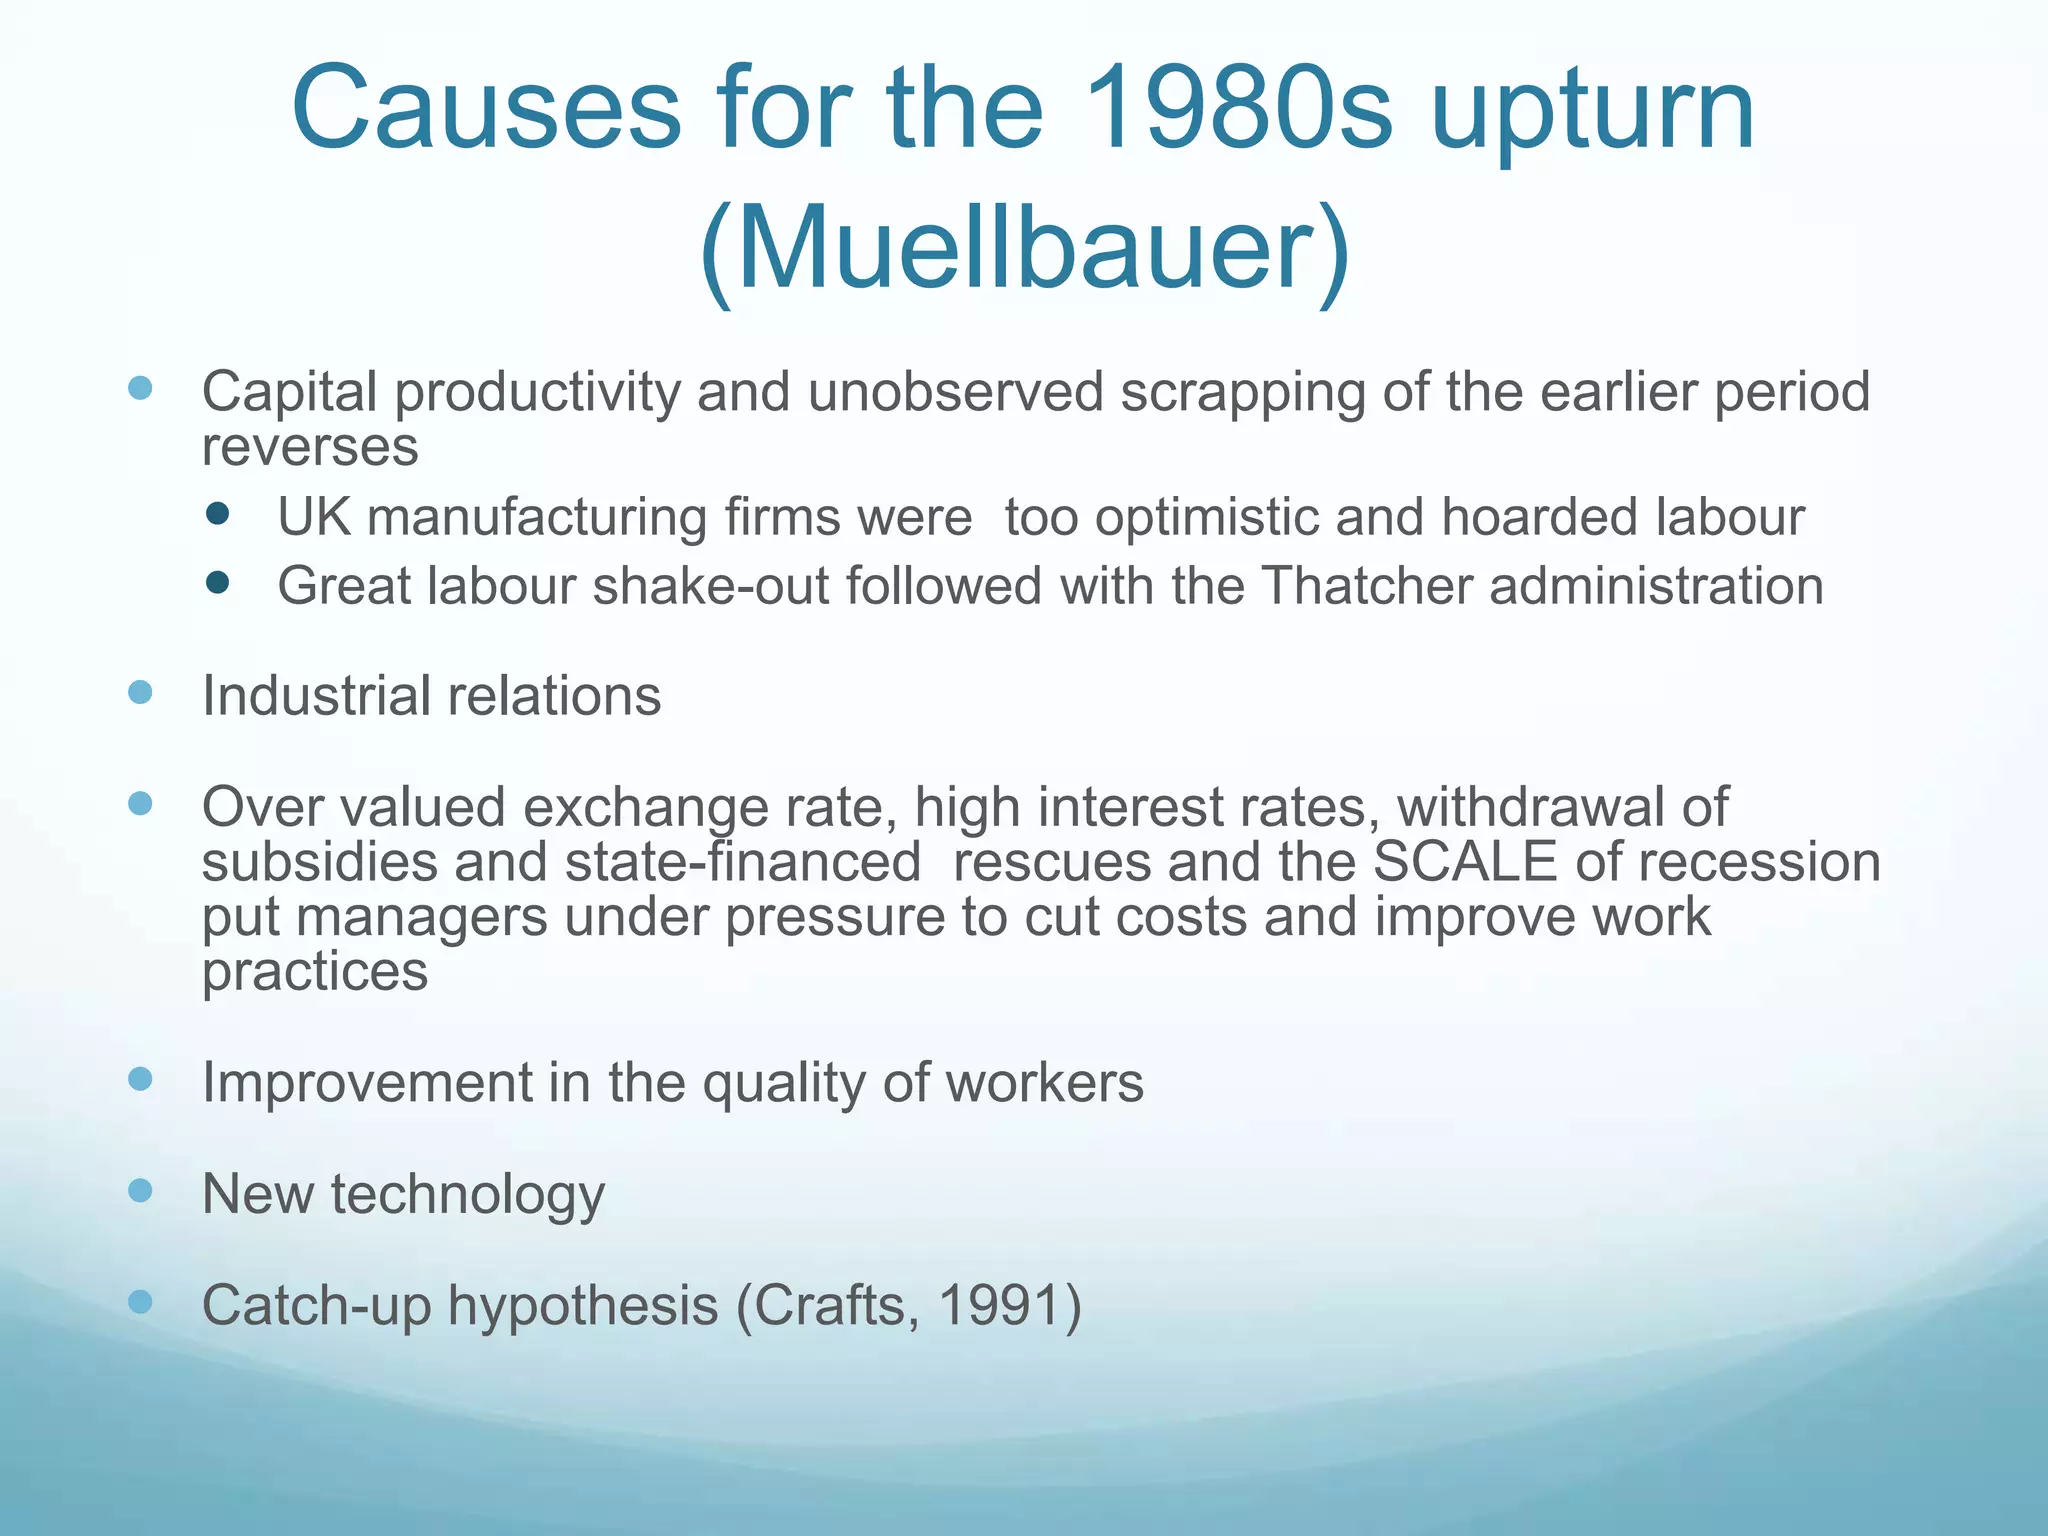

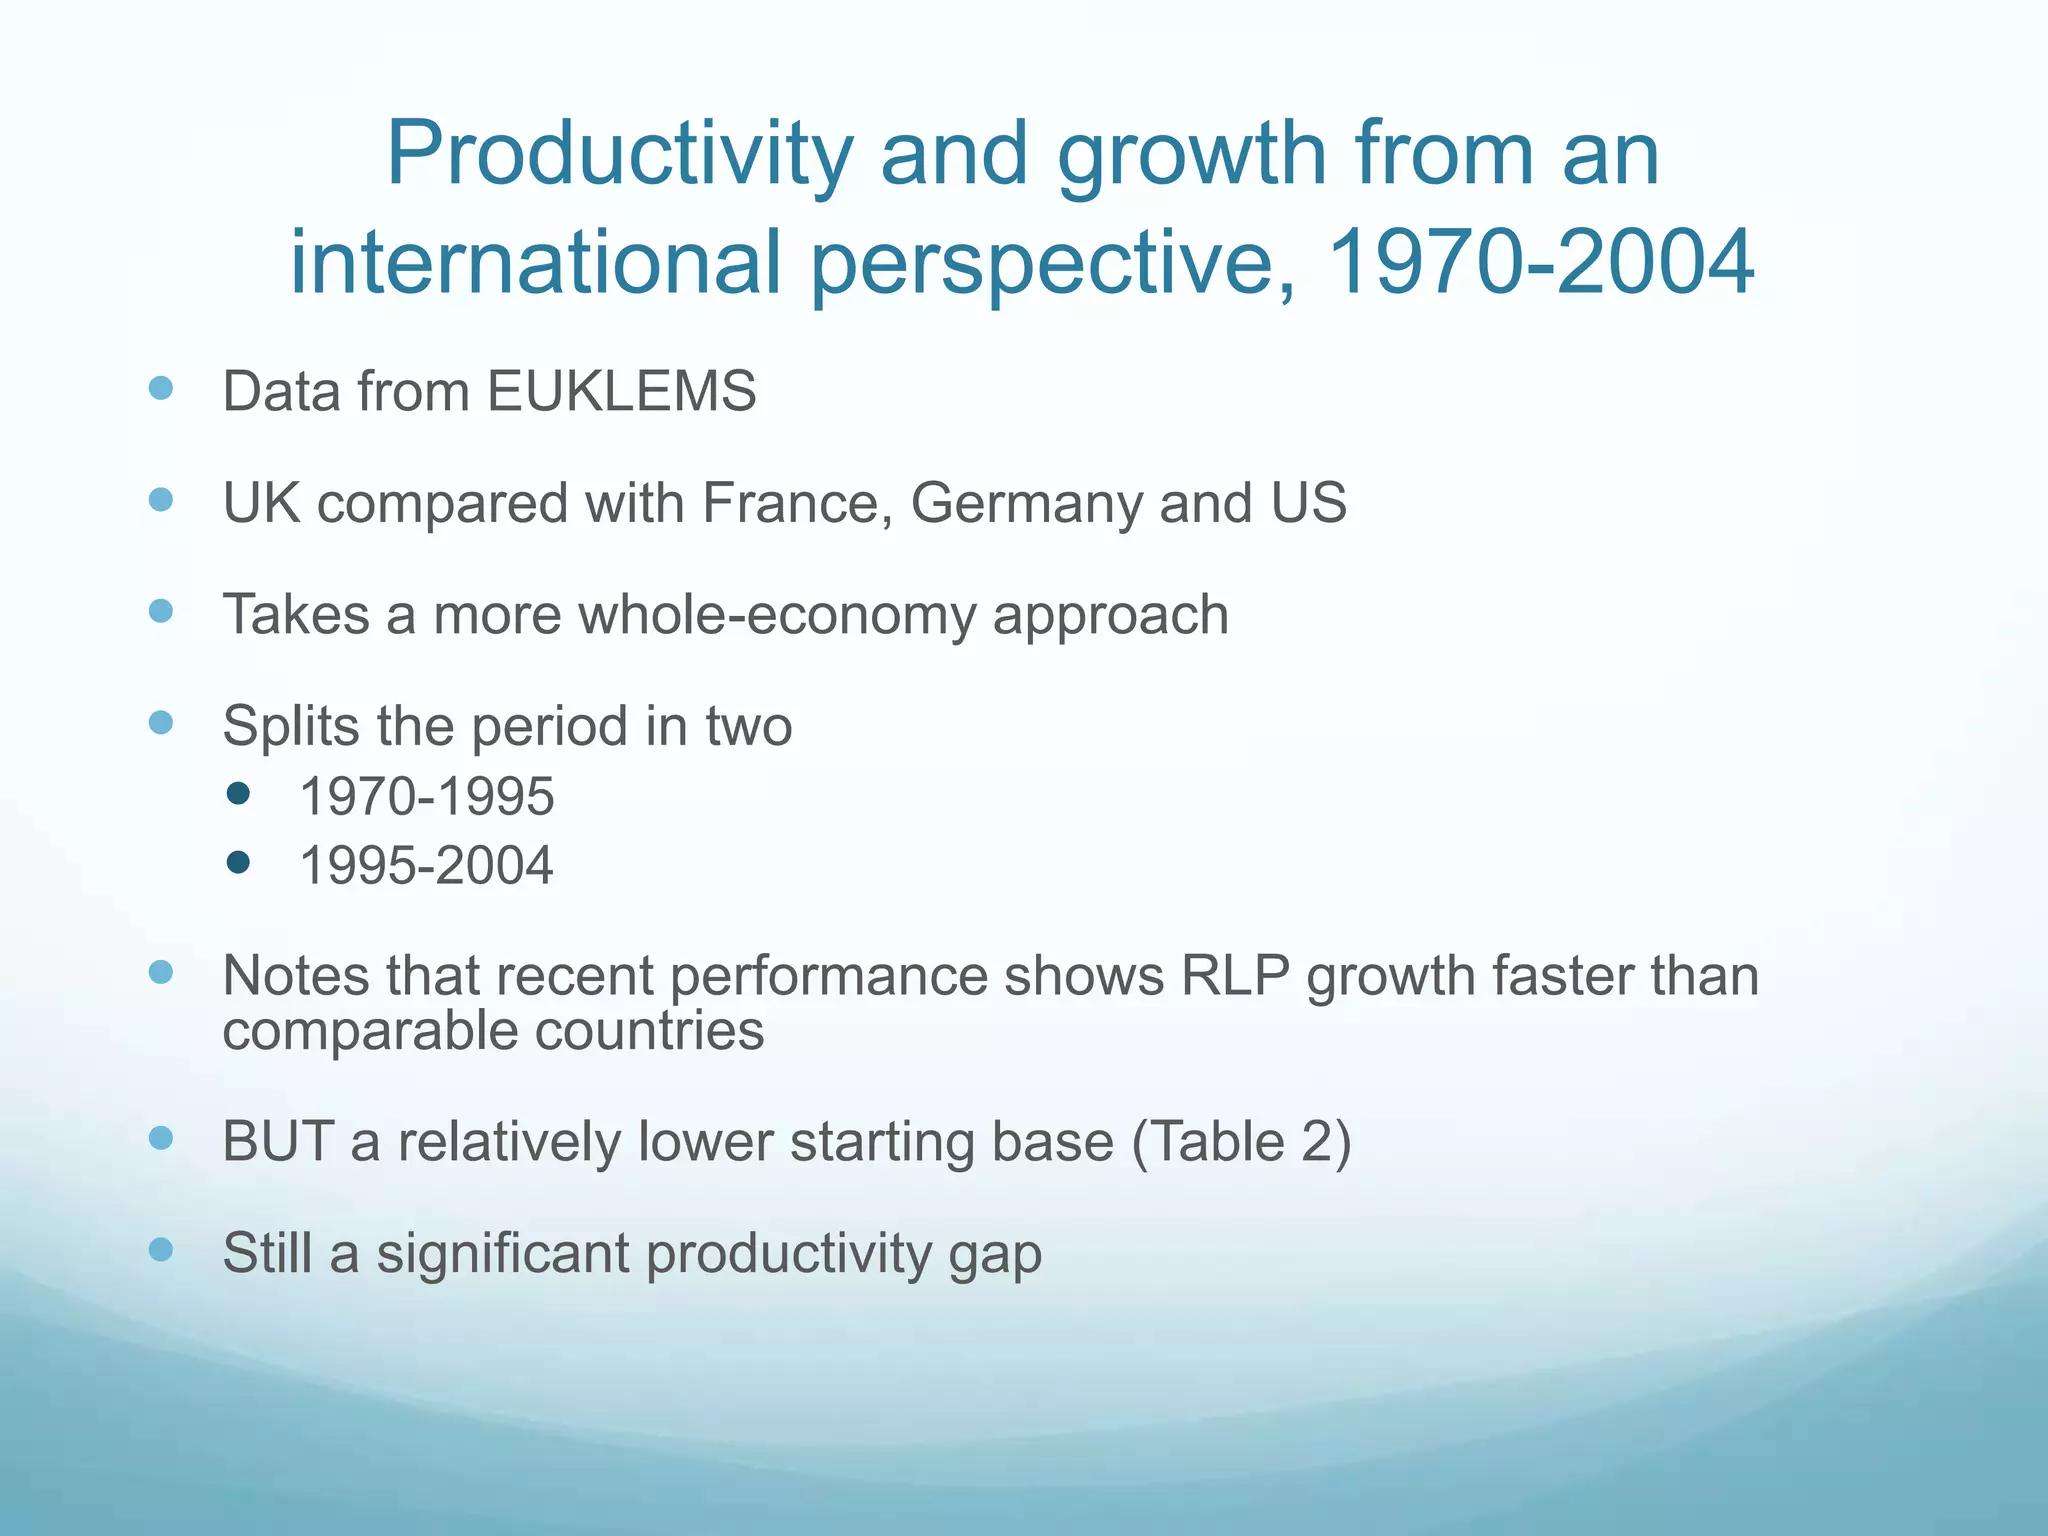
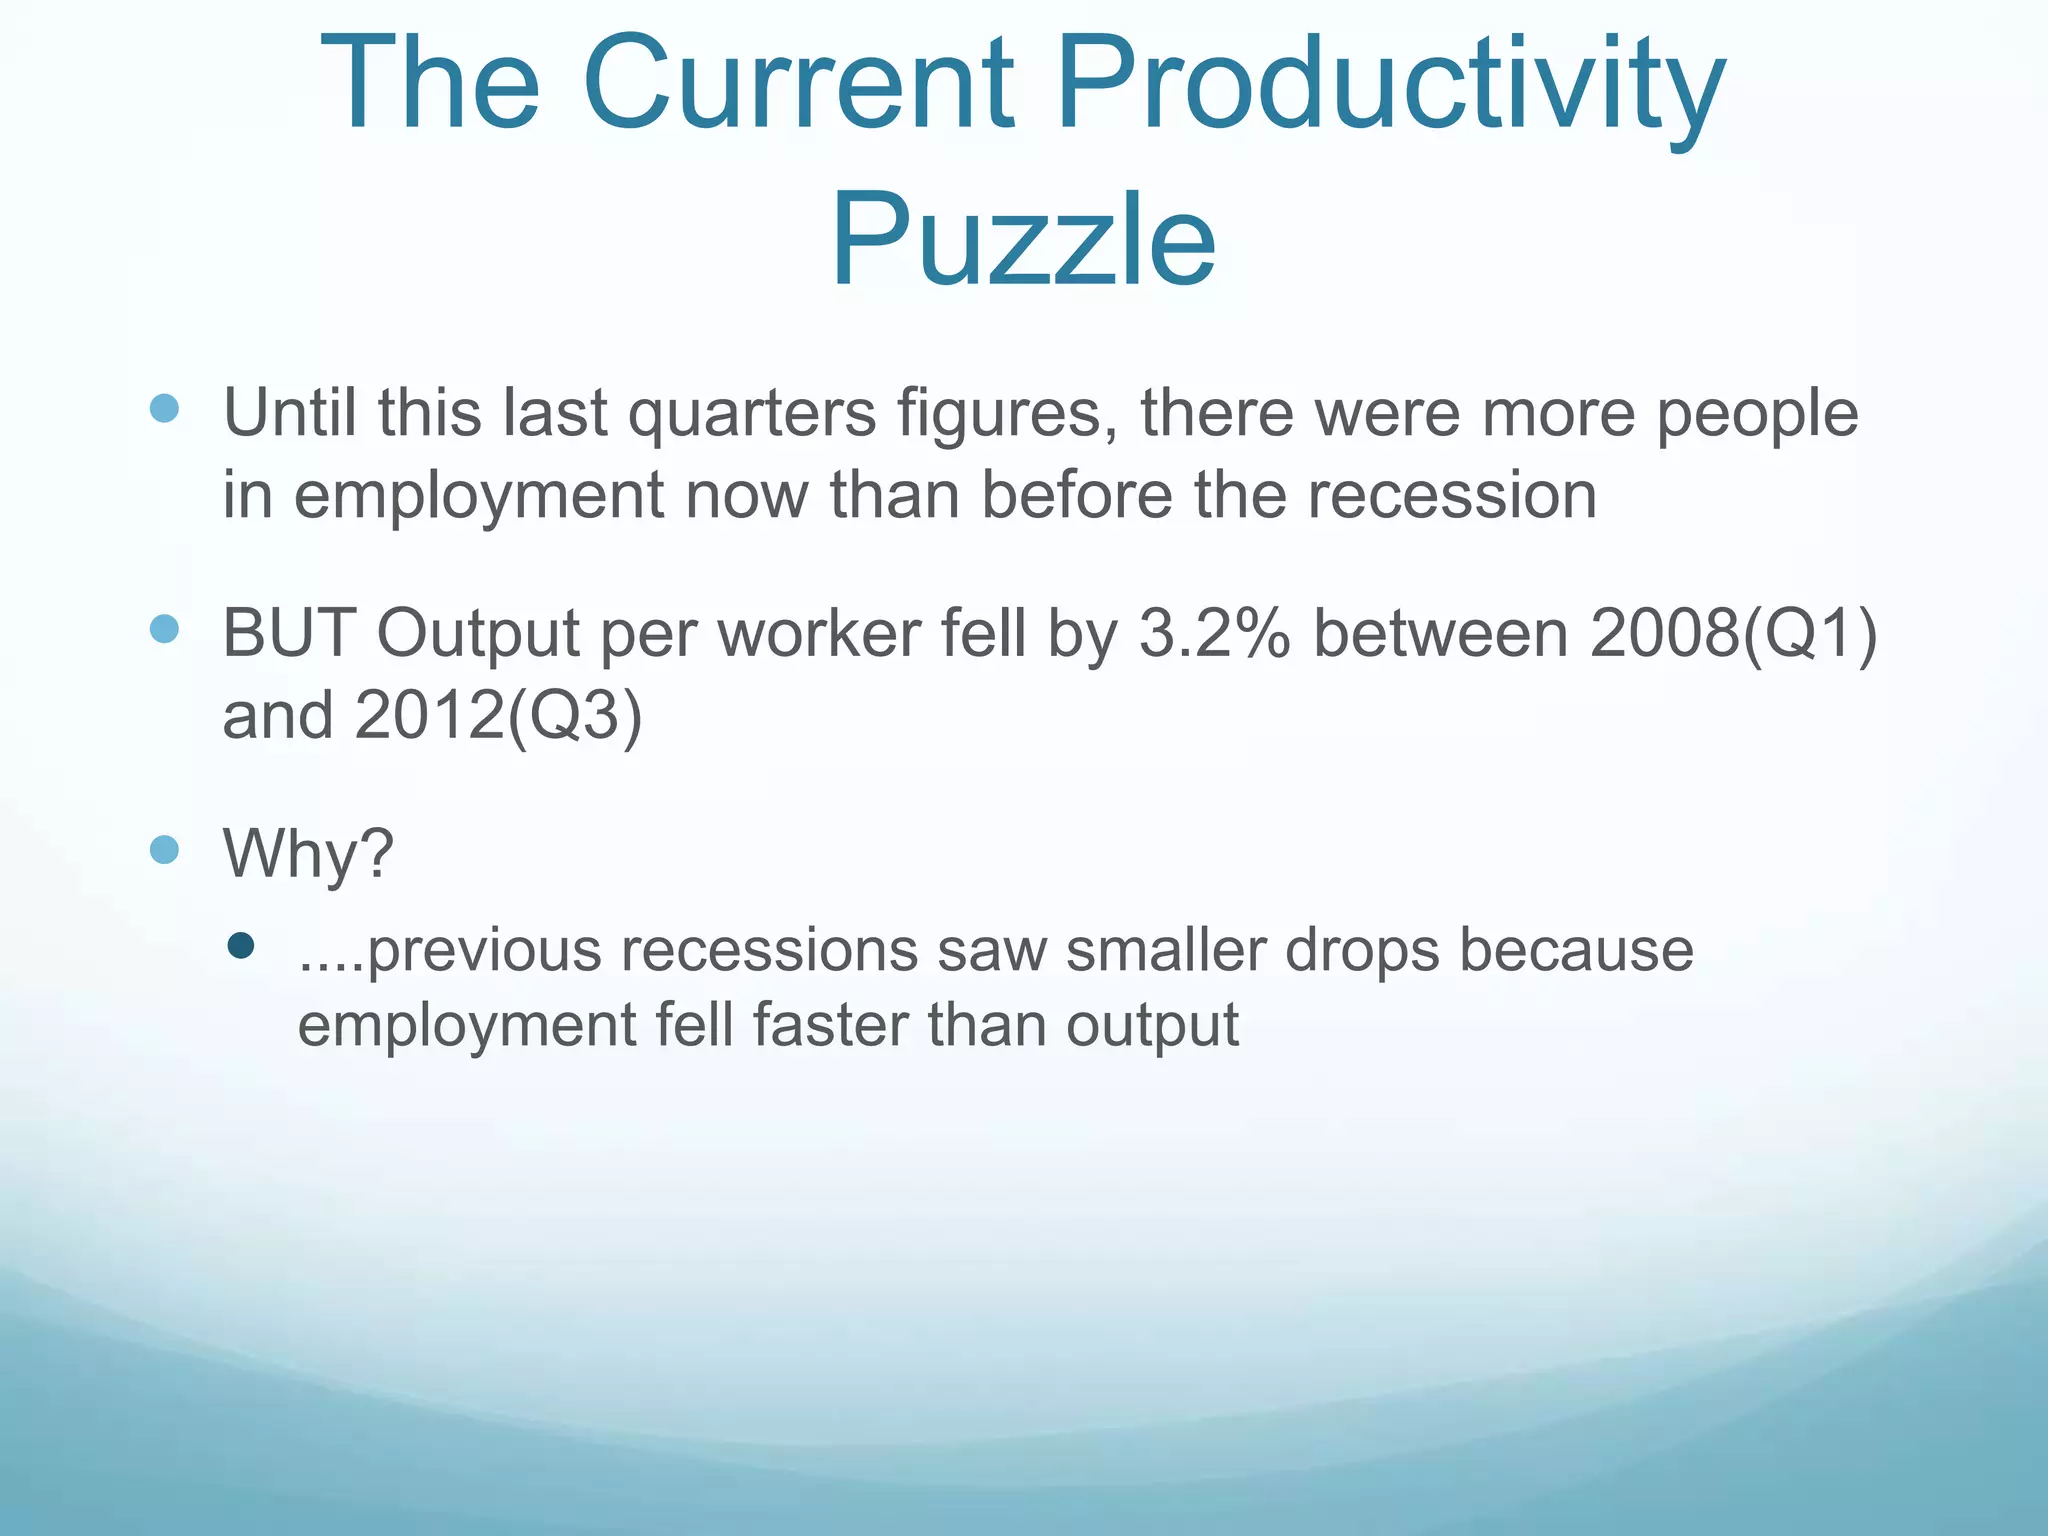
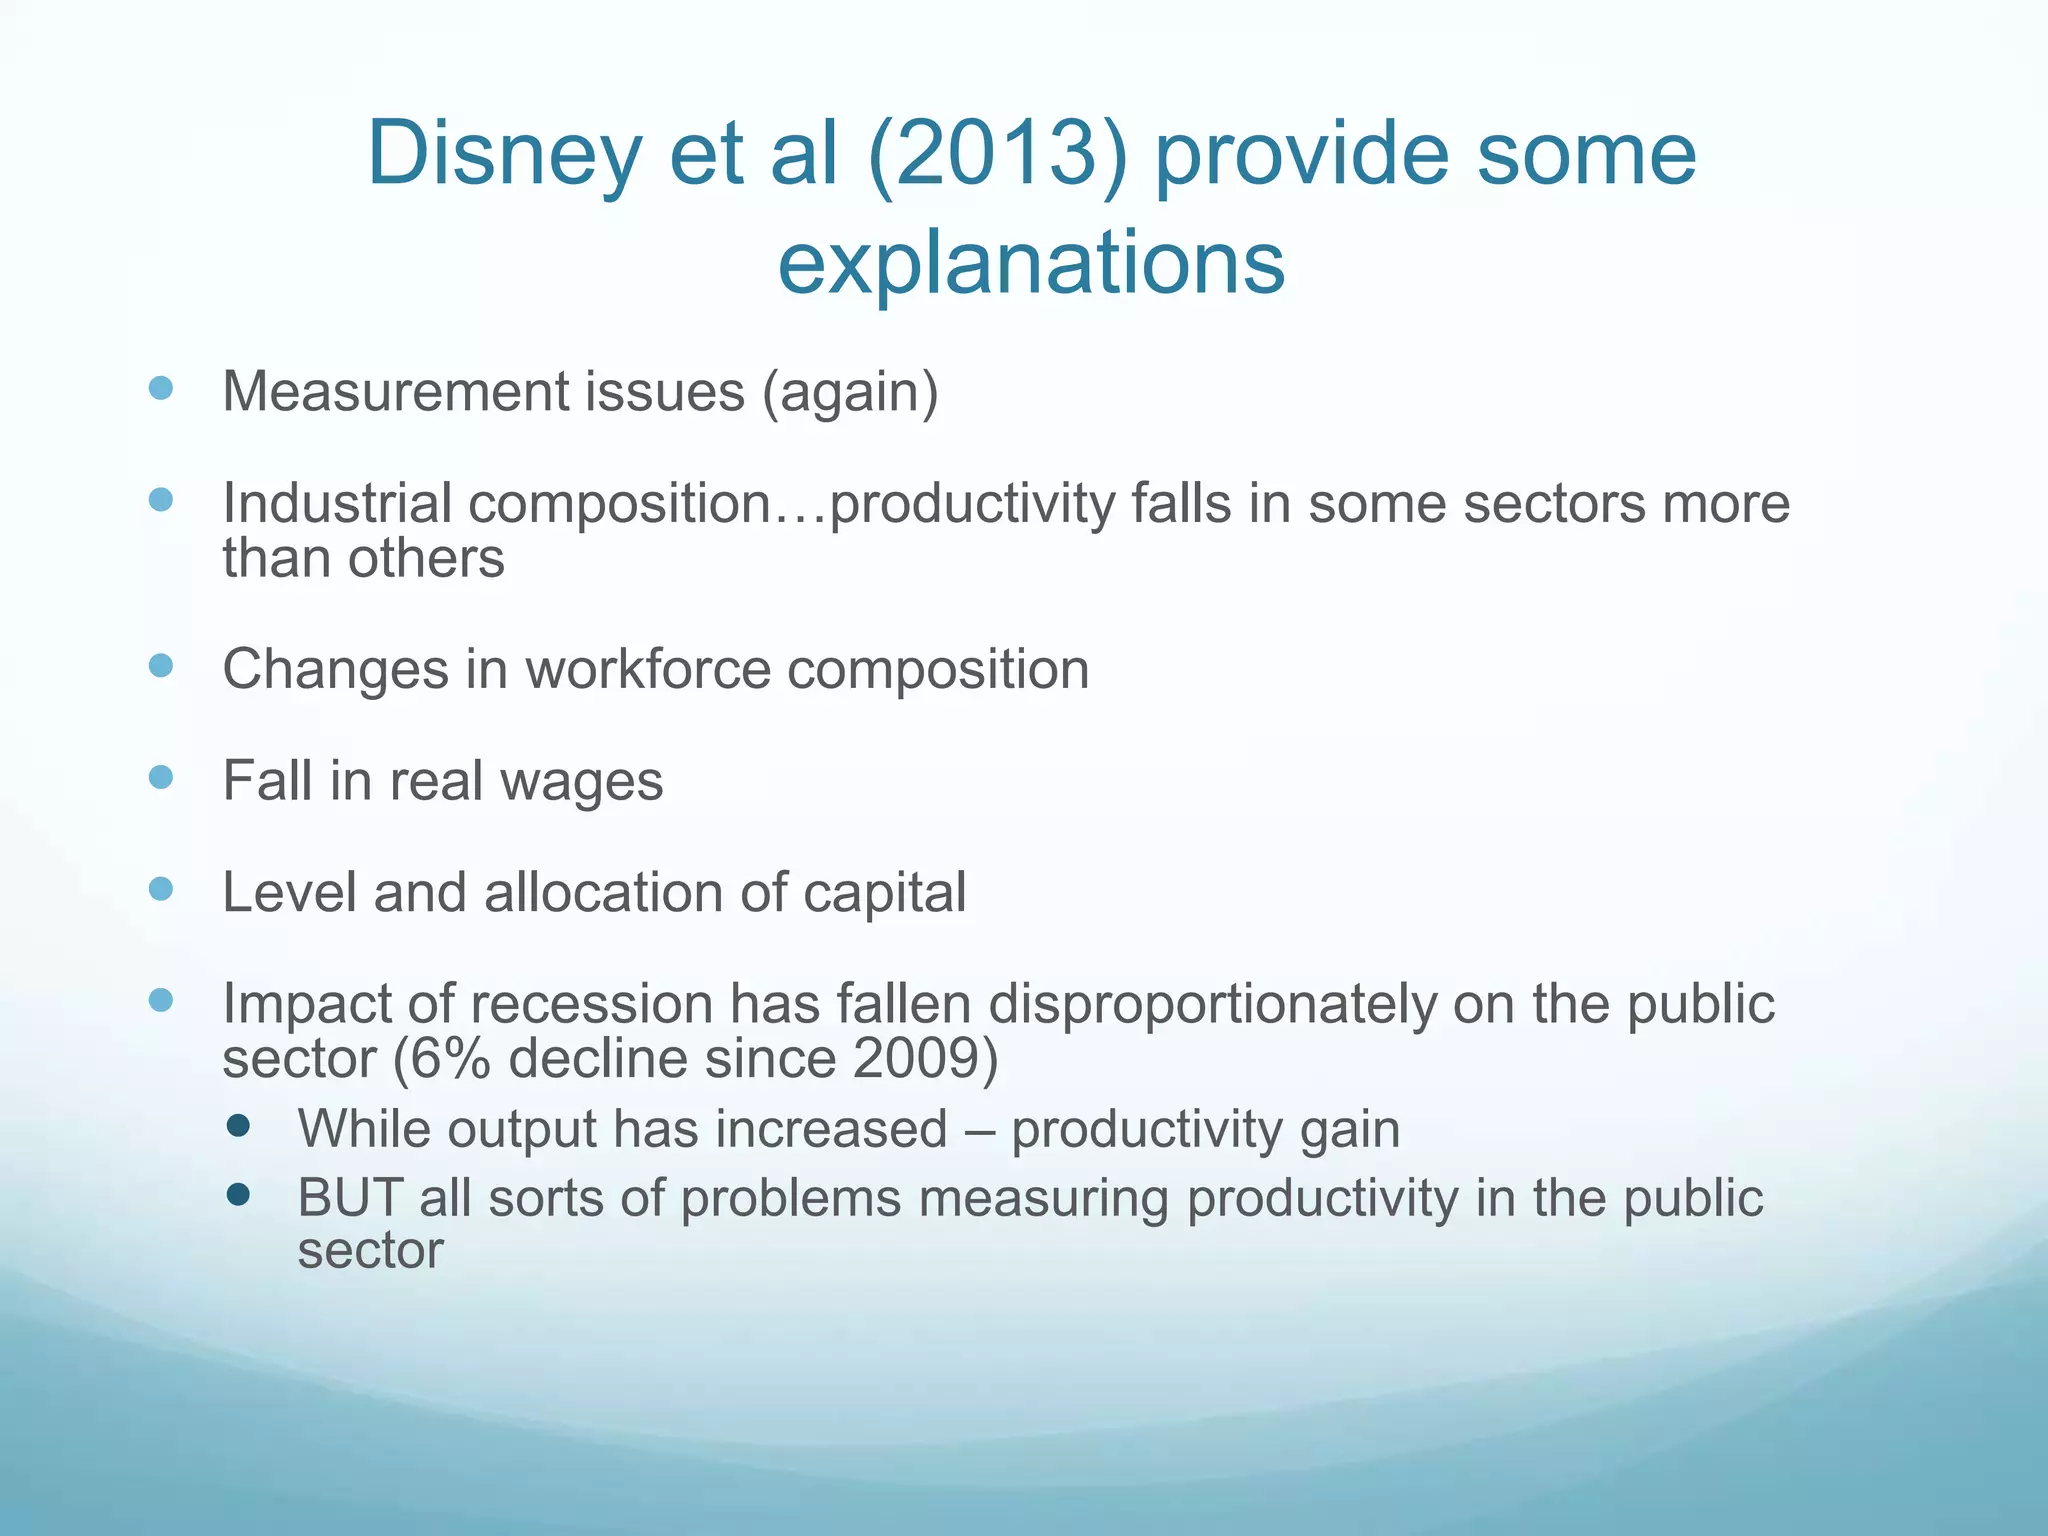

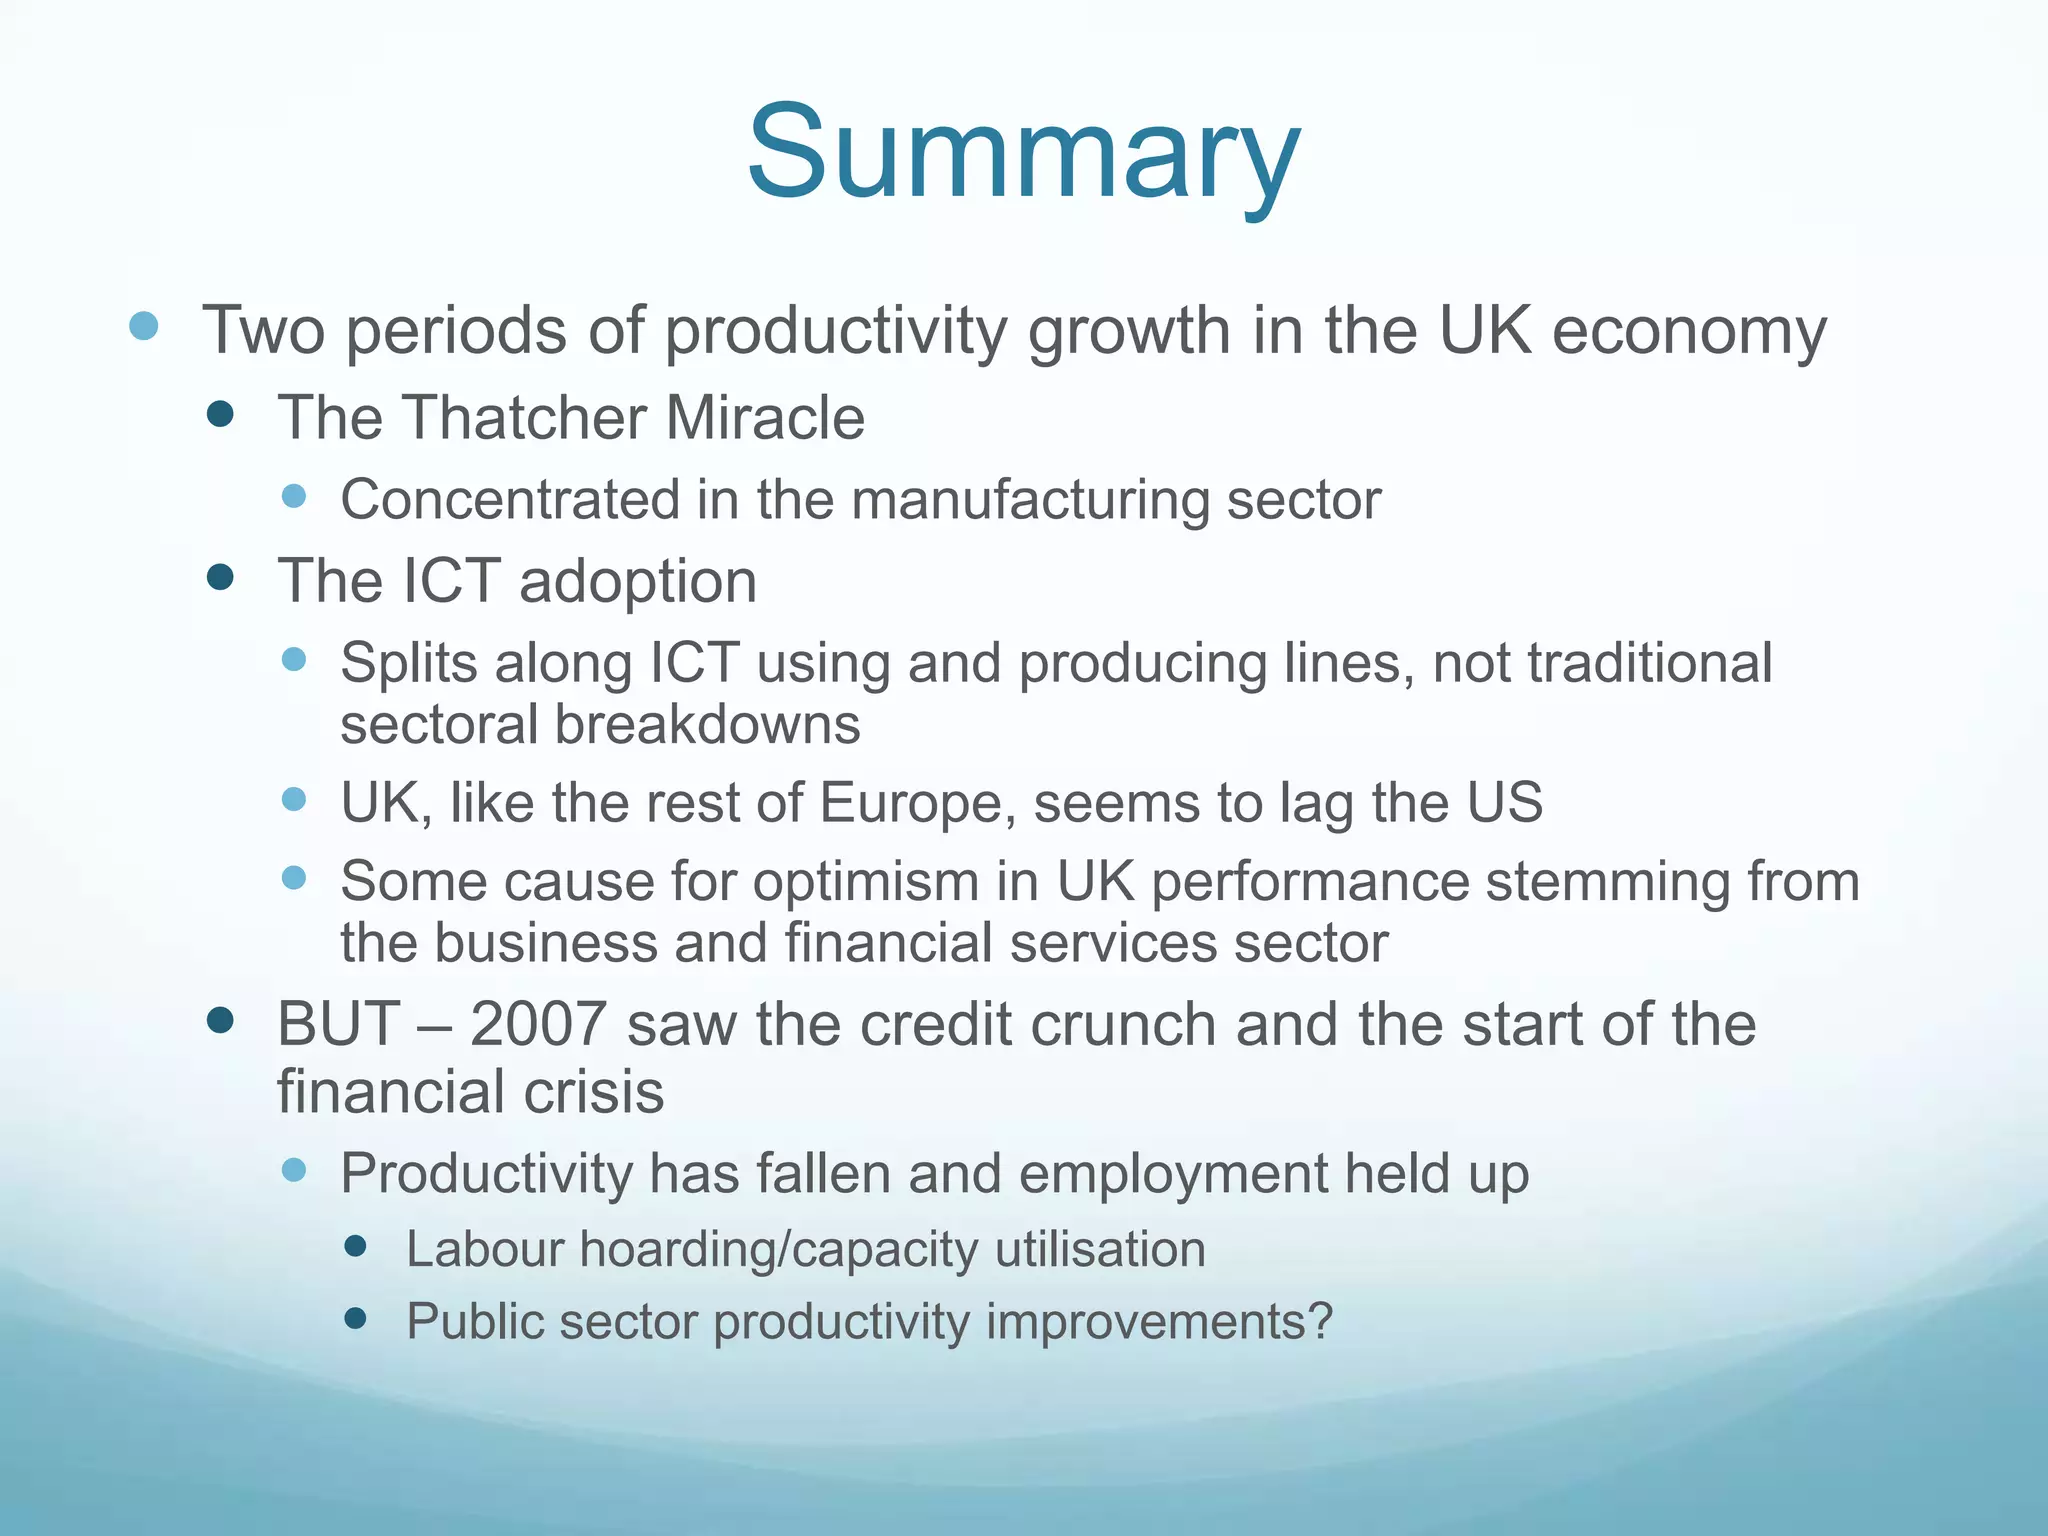

This document summarizes recent trends in UK productivity and economic growth. It discusses two periods of productivity growth: the 1980s under Thatcher and more recently with ICT adoption. However, UK productivity has fallen since the 2008 financial crisis while employment has held up, possibly due to labour hoarding. The document reviews literature examining causes of productivity shifts, finding sectors like financial services boosted growth. Ongoing measurement challenges and the outsized public sector downturn complicate understanding recent productivity.