Download to read offline


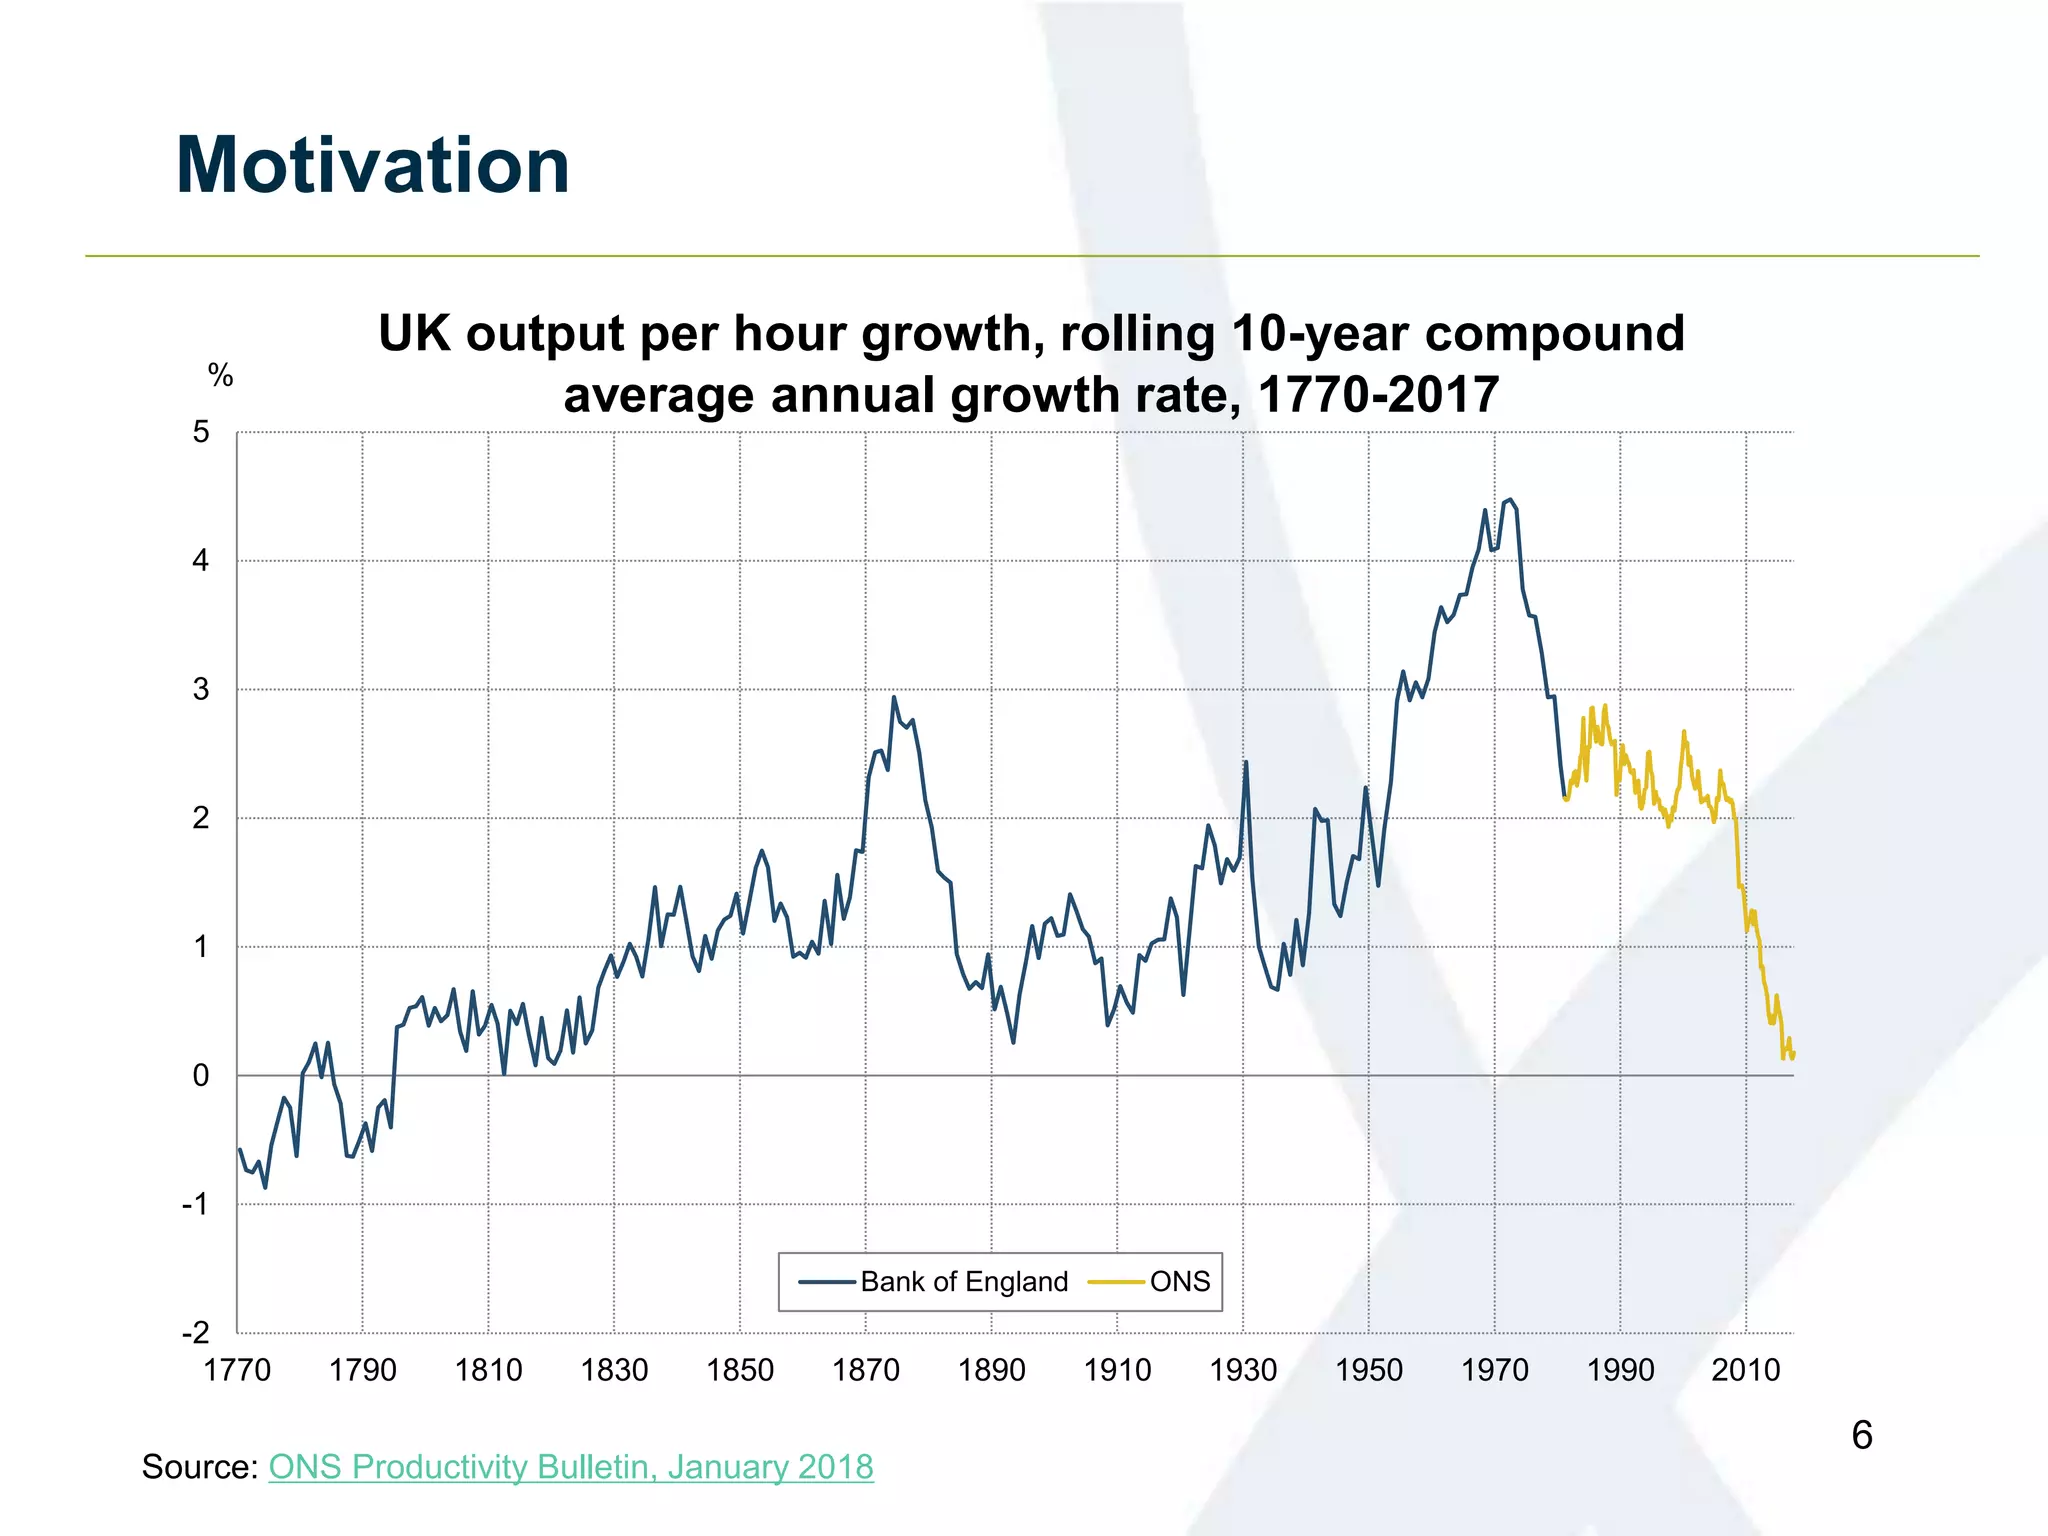
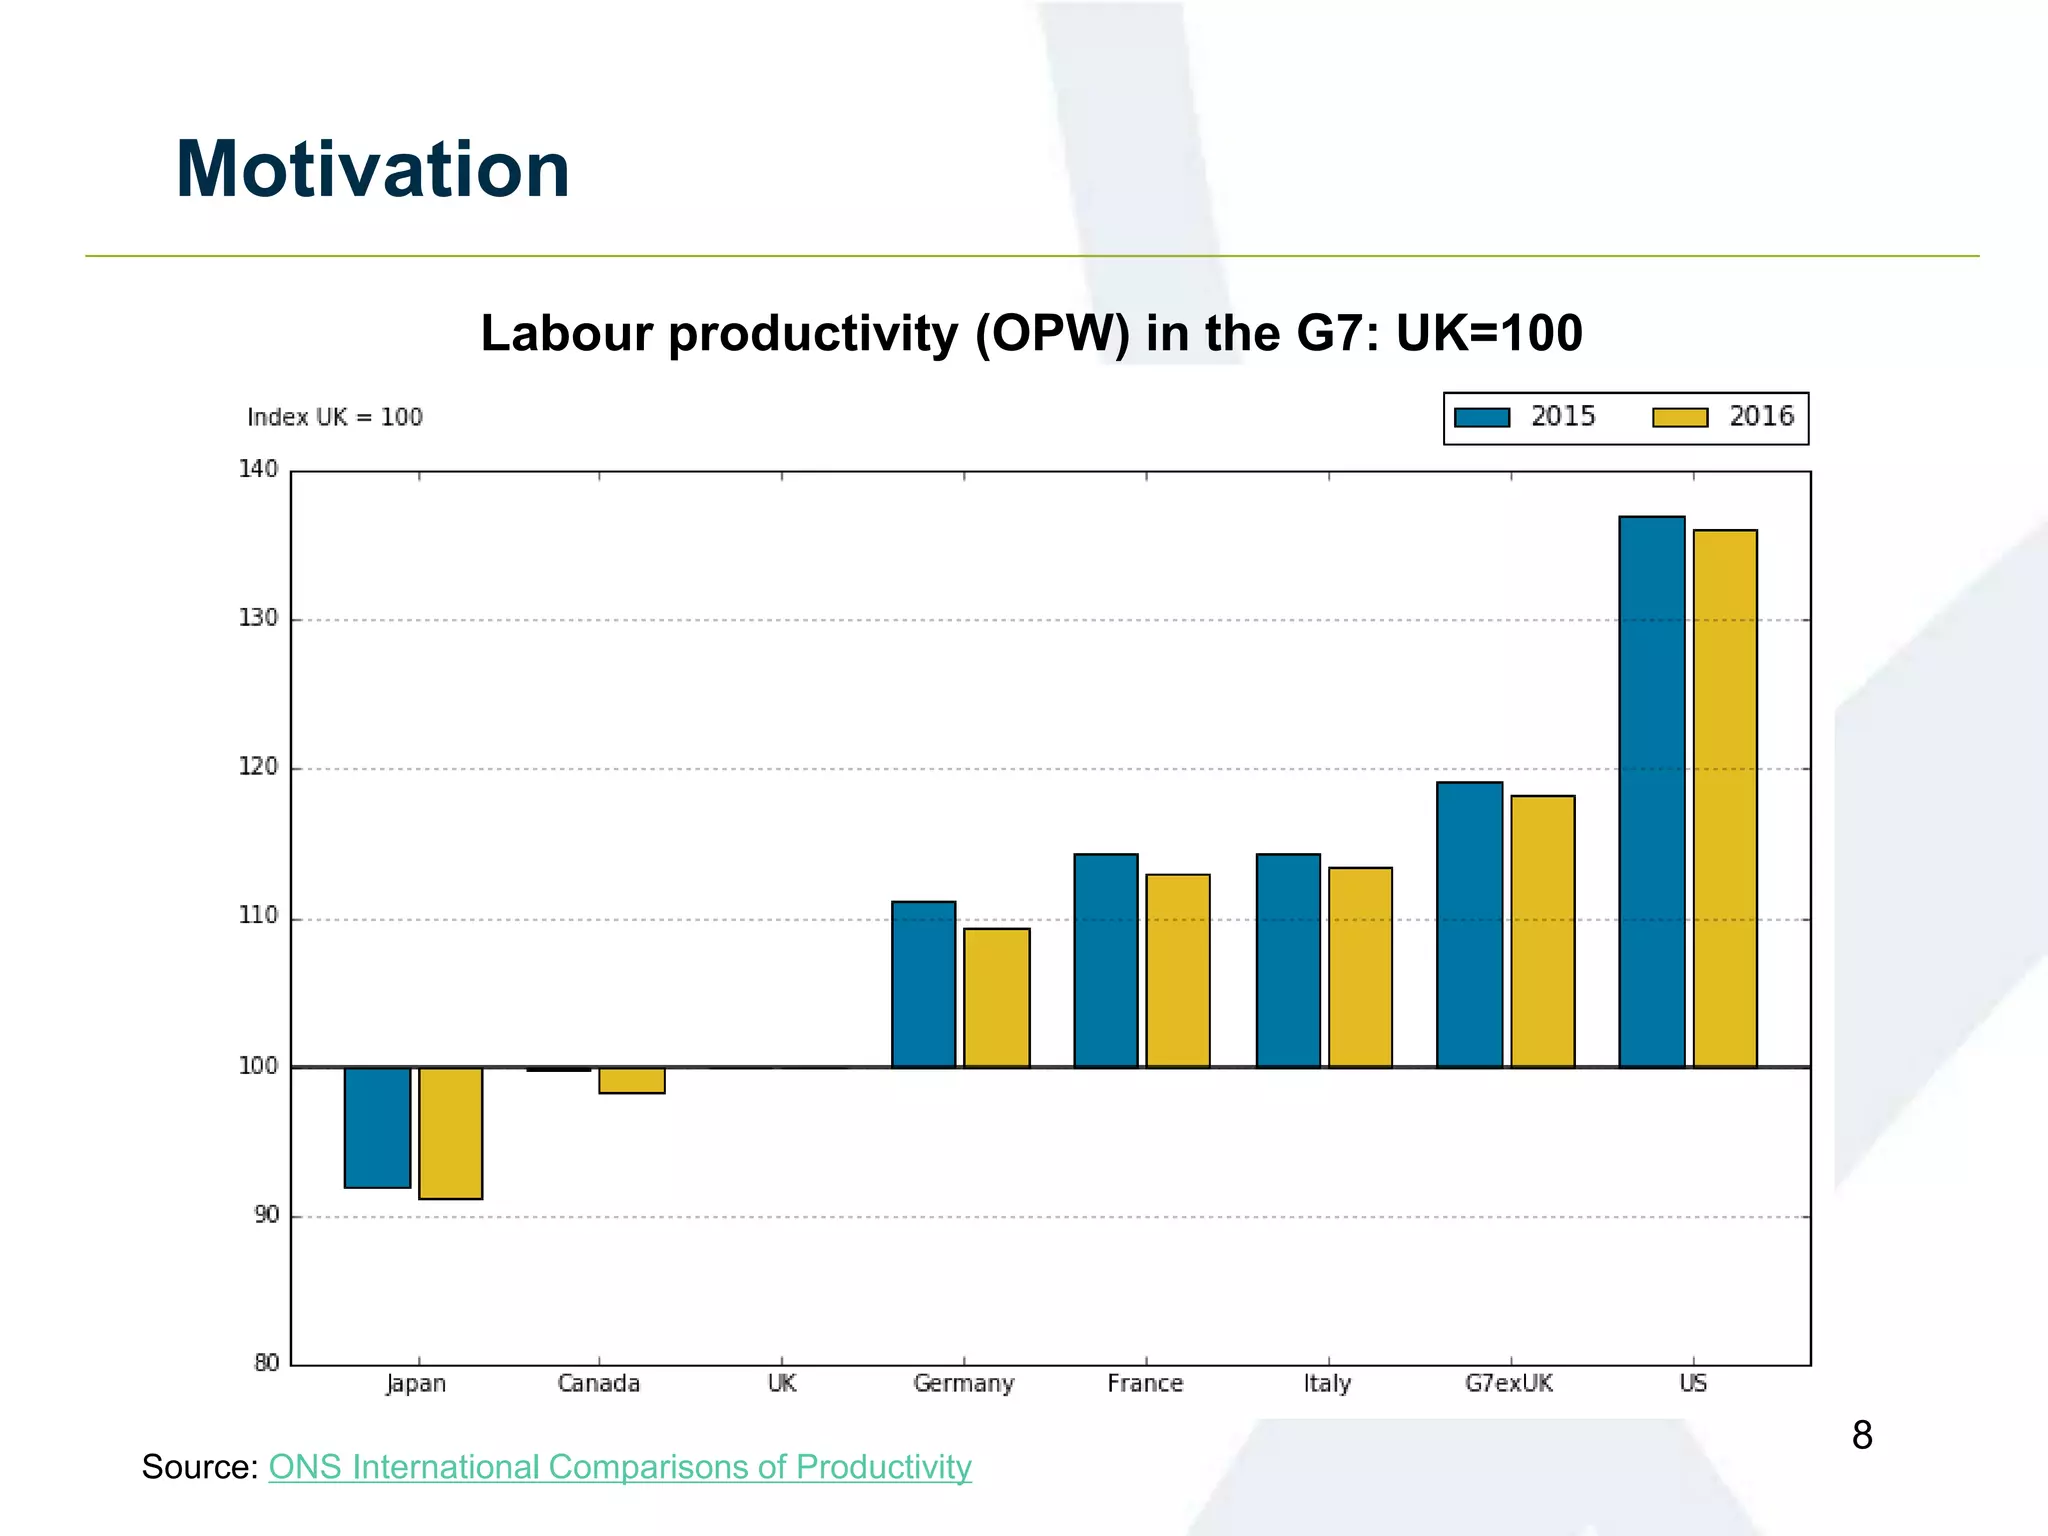
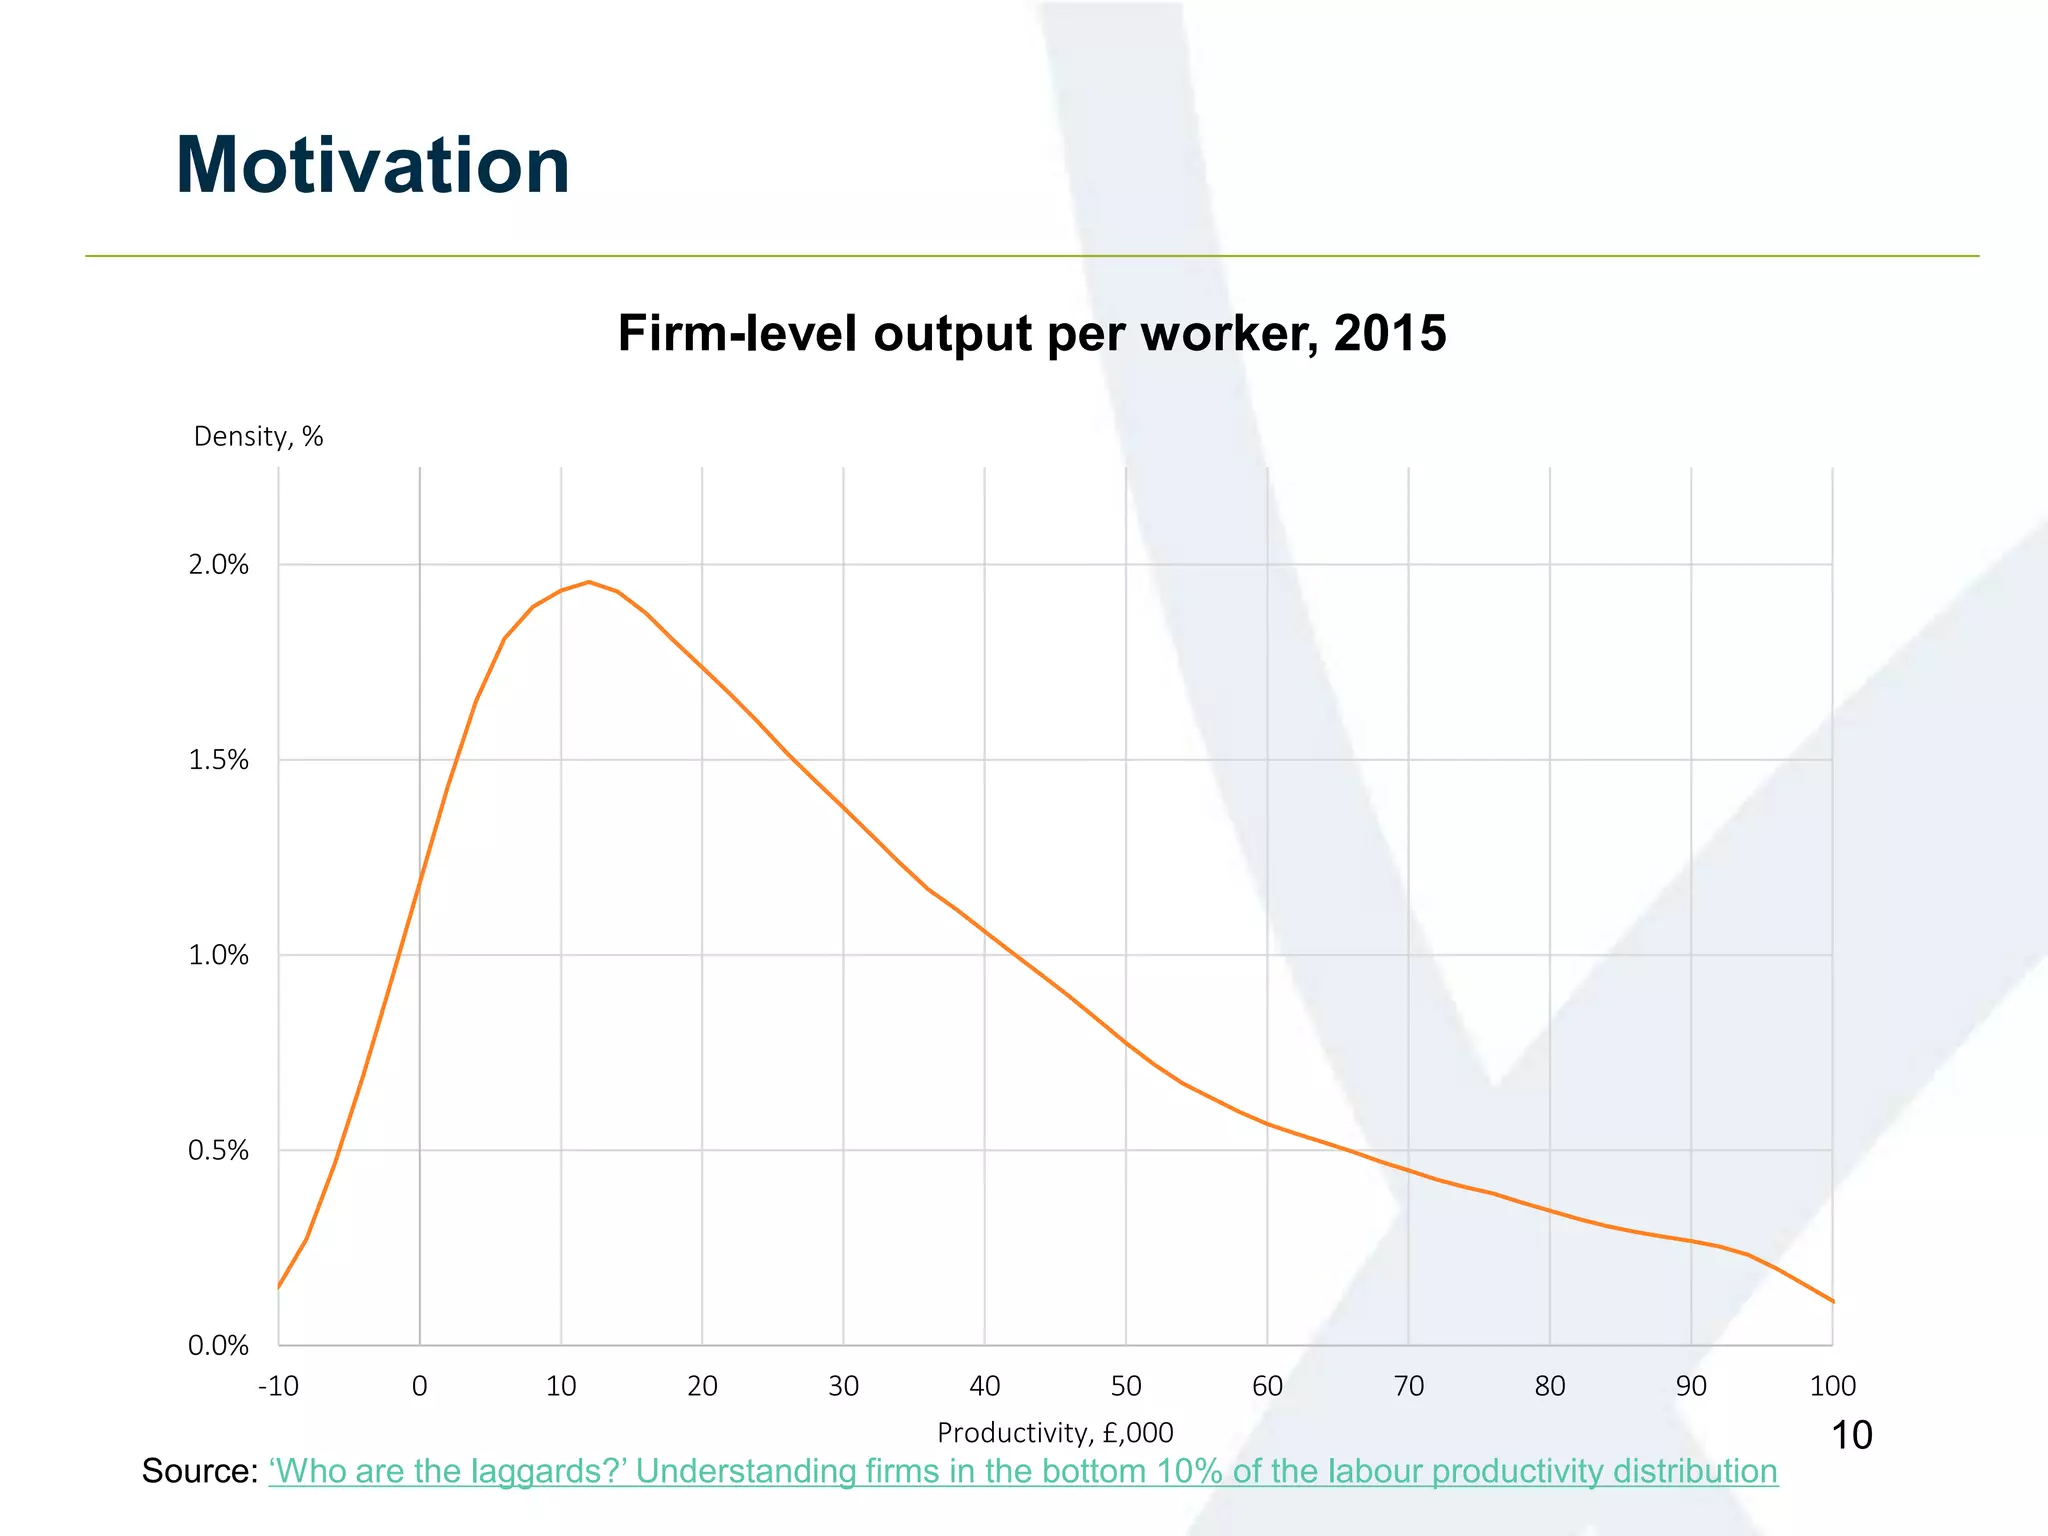
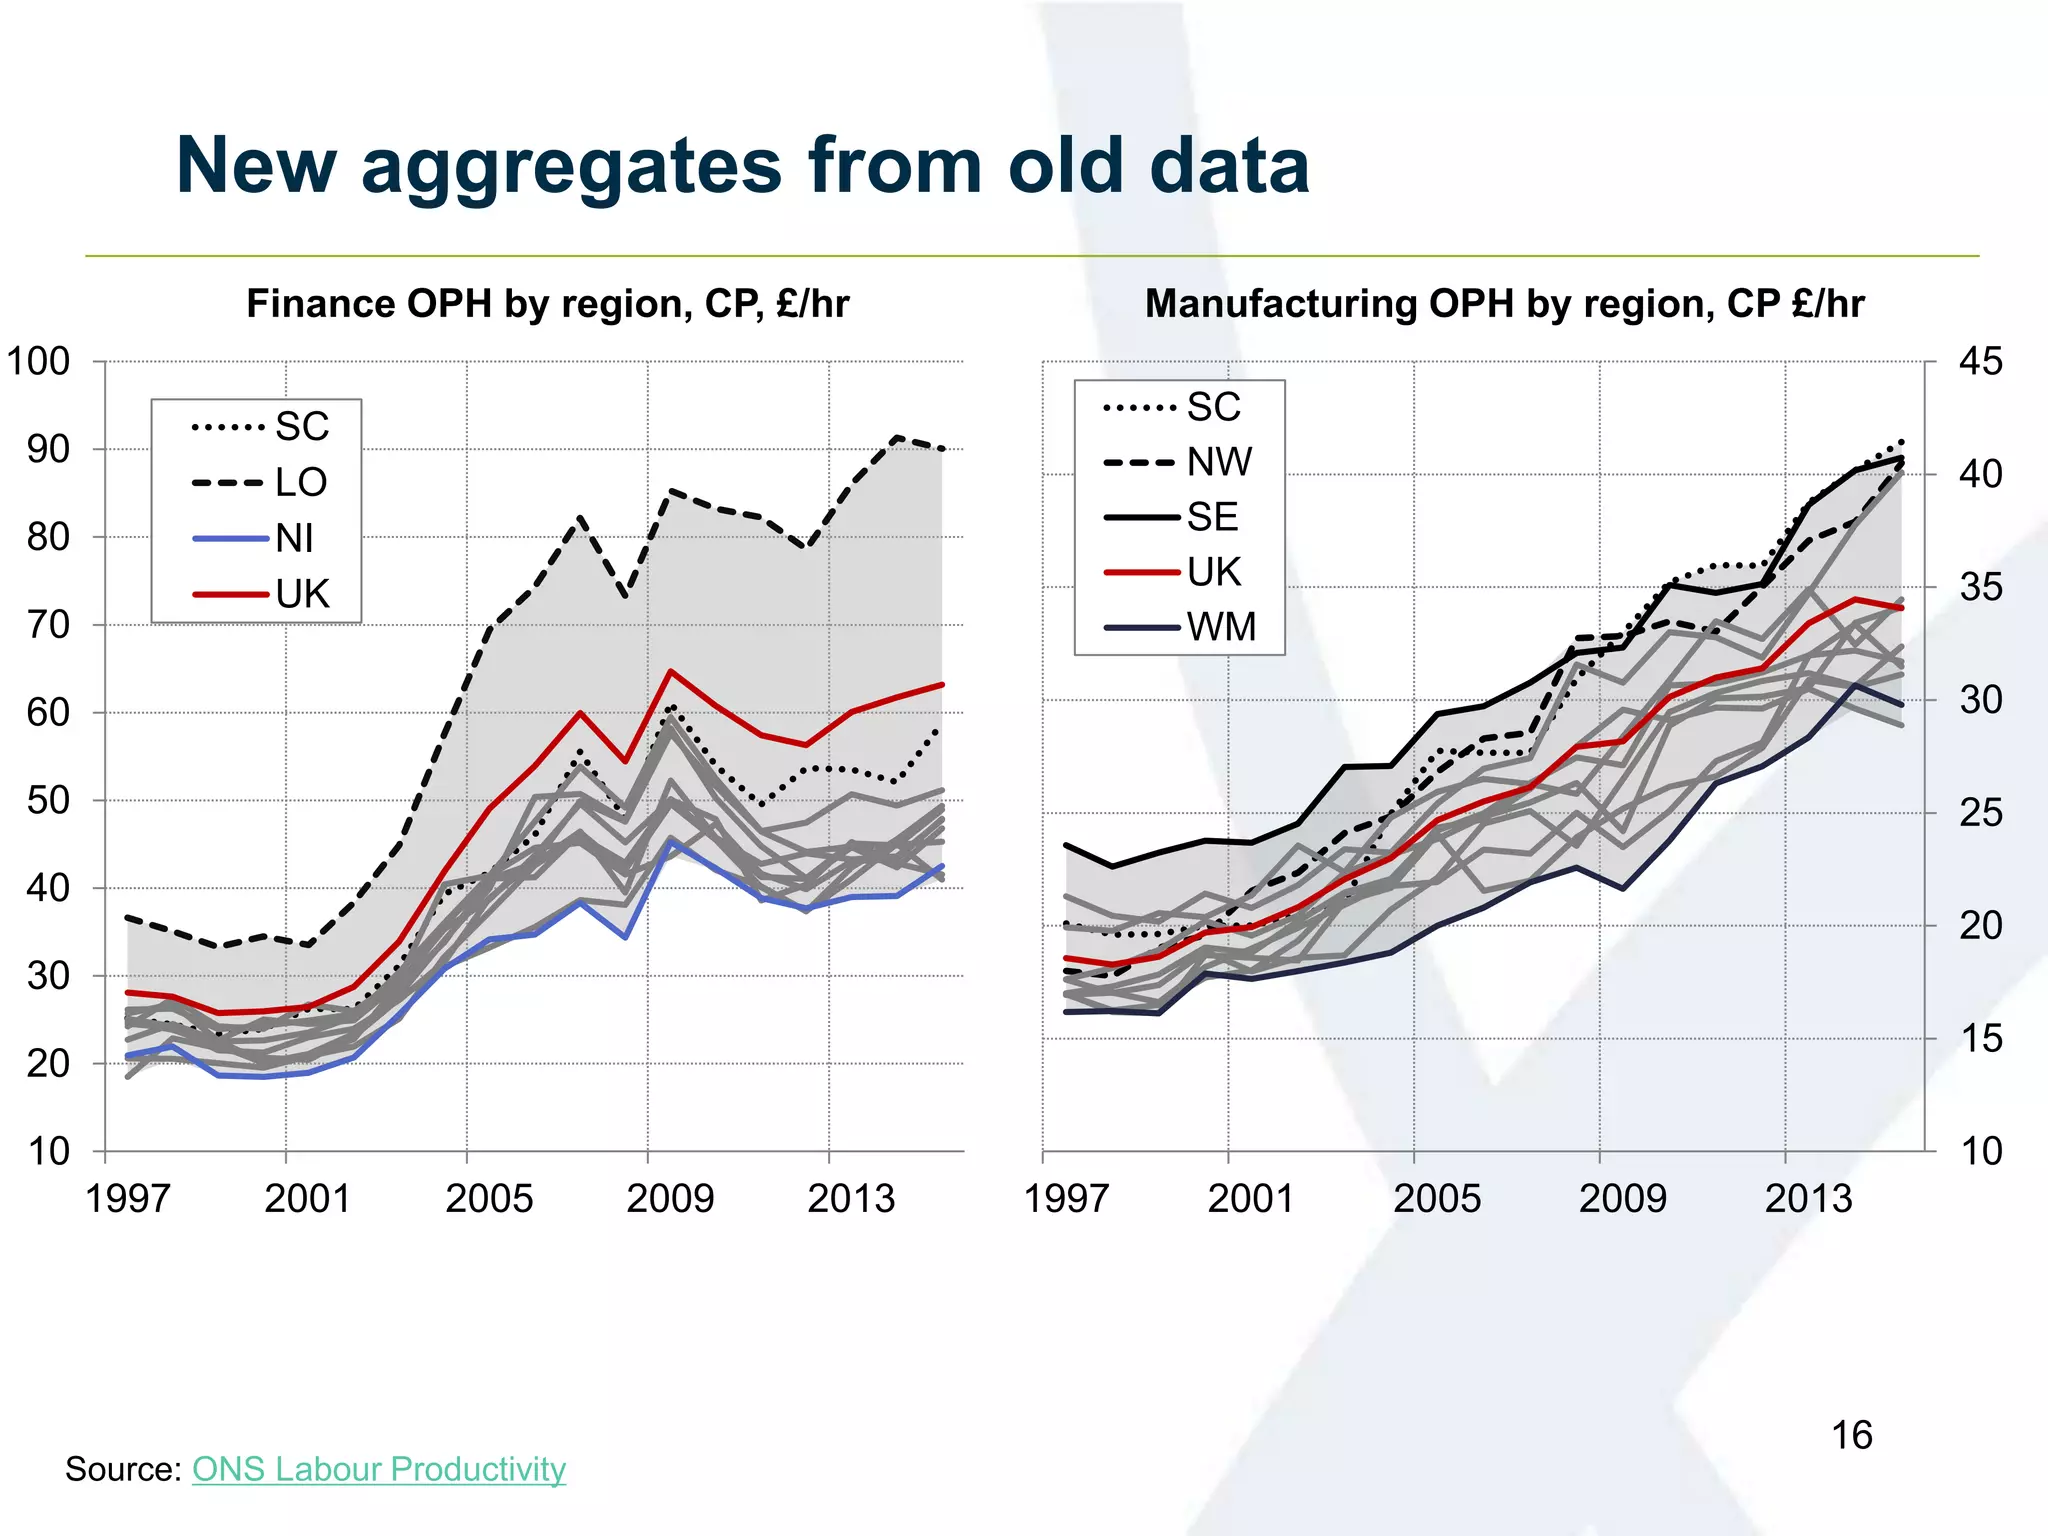
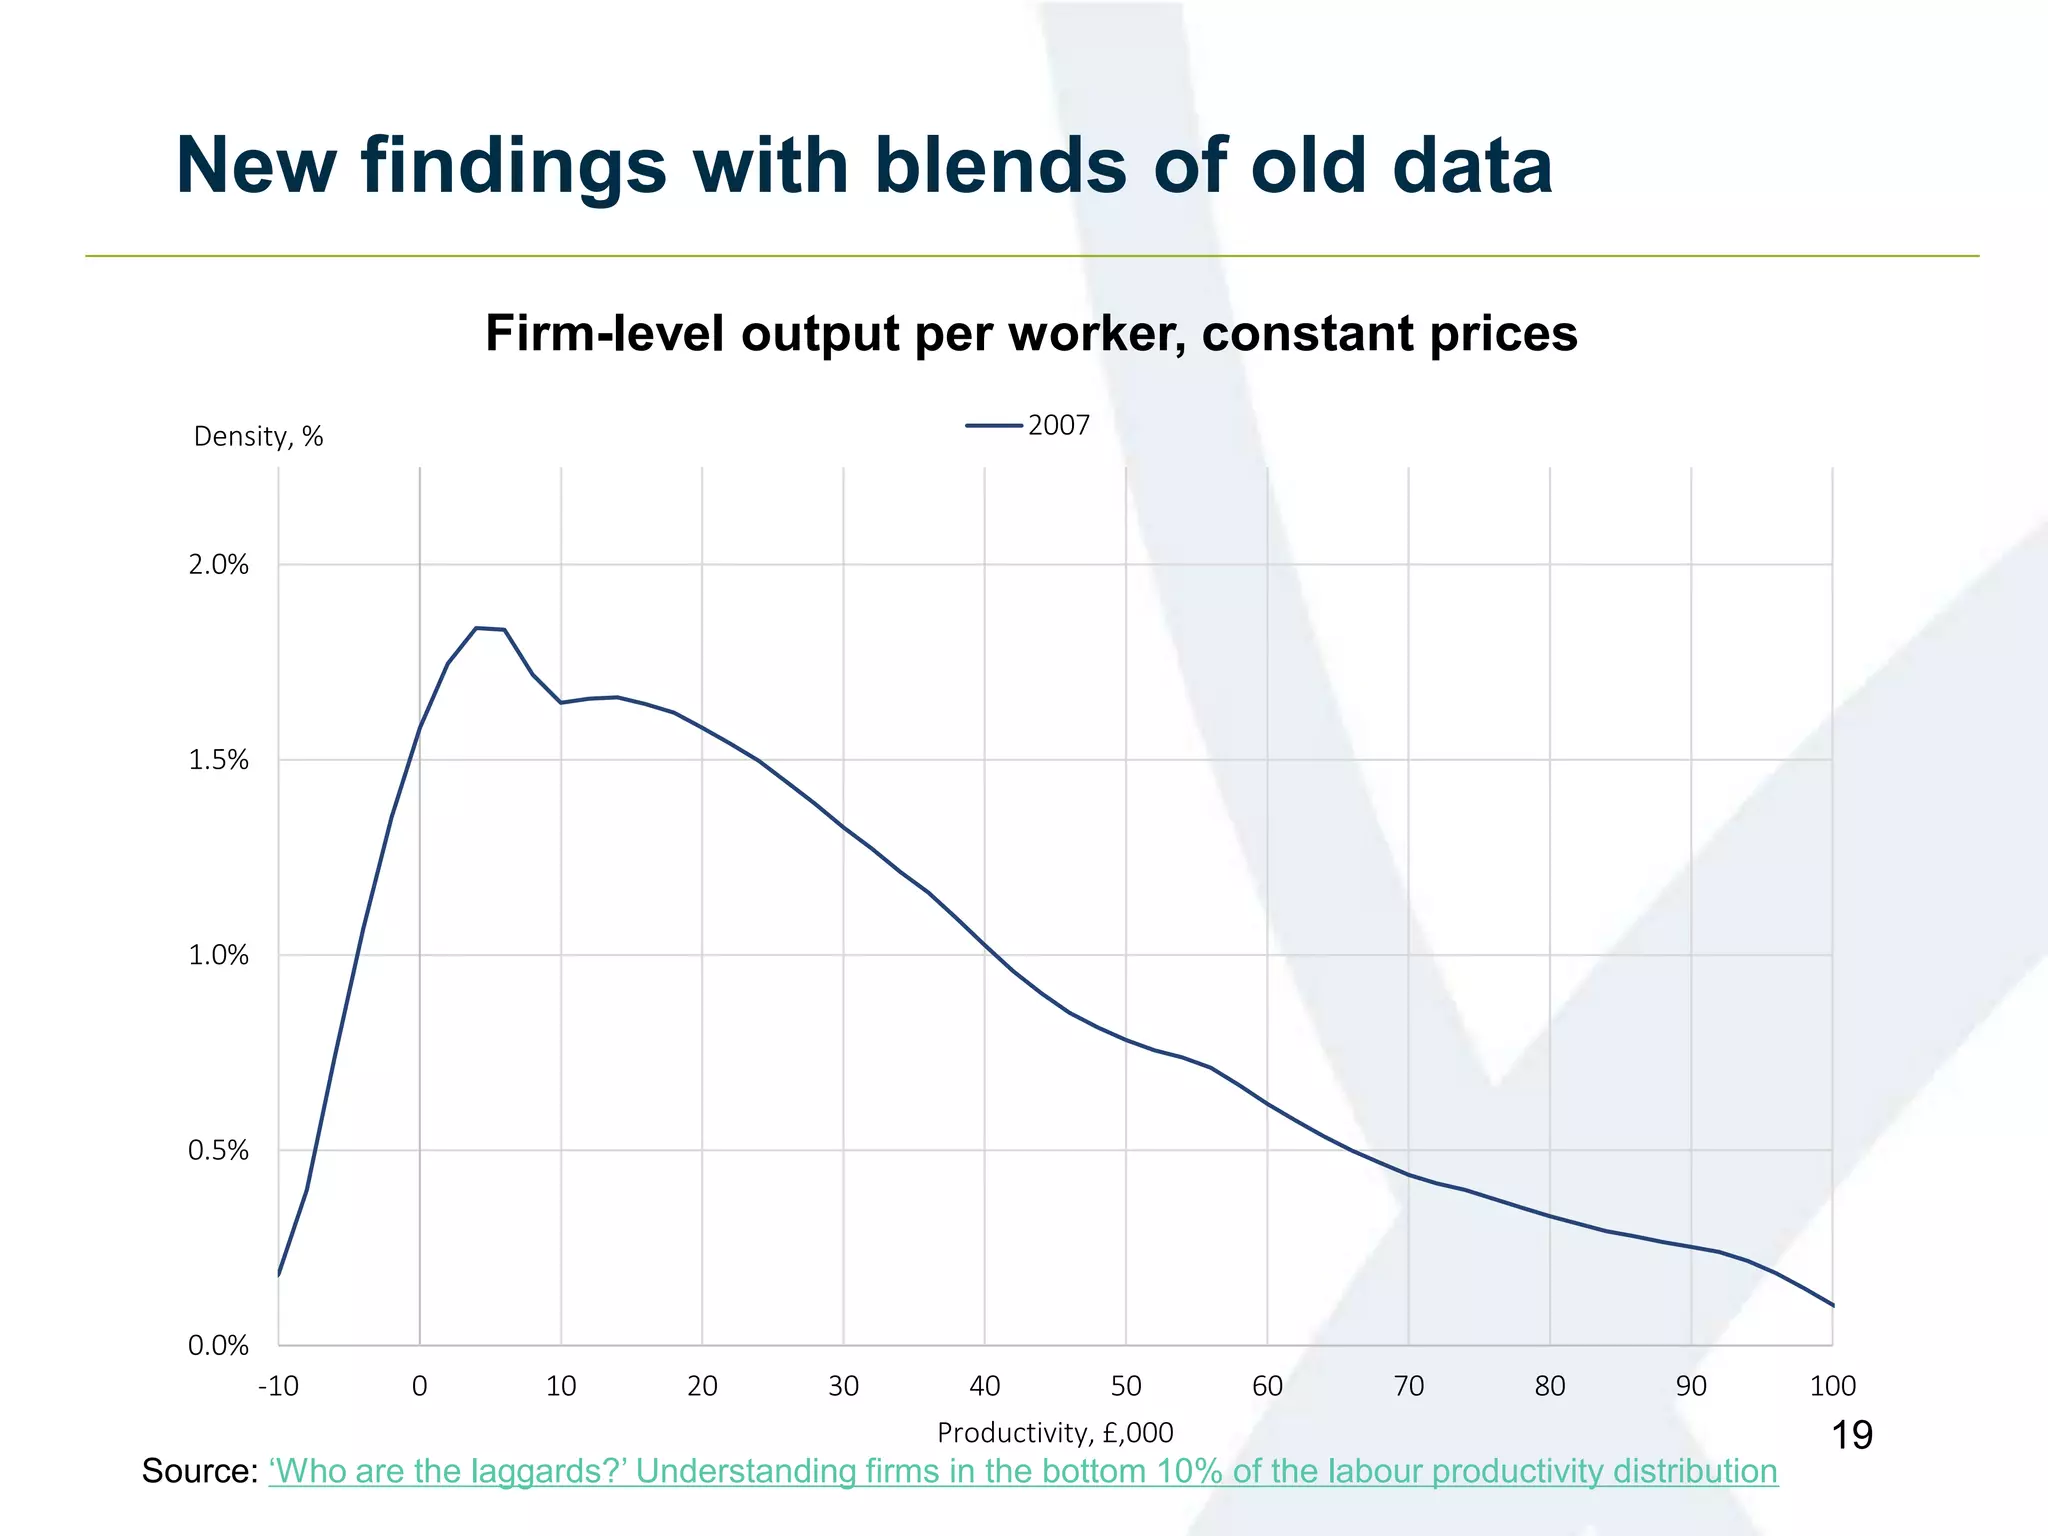
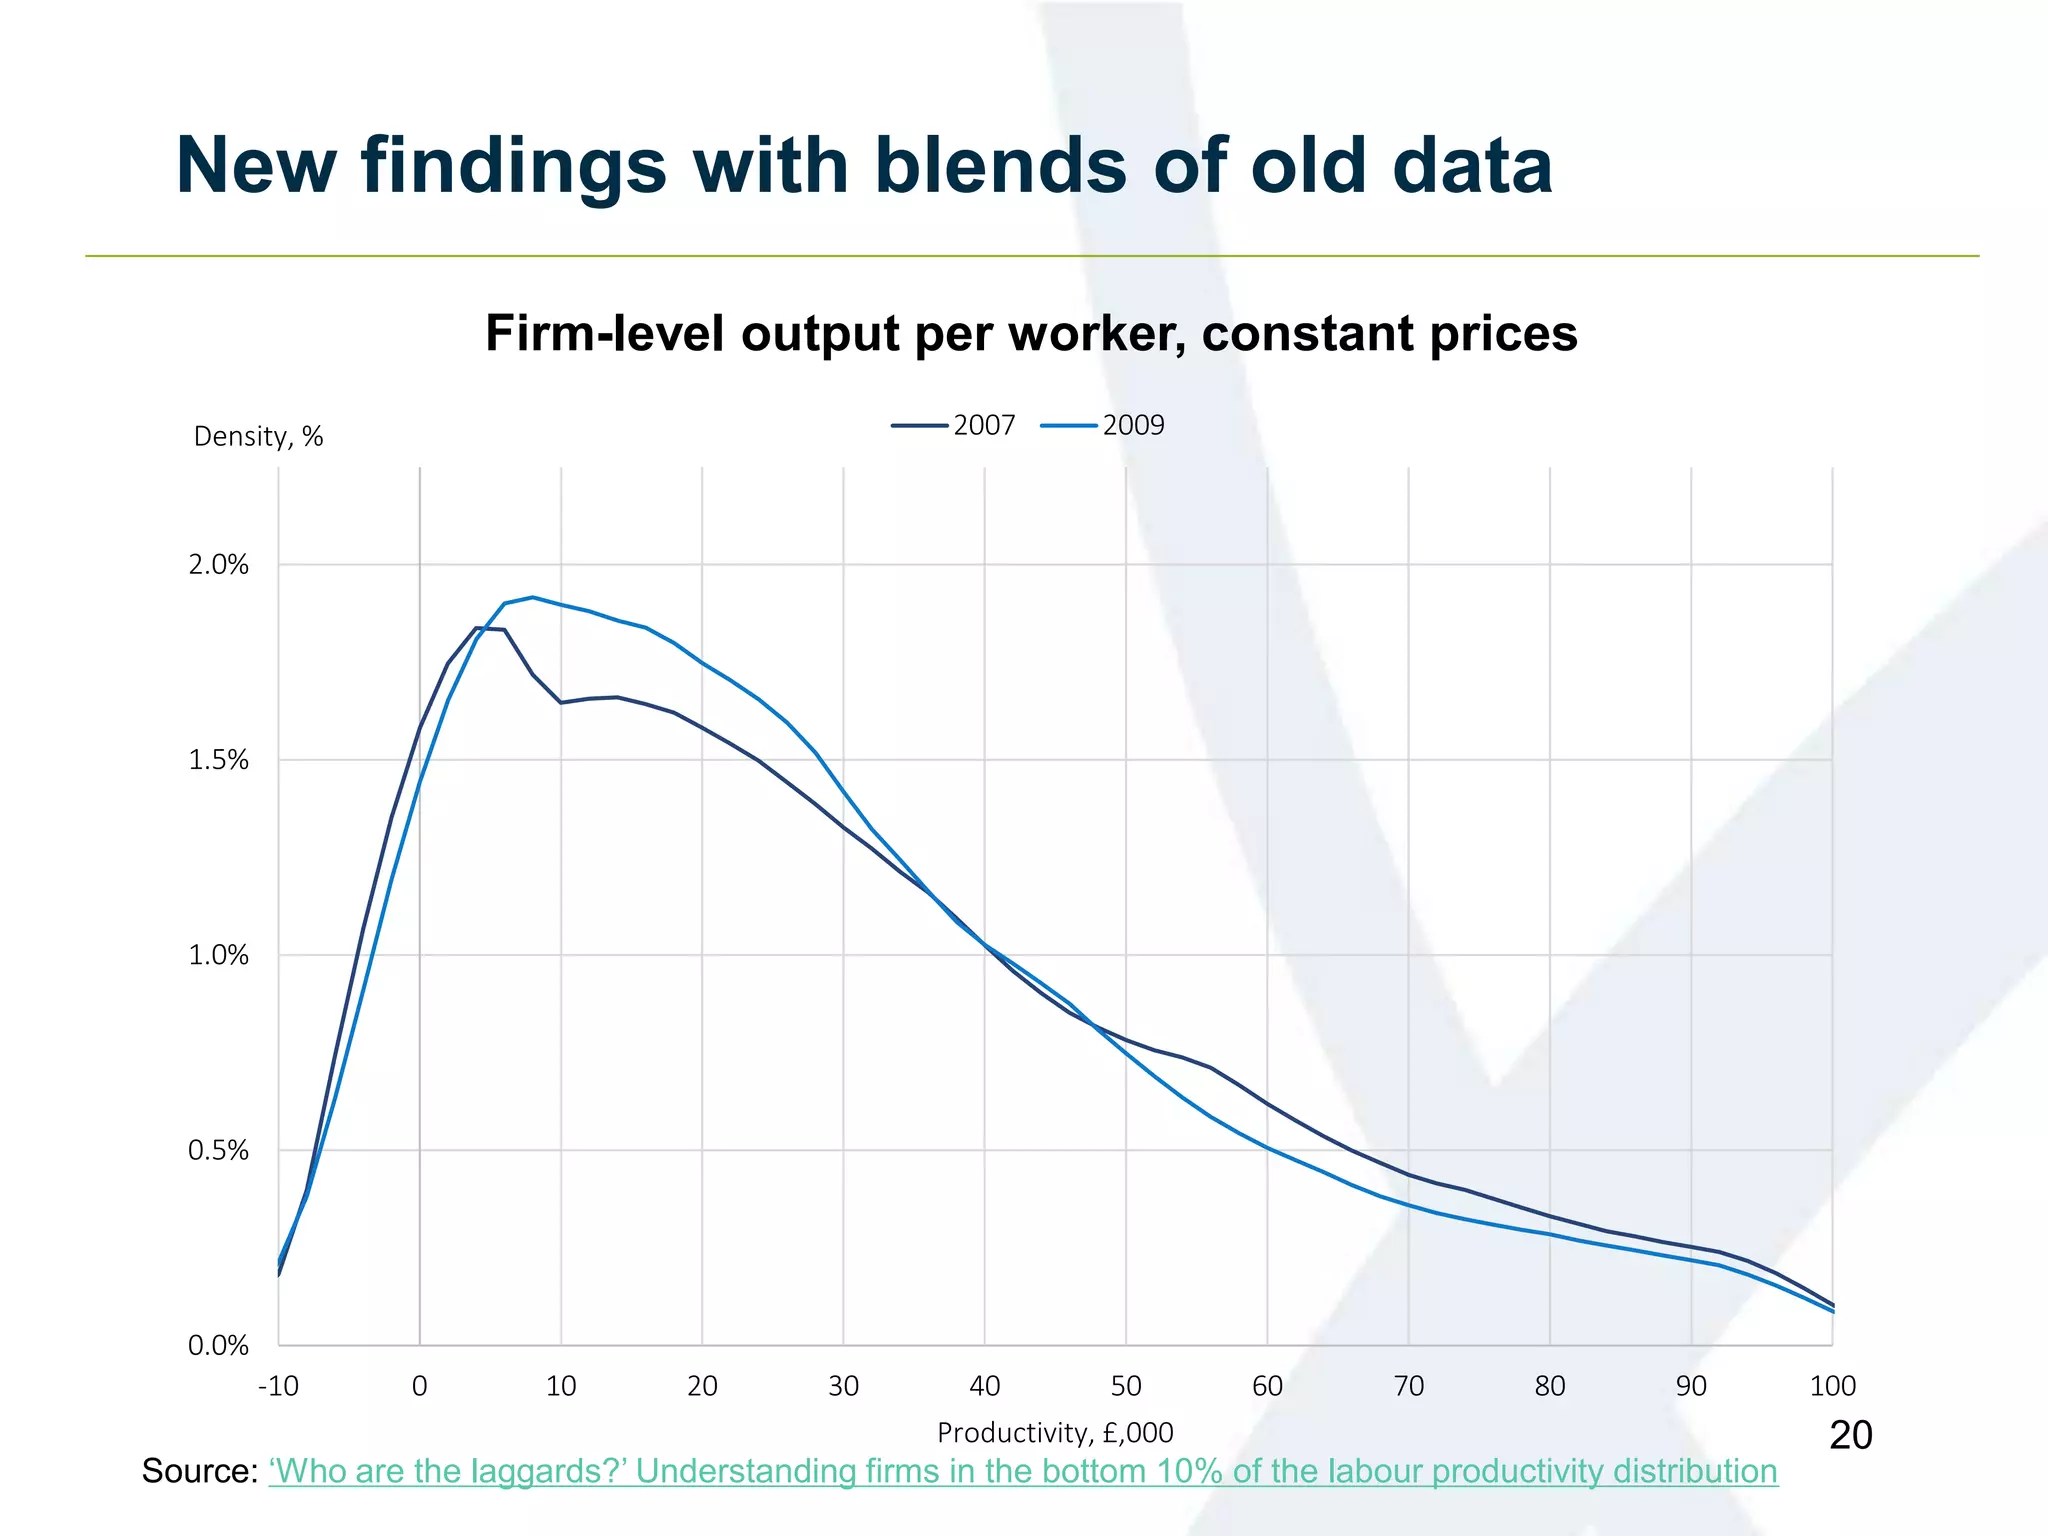
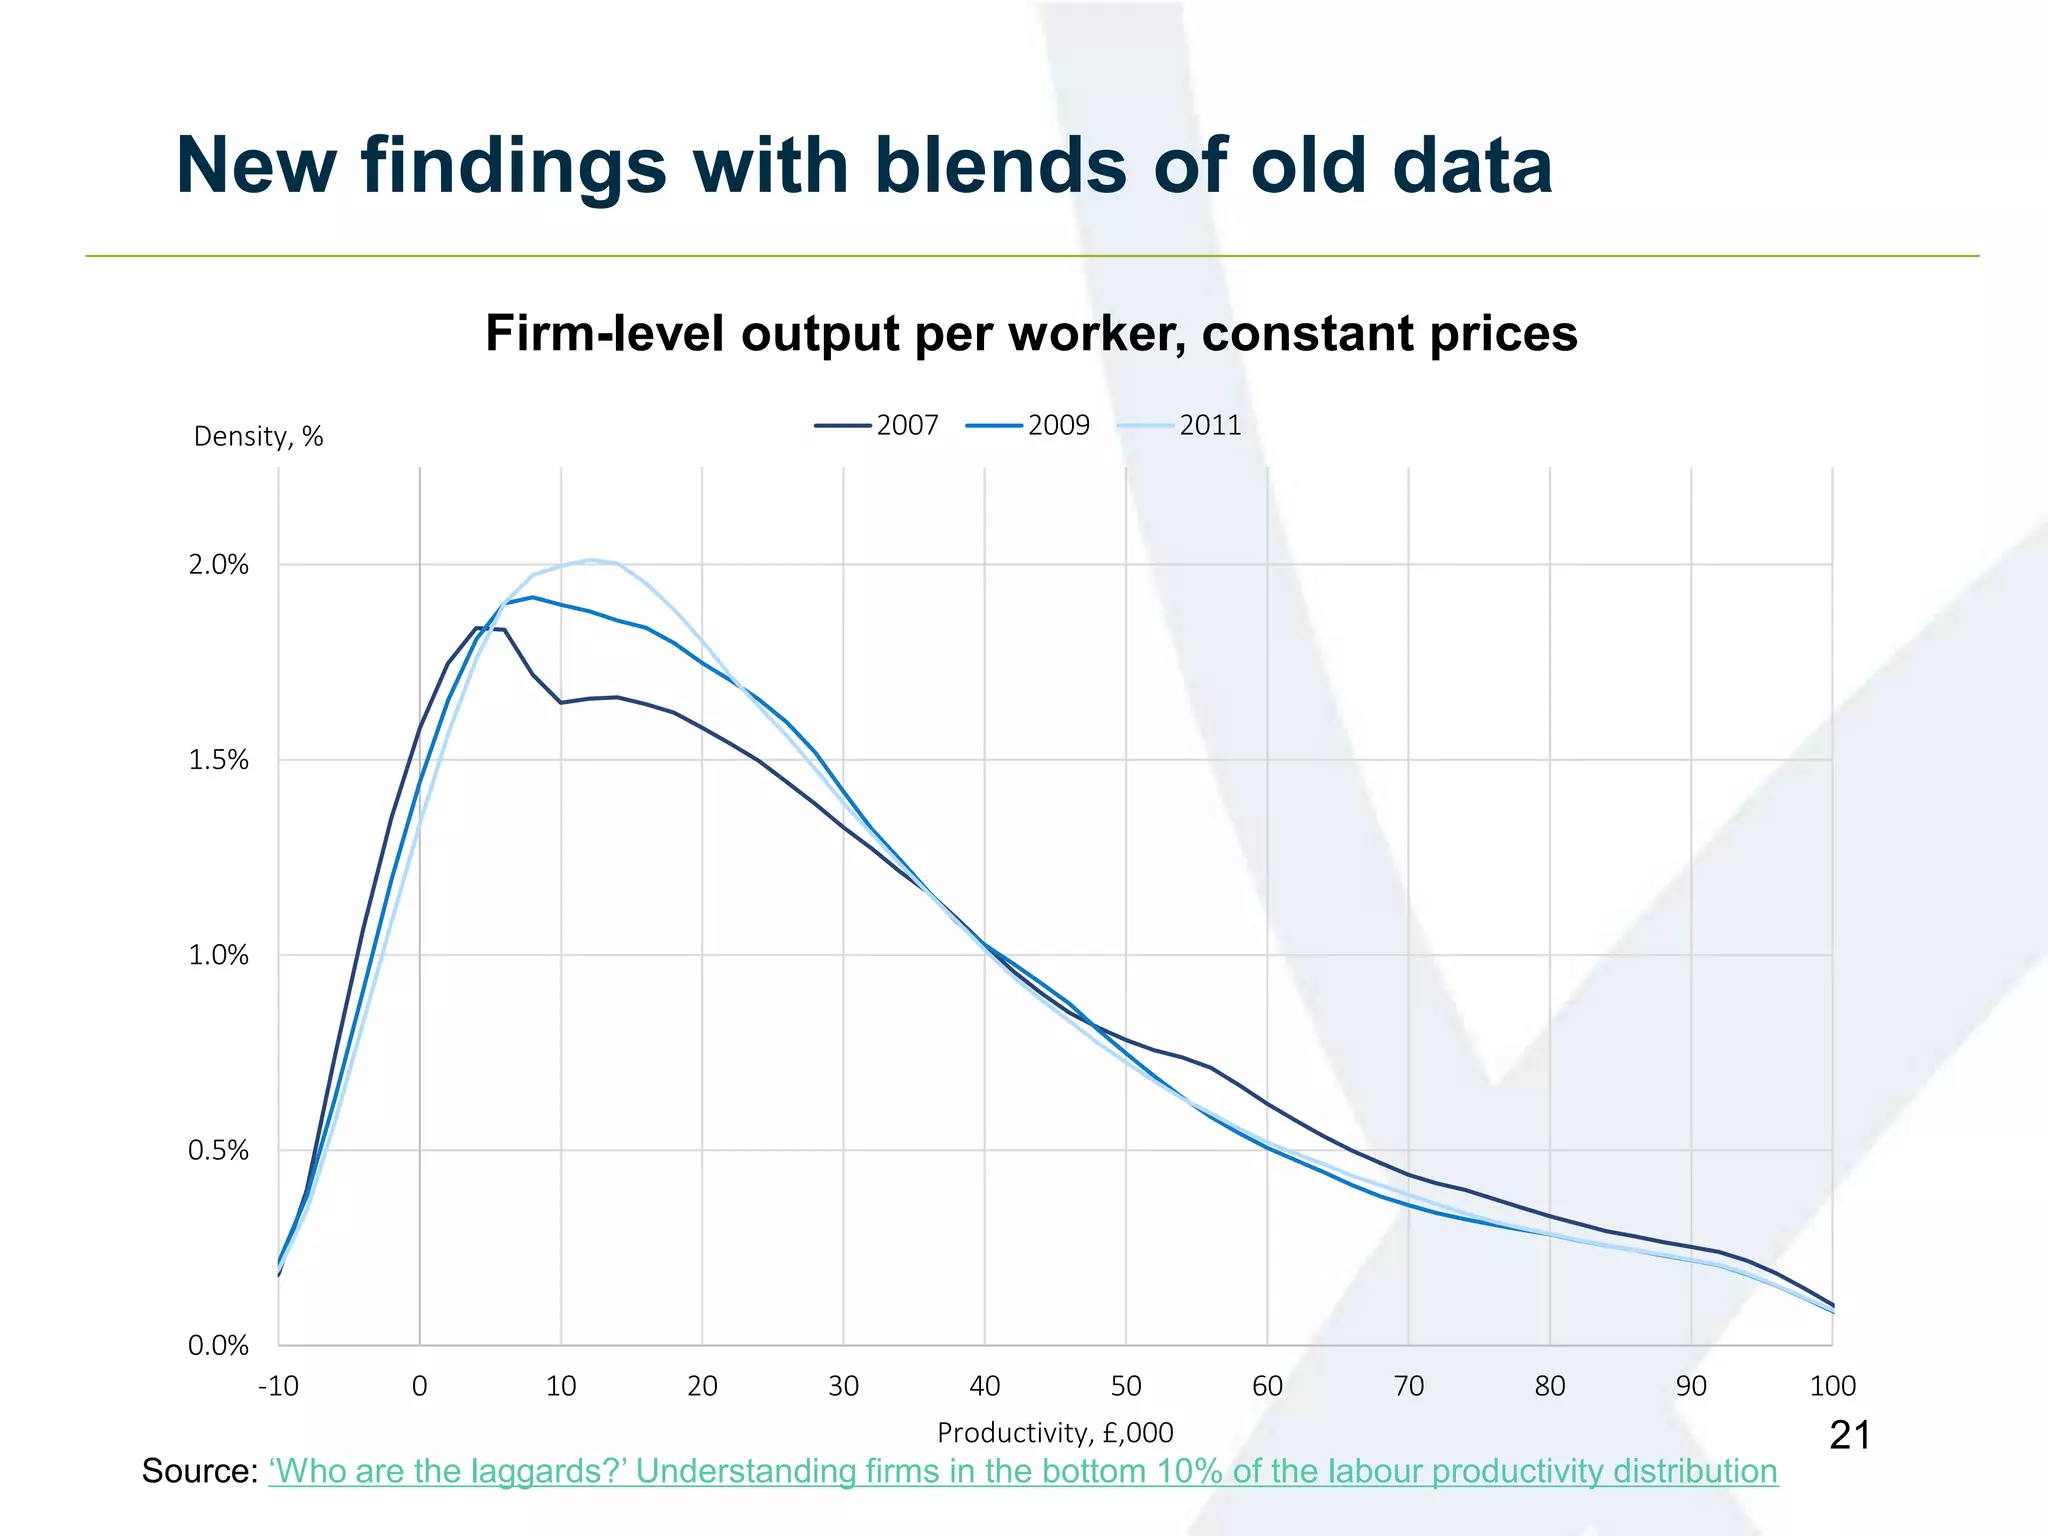
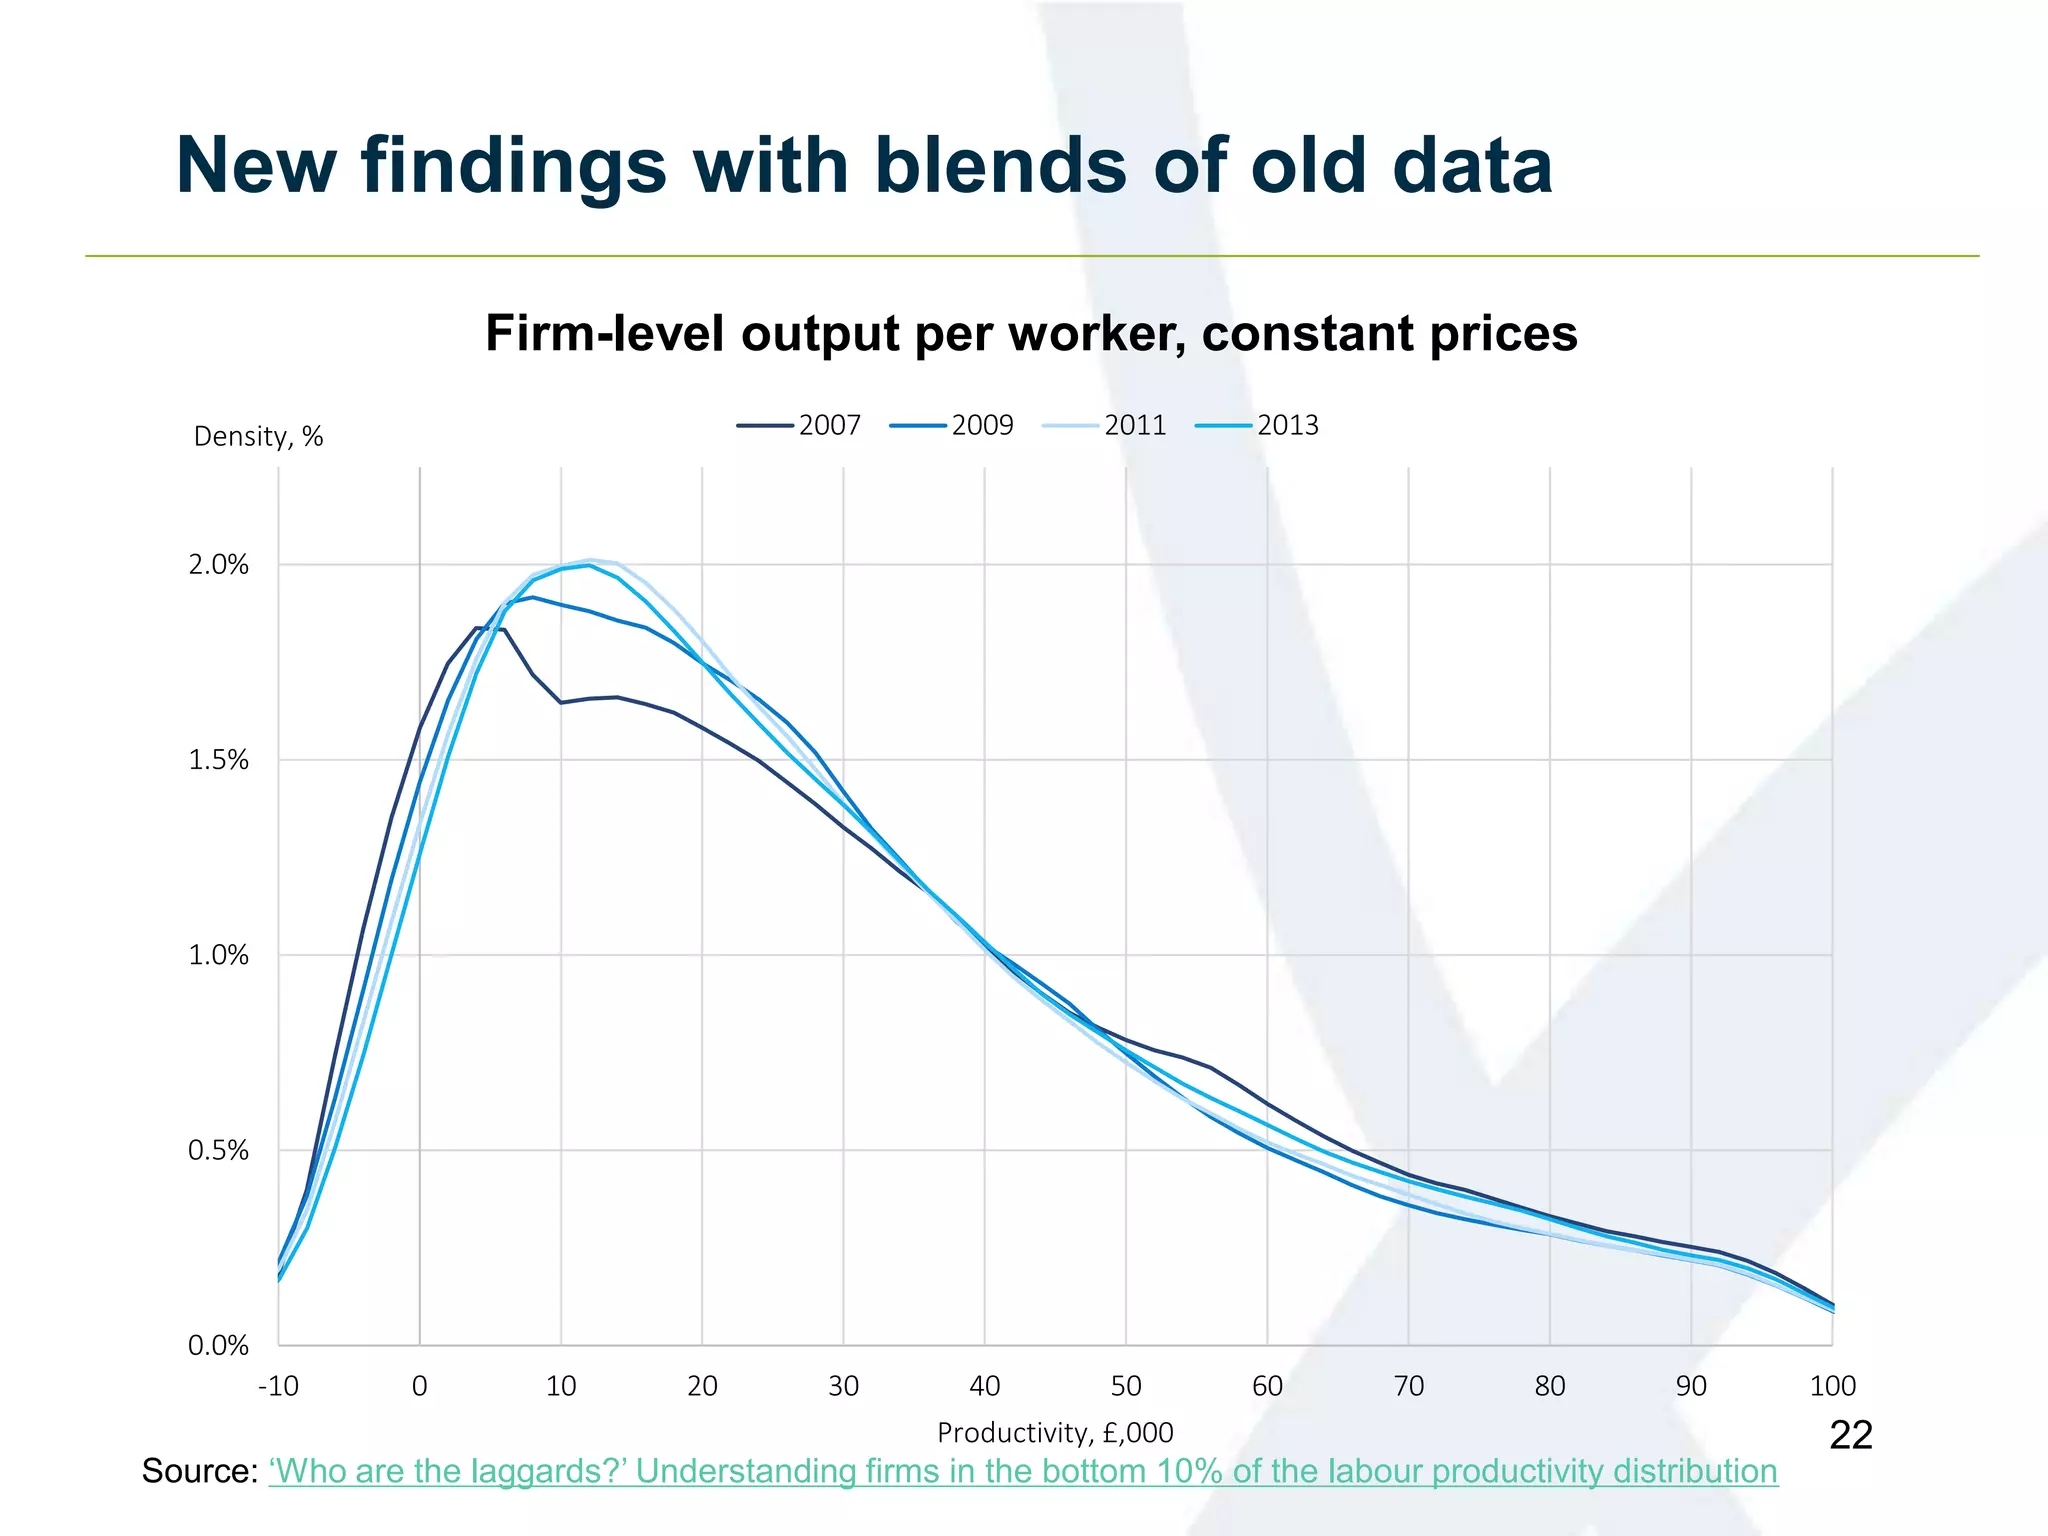
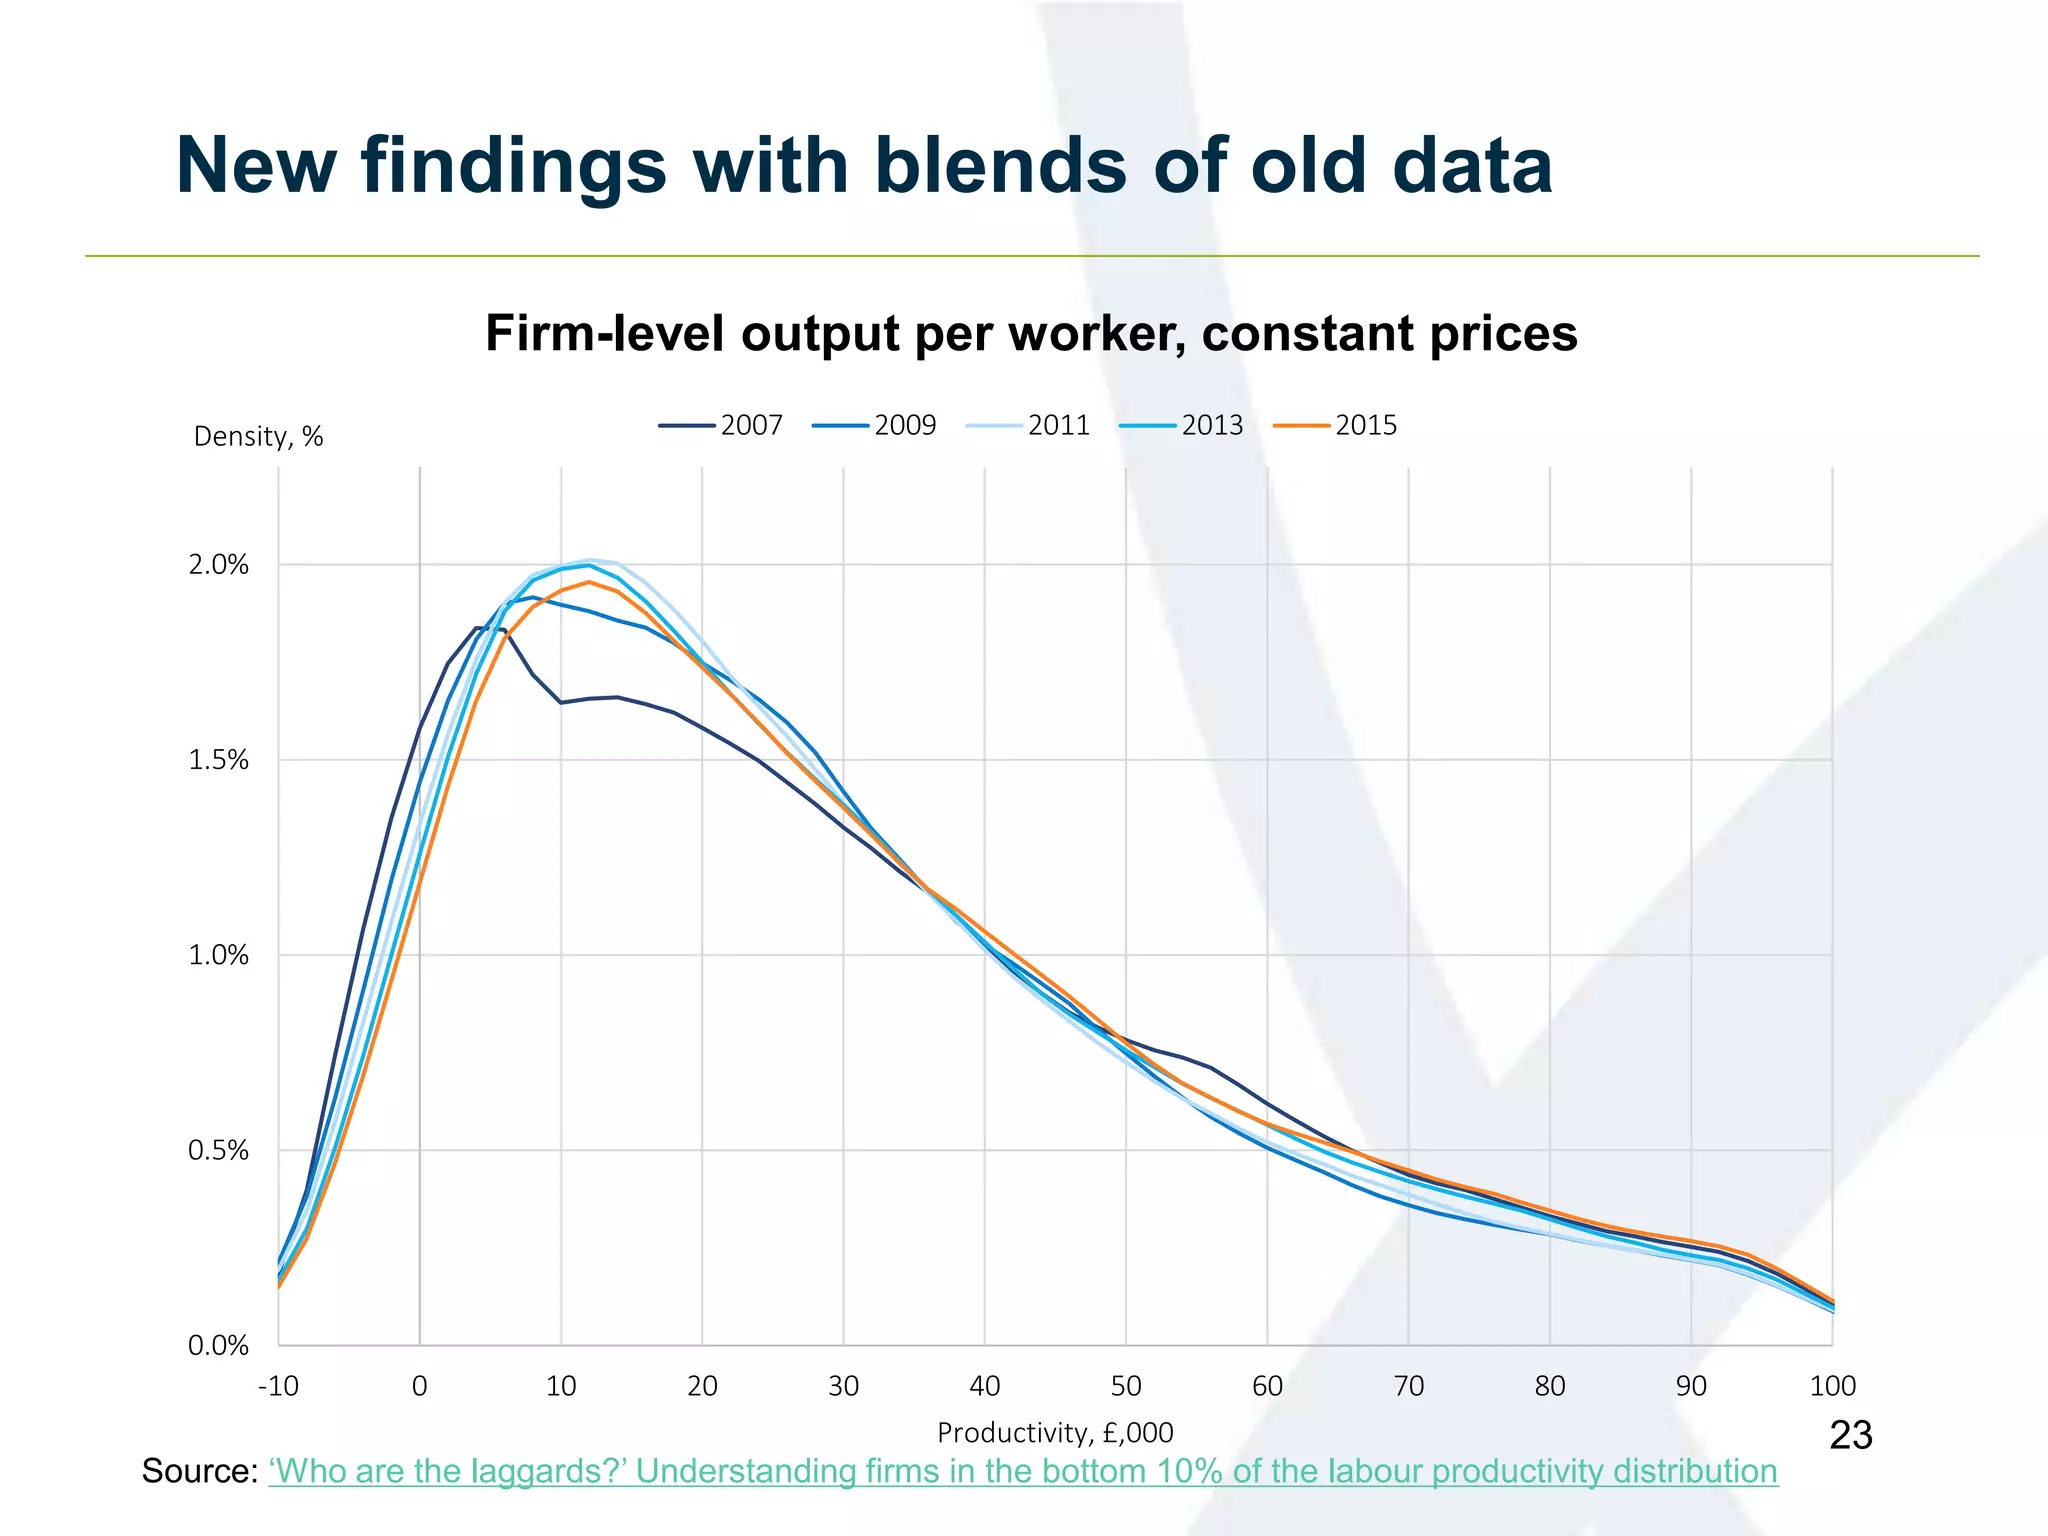
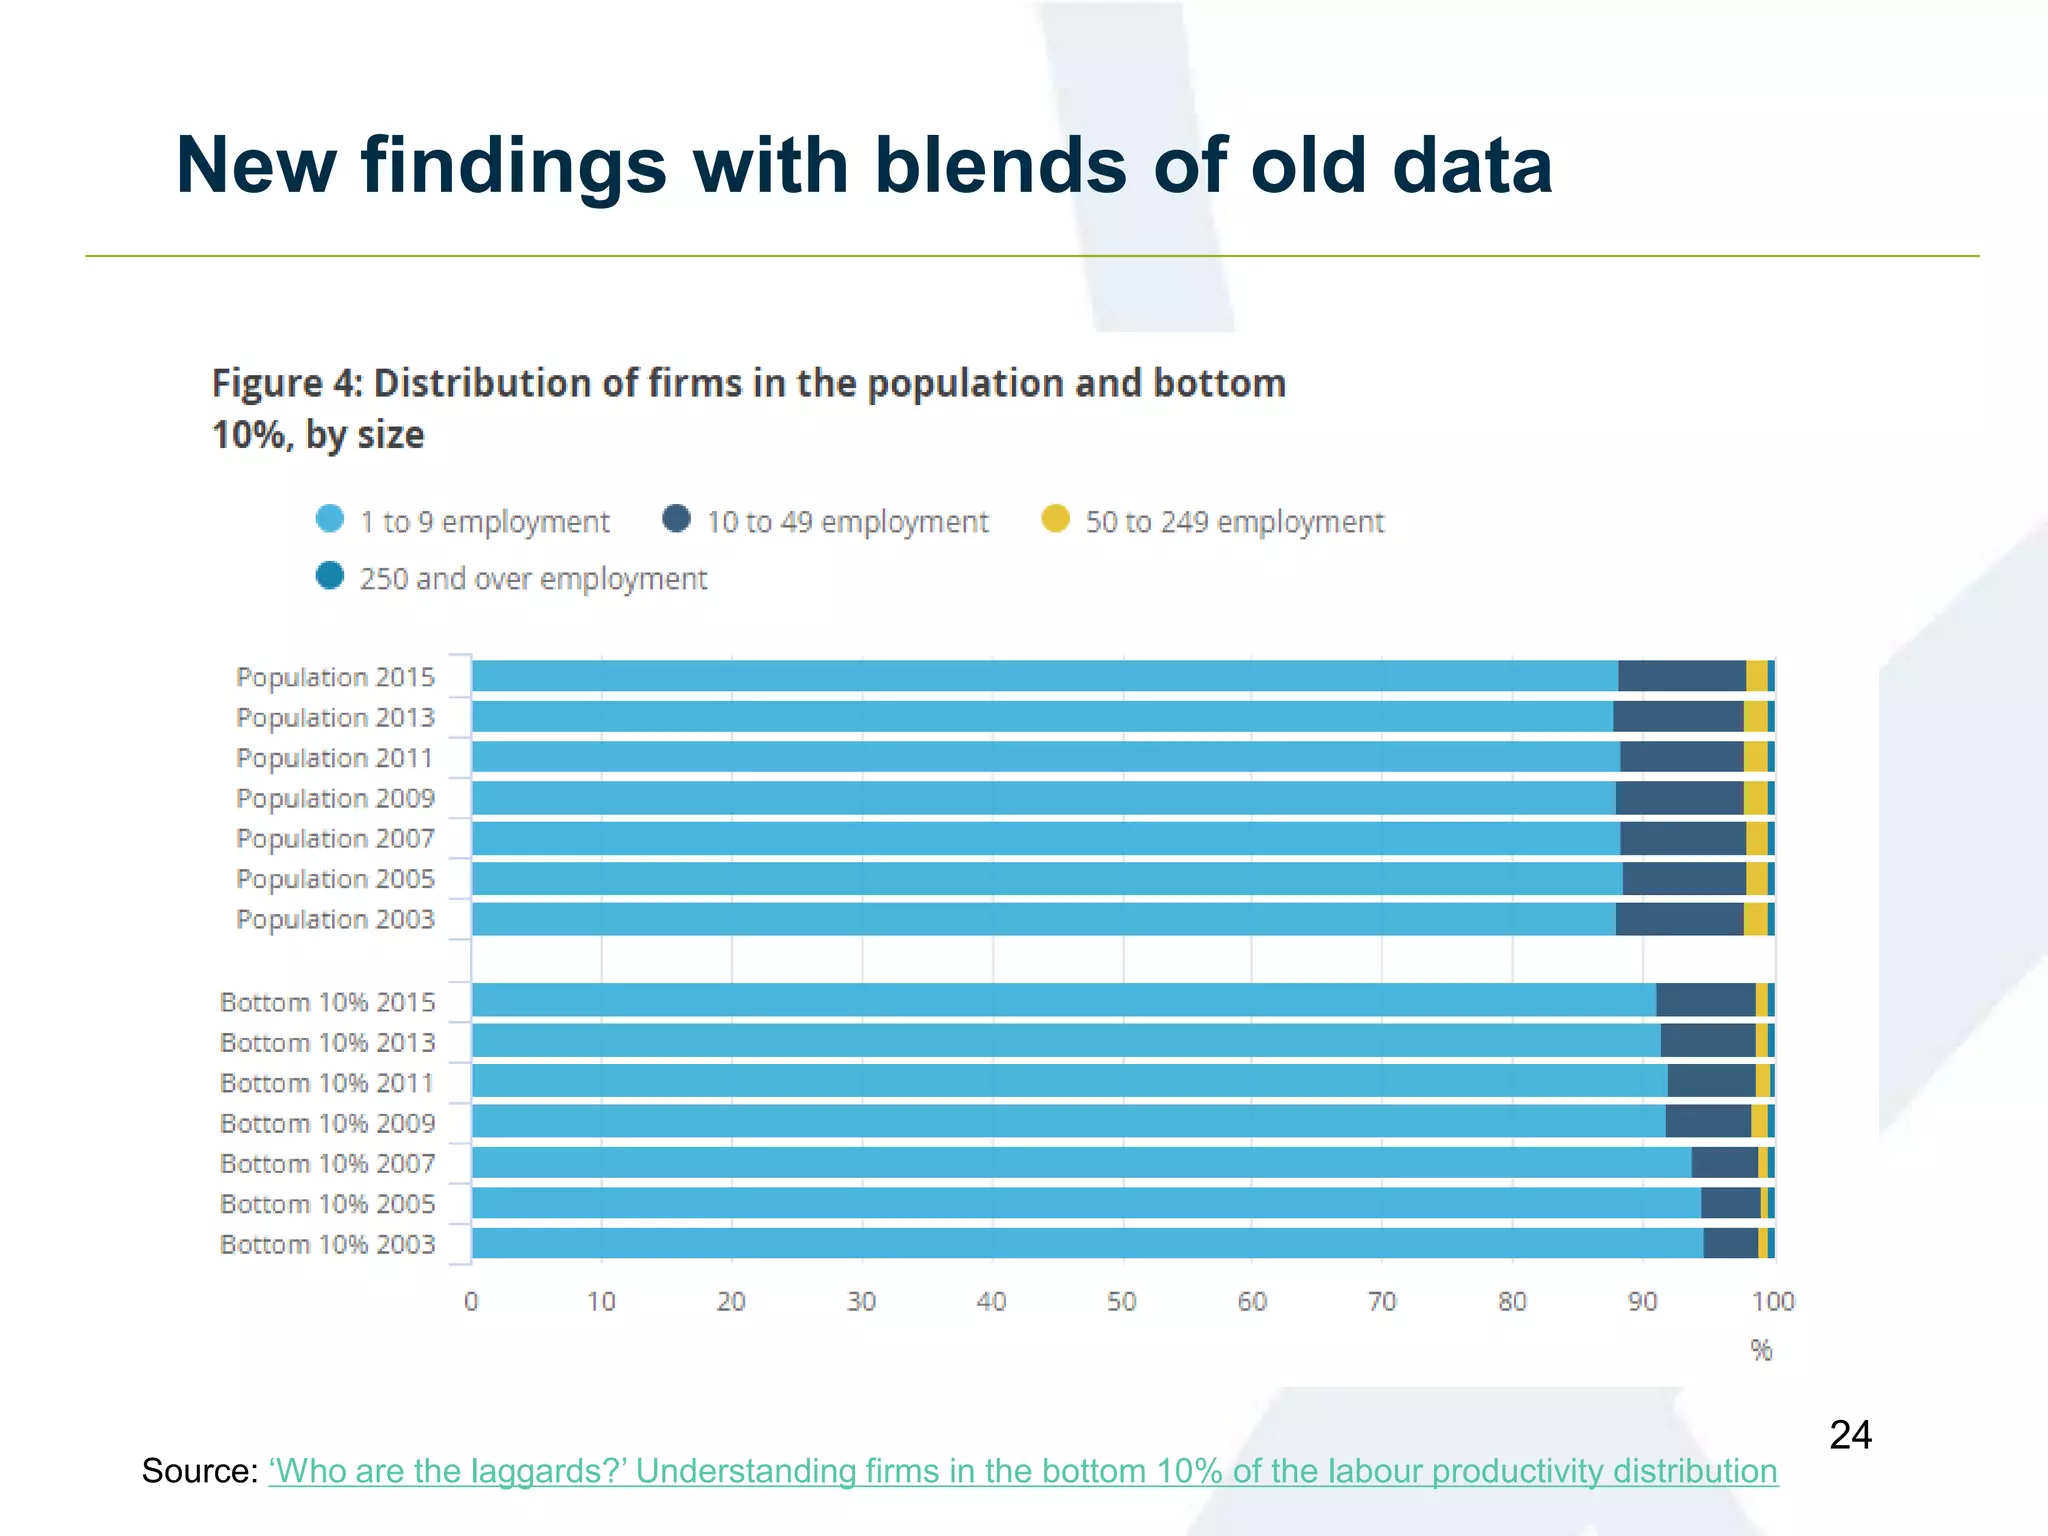
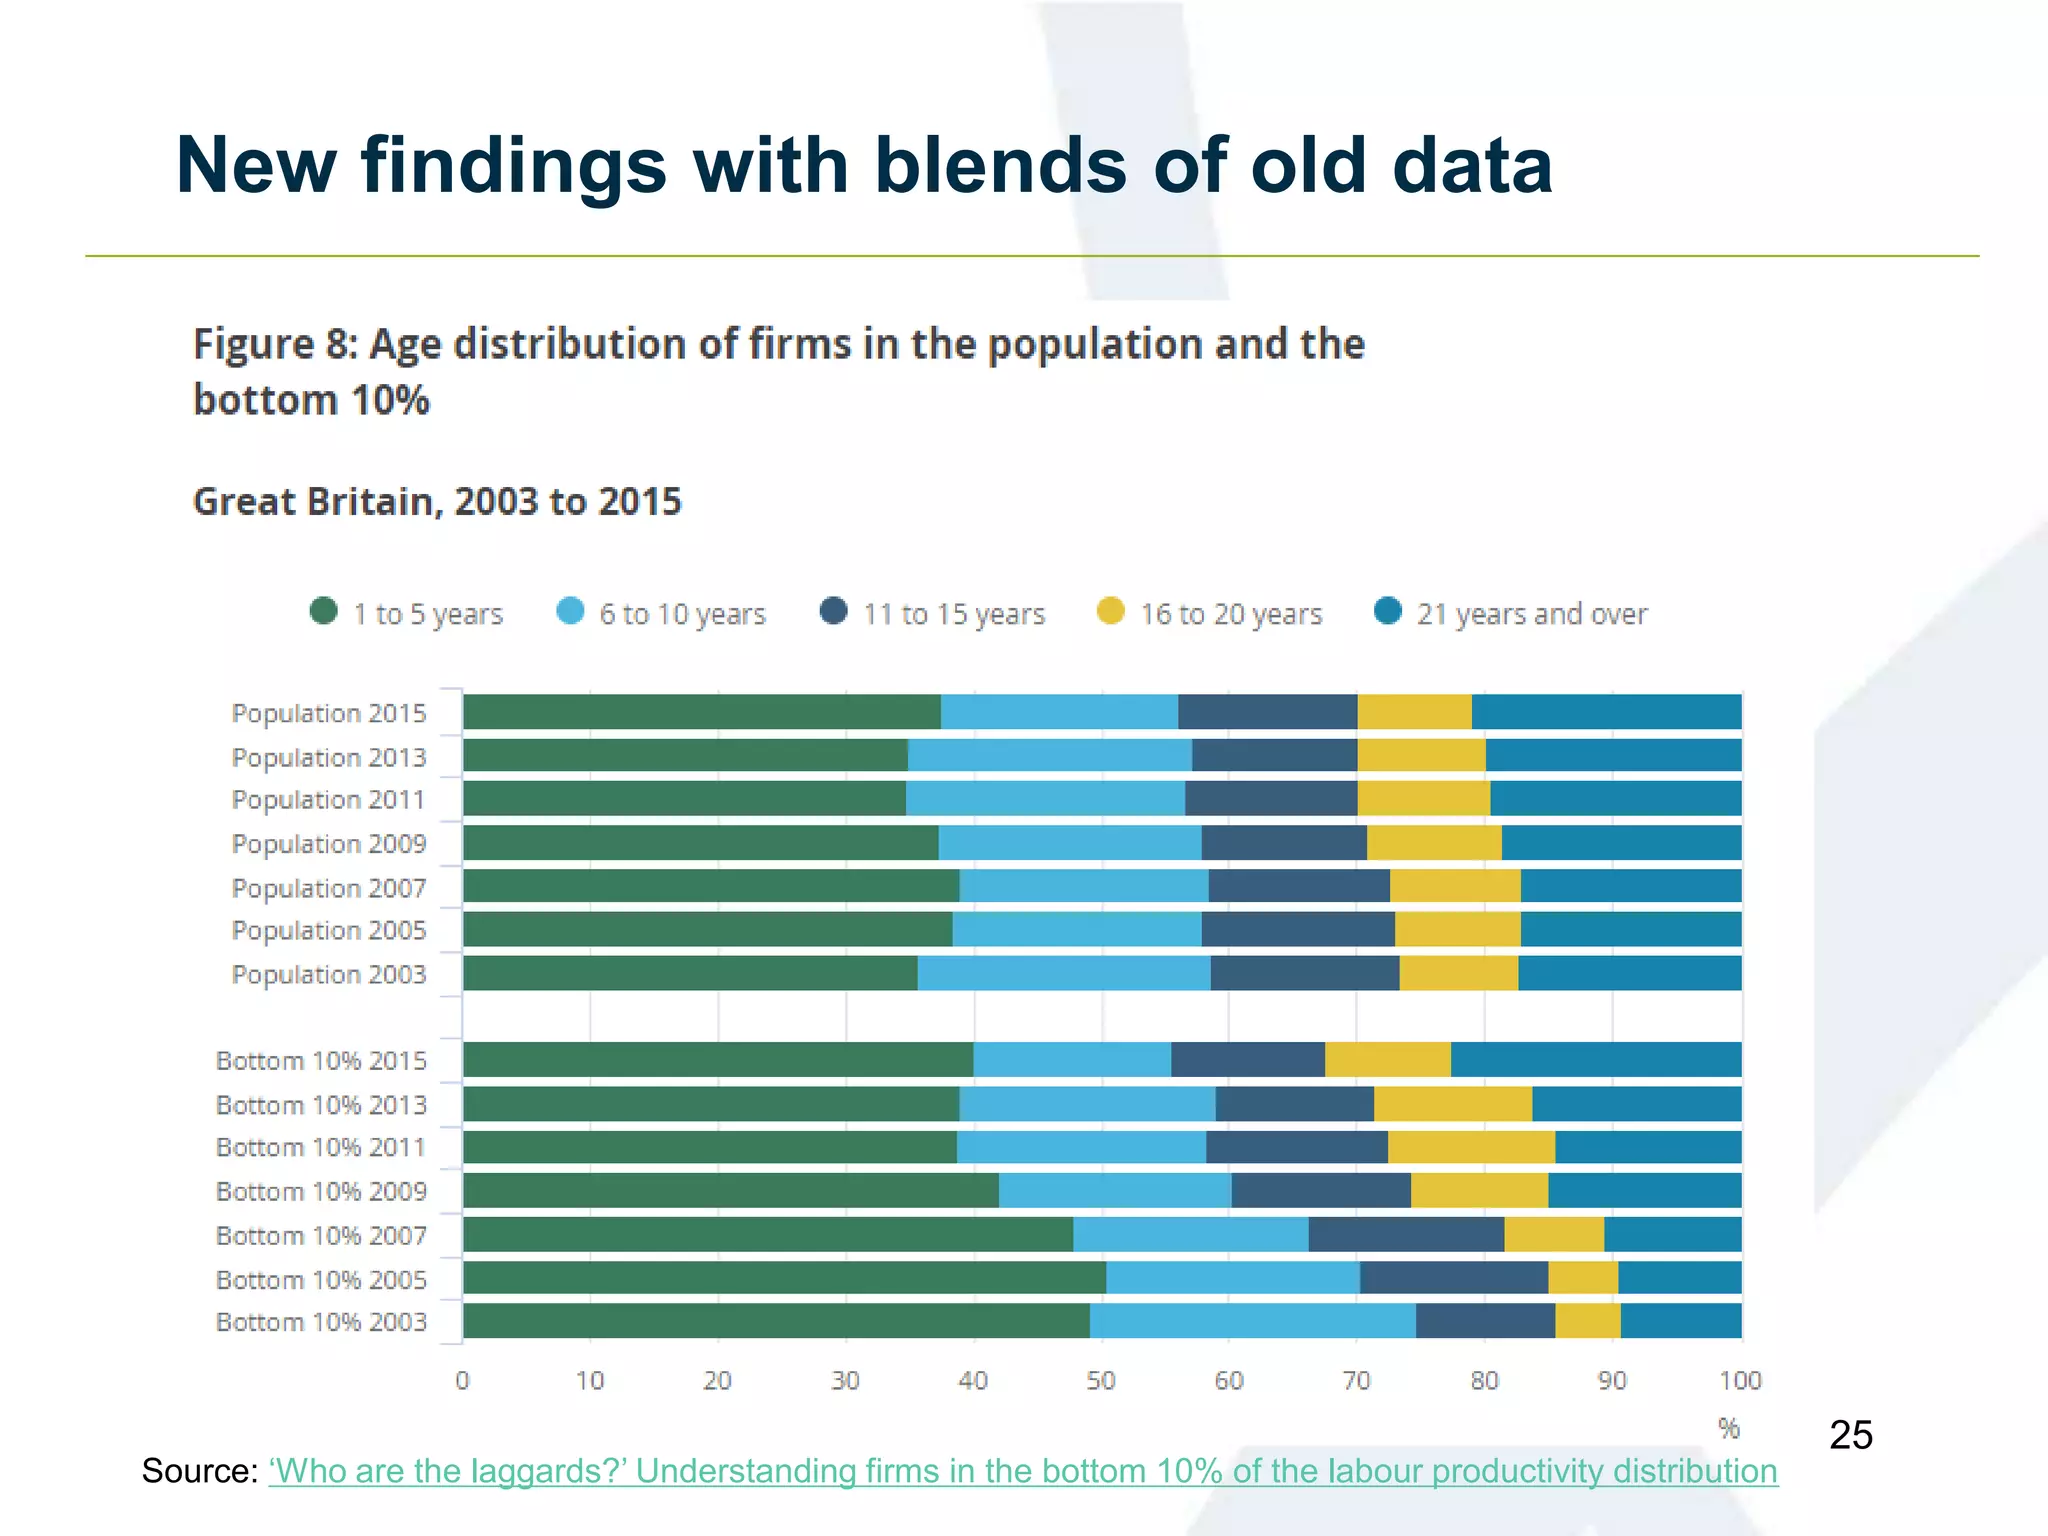
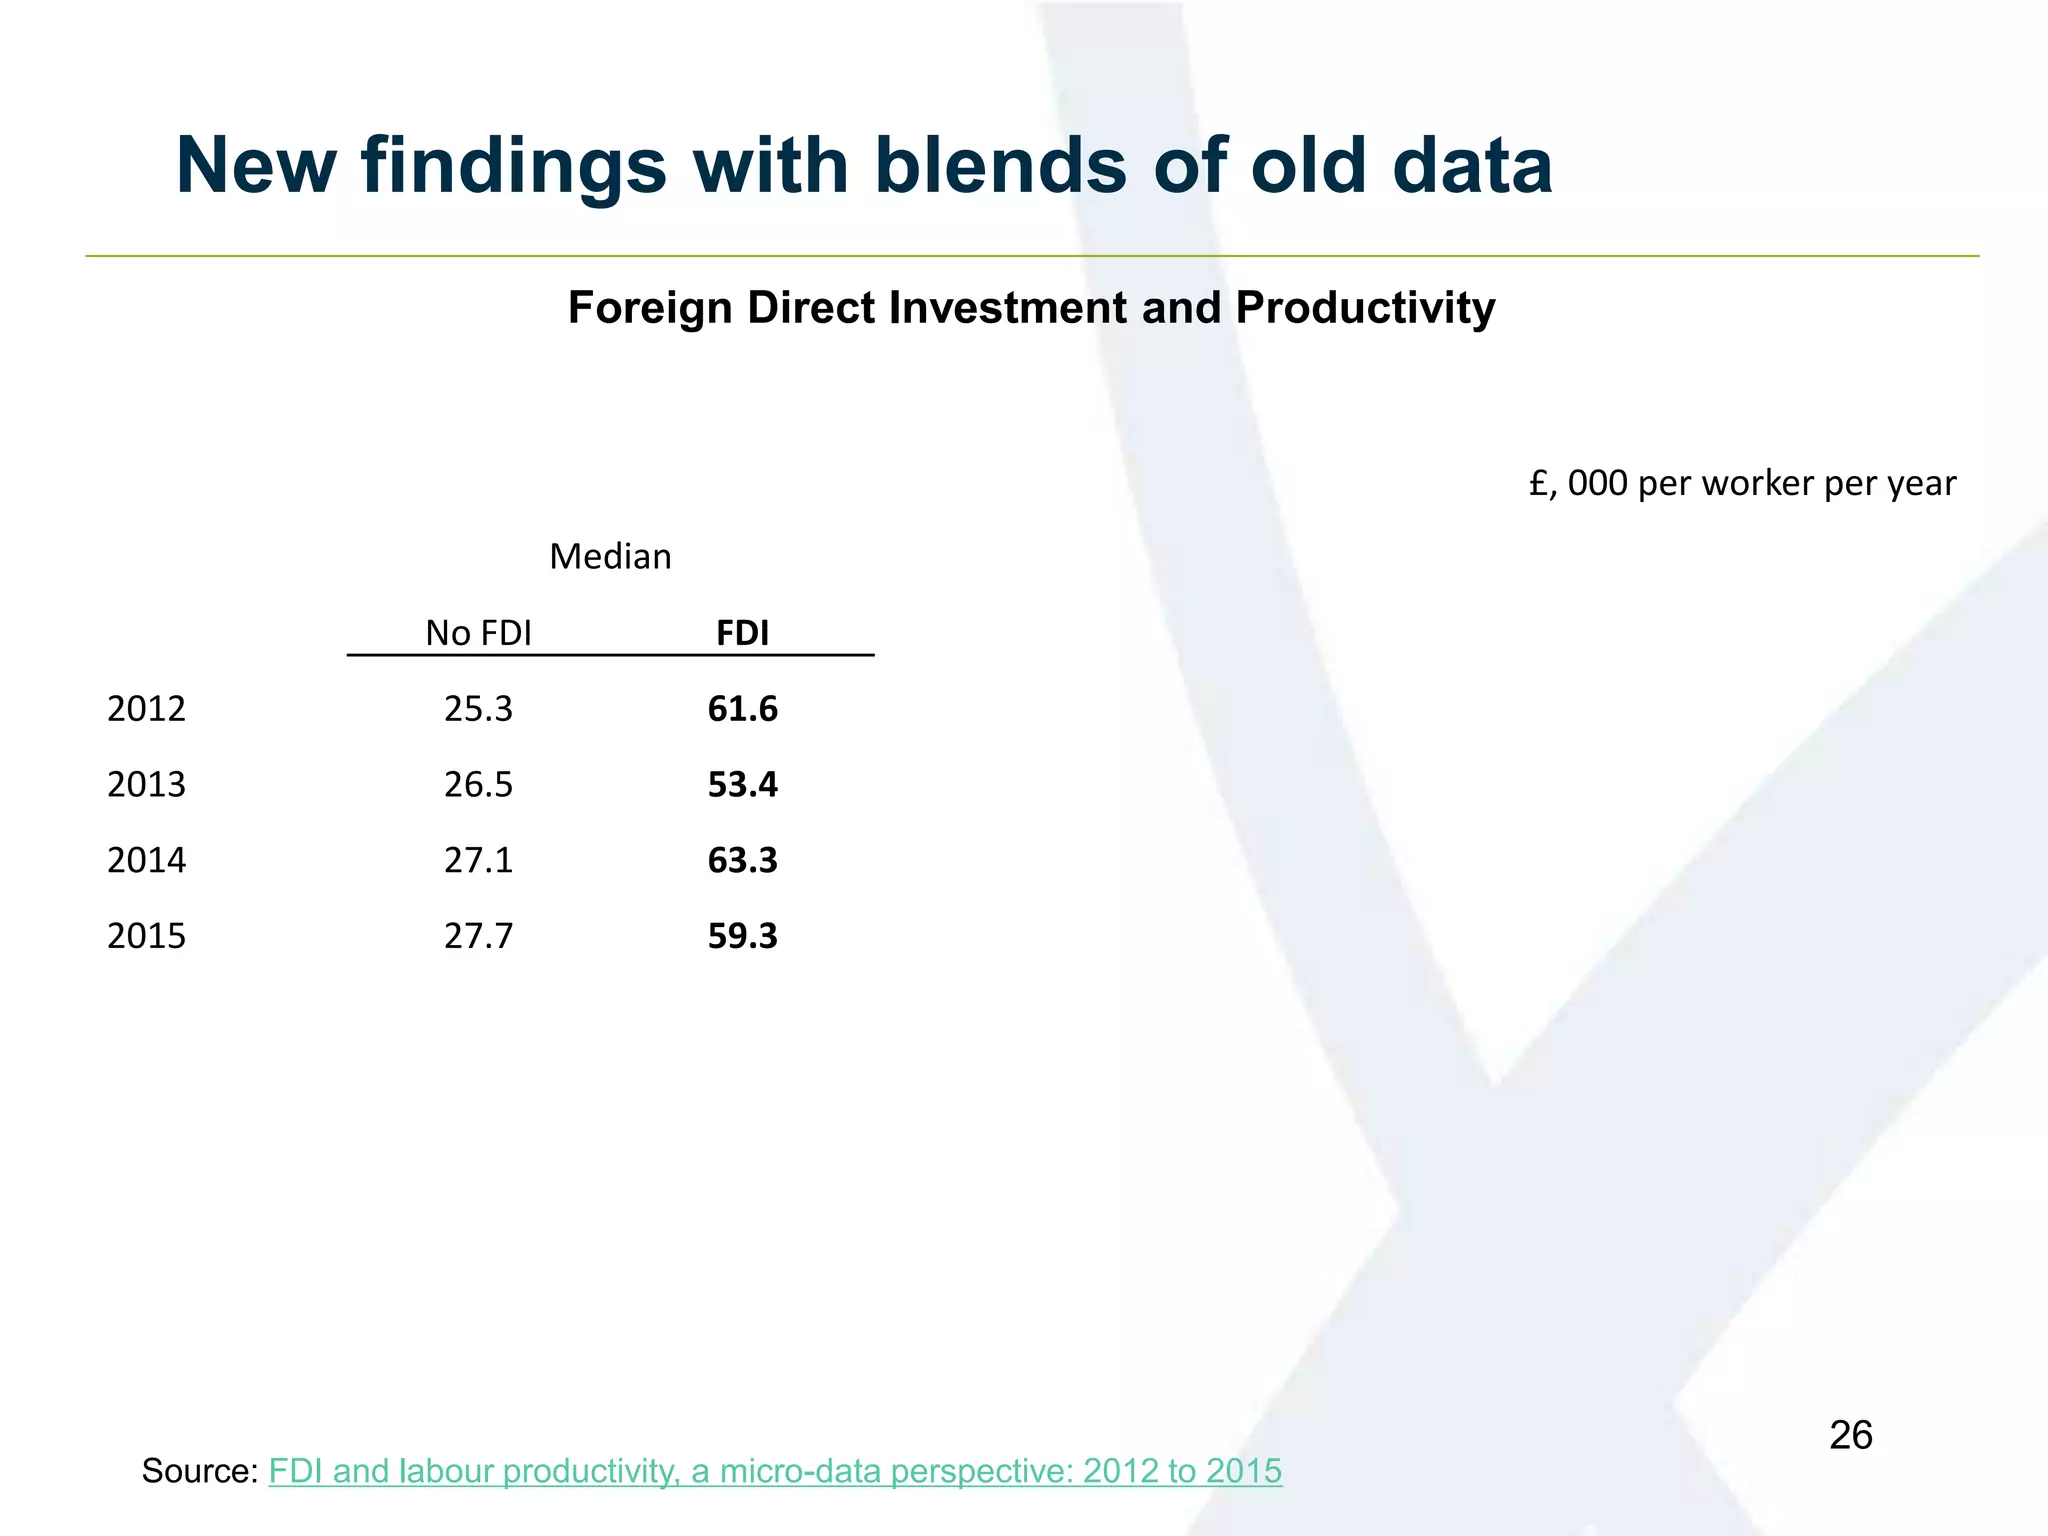
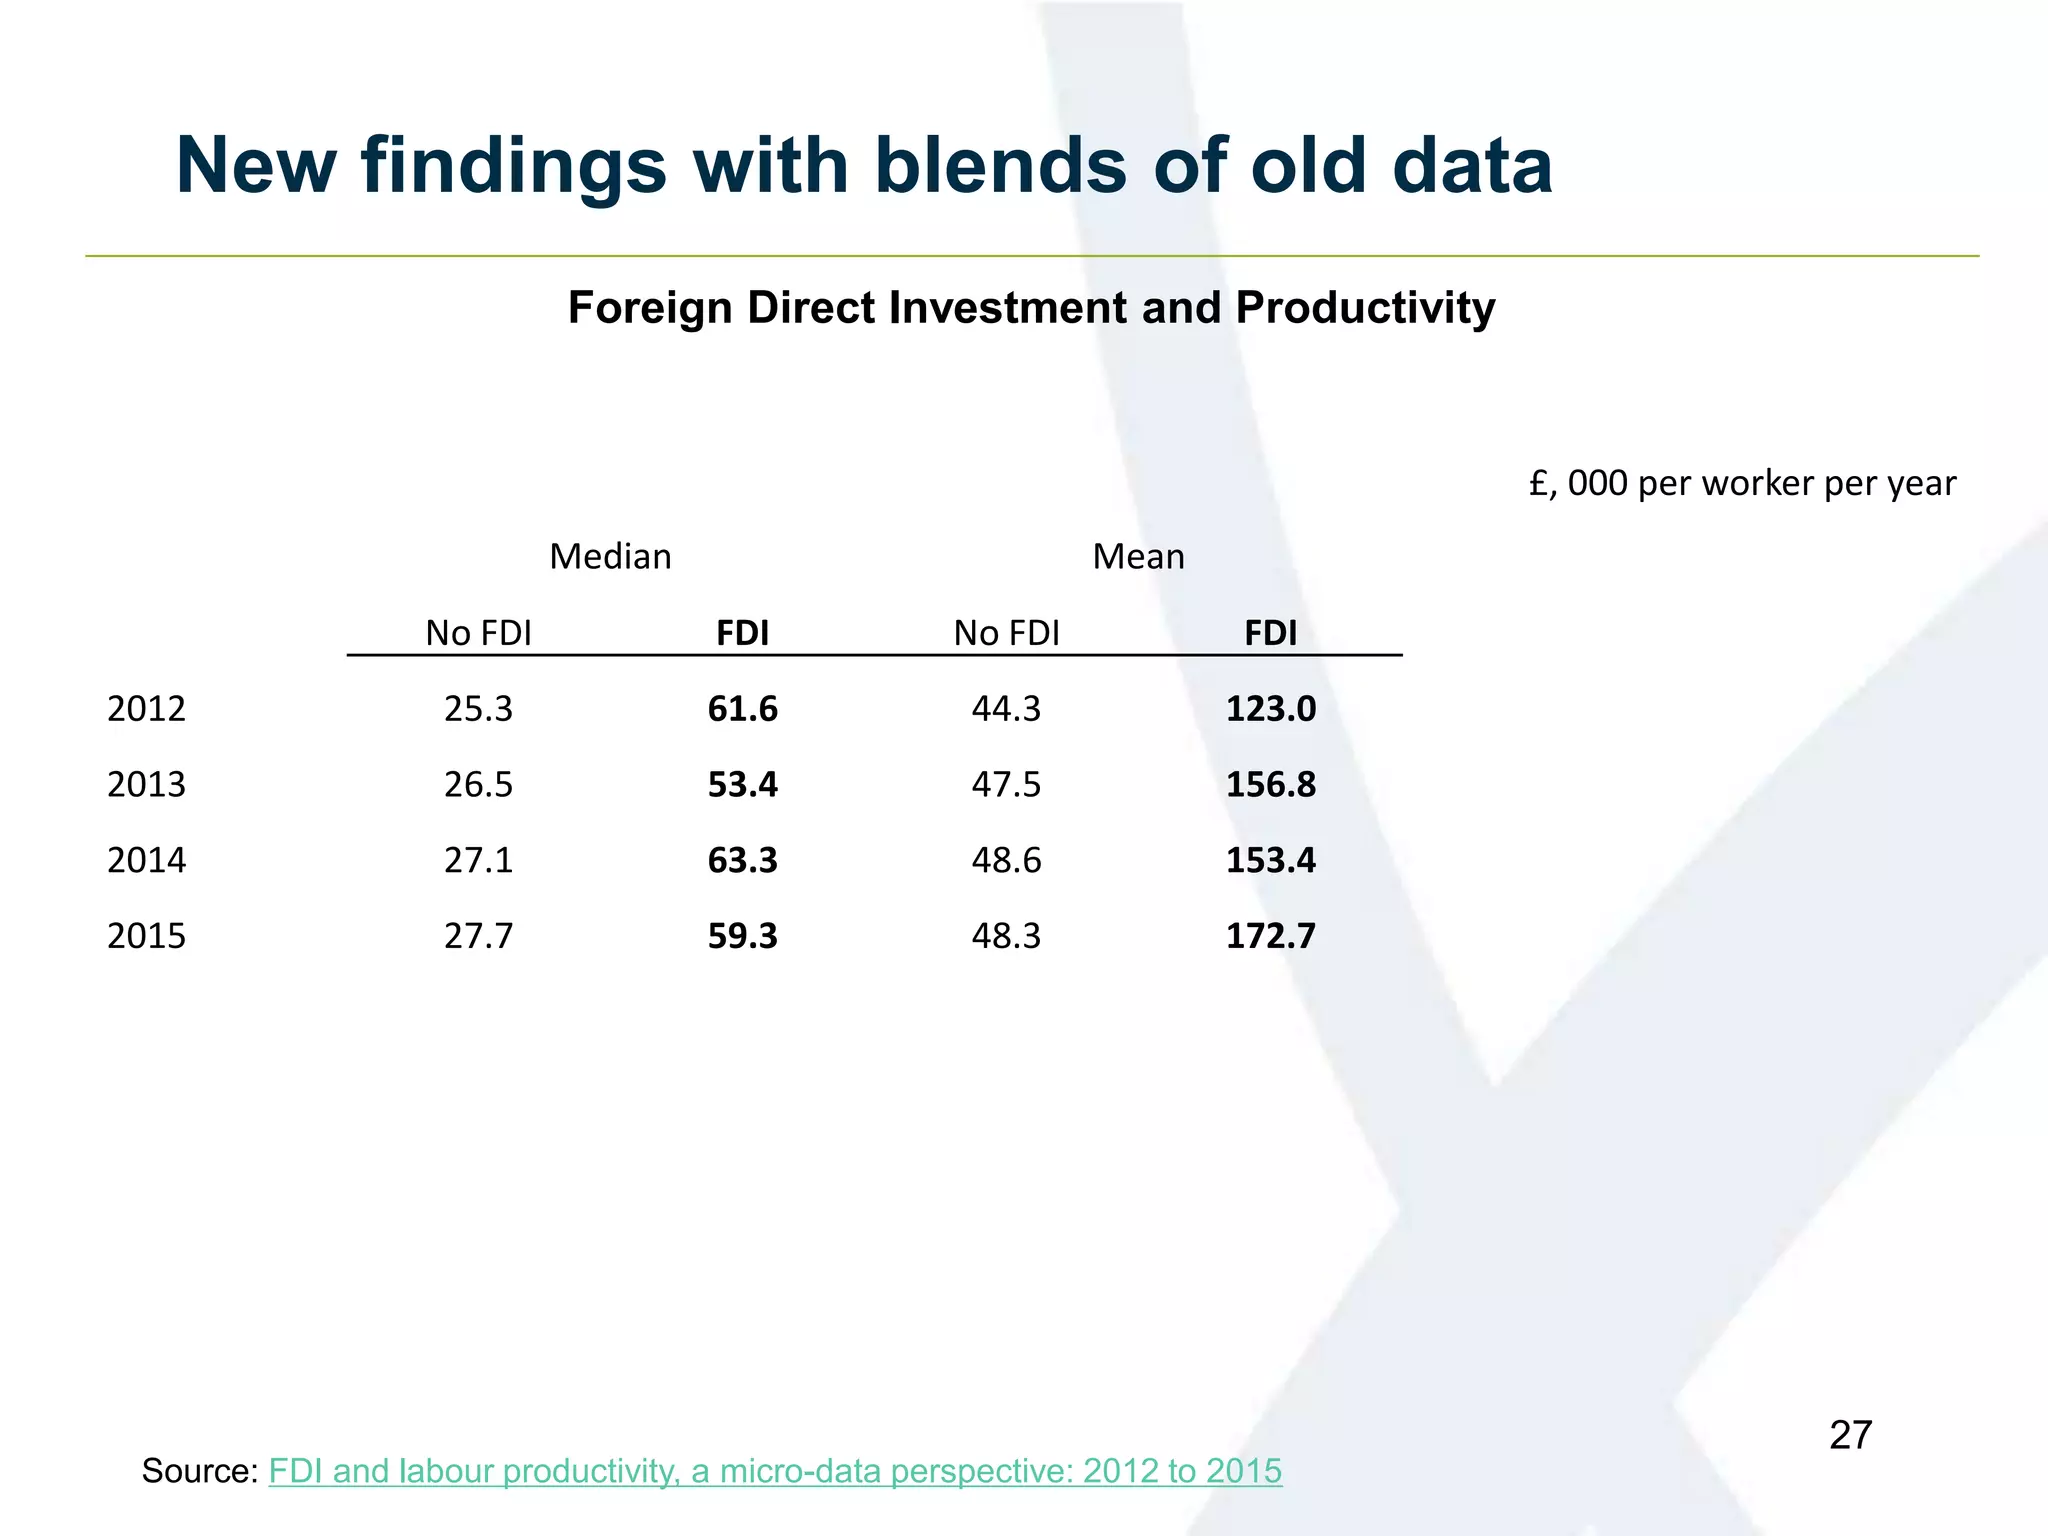
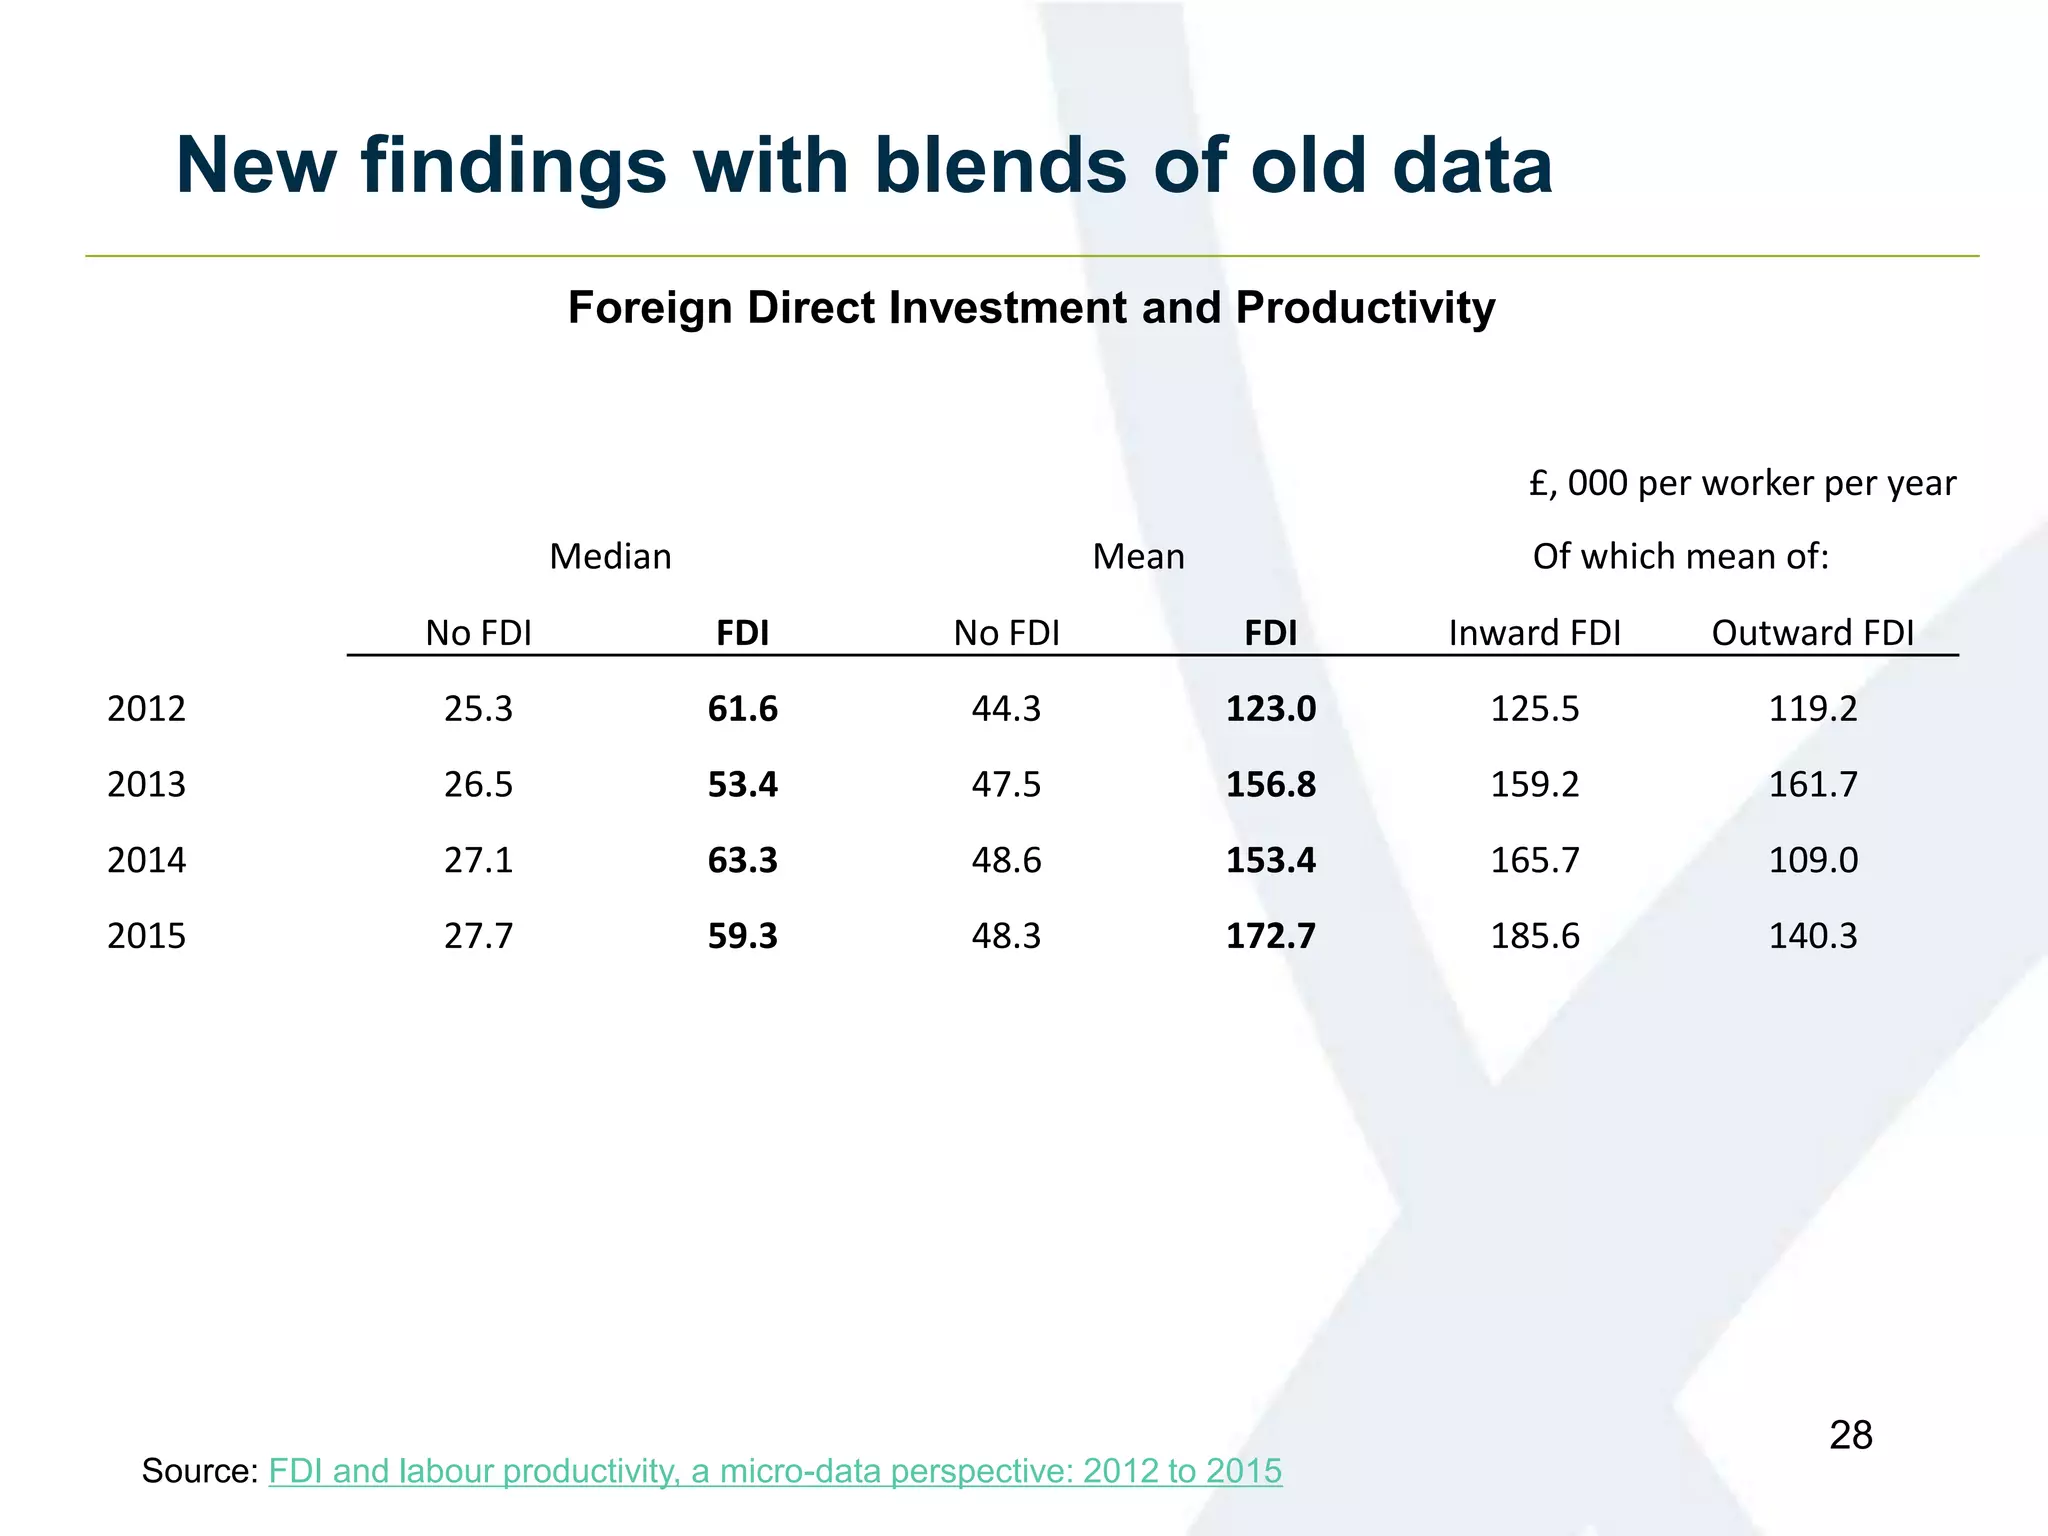
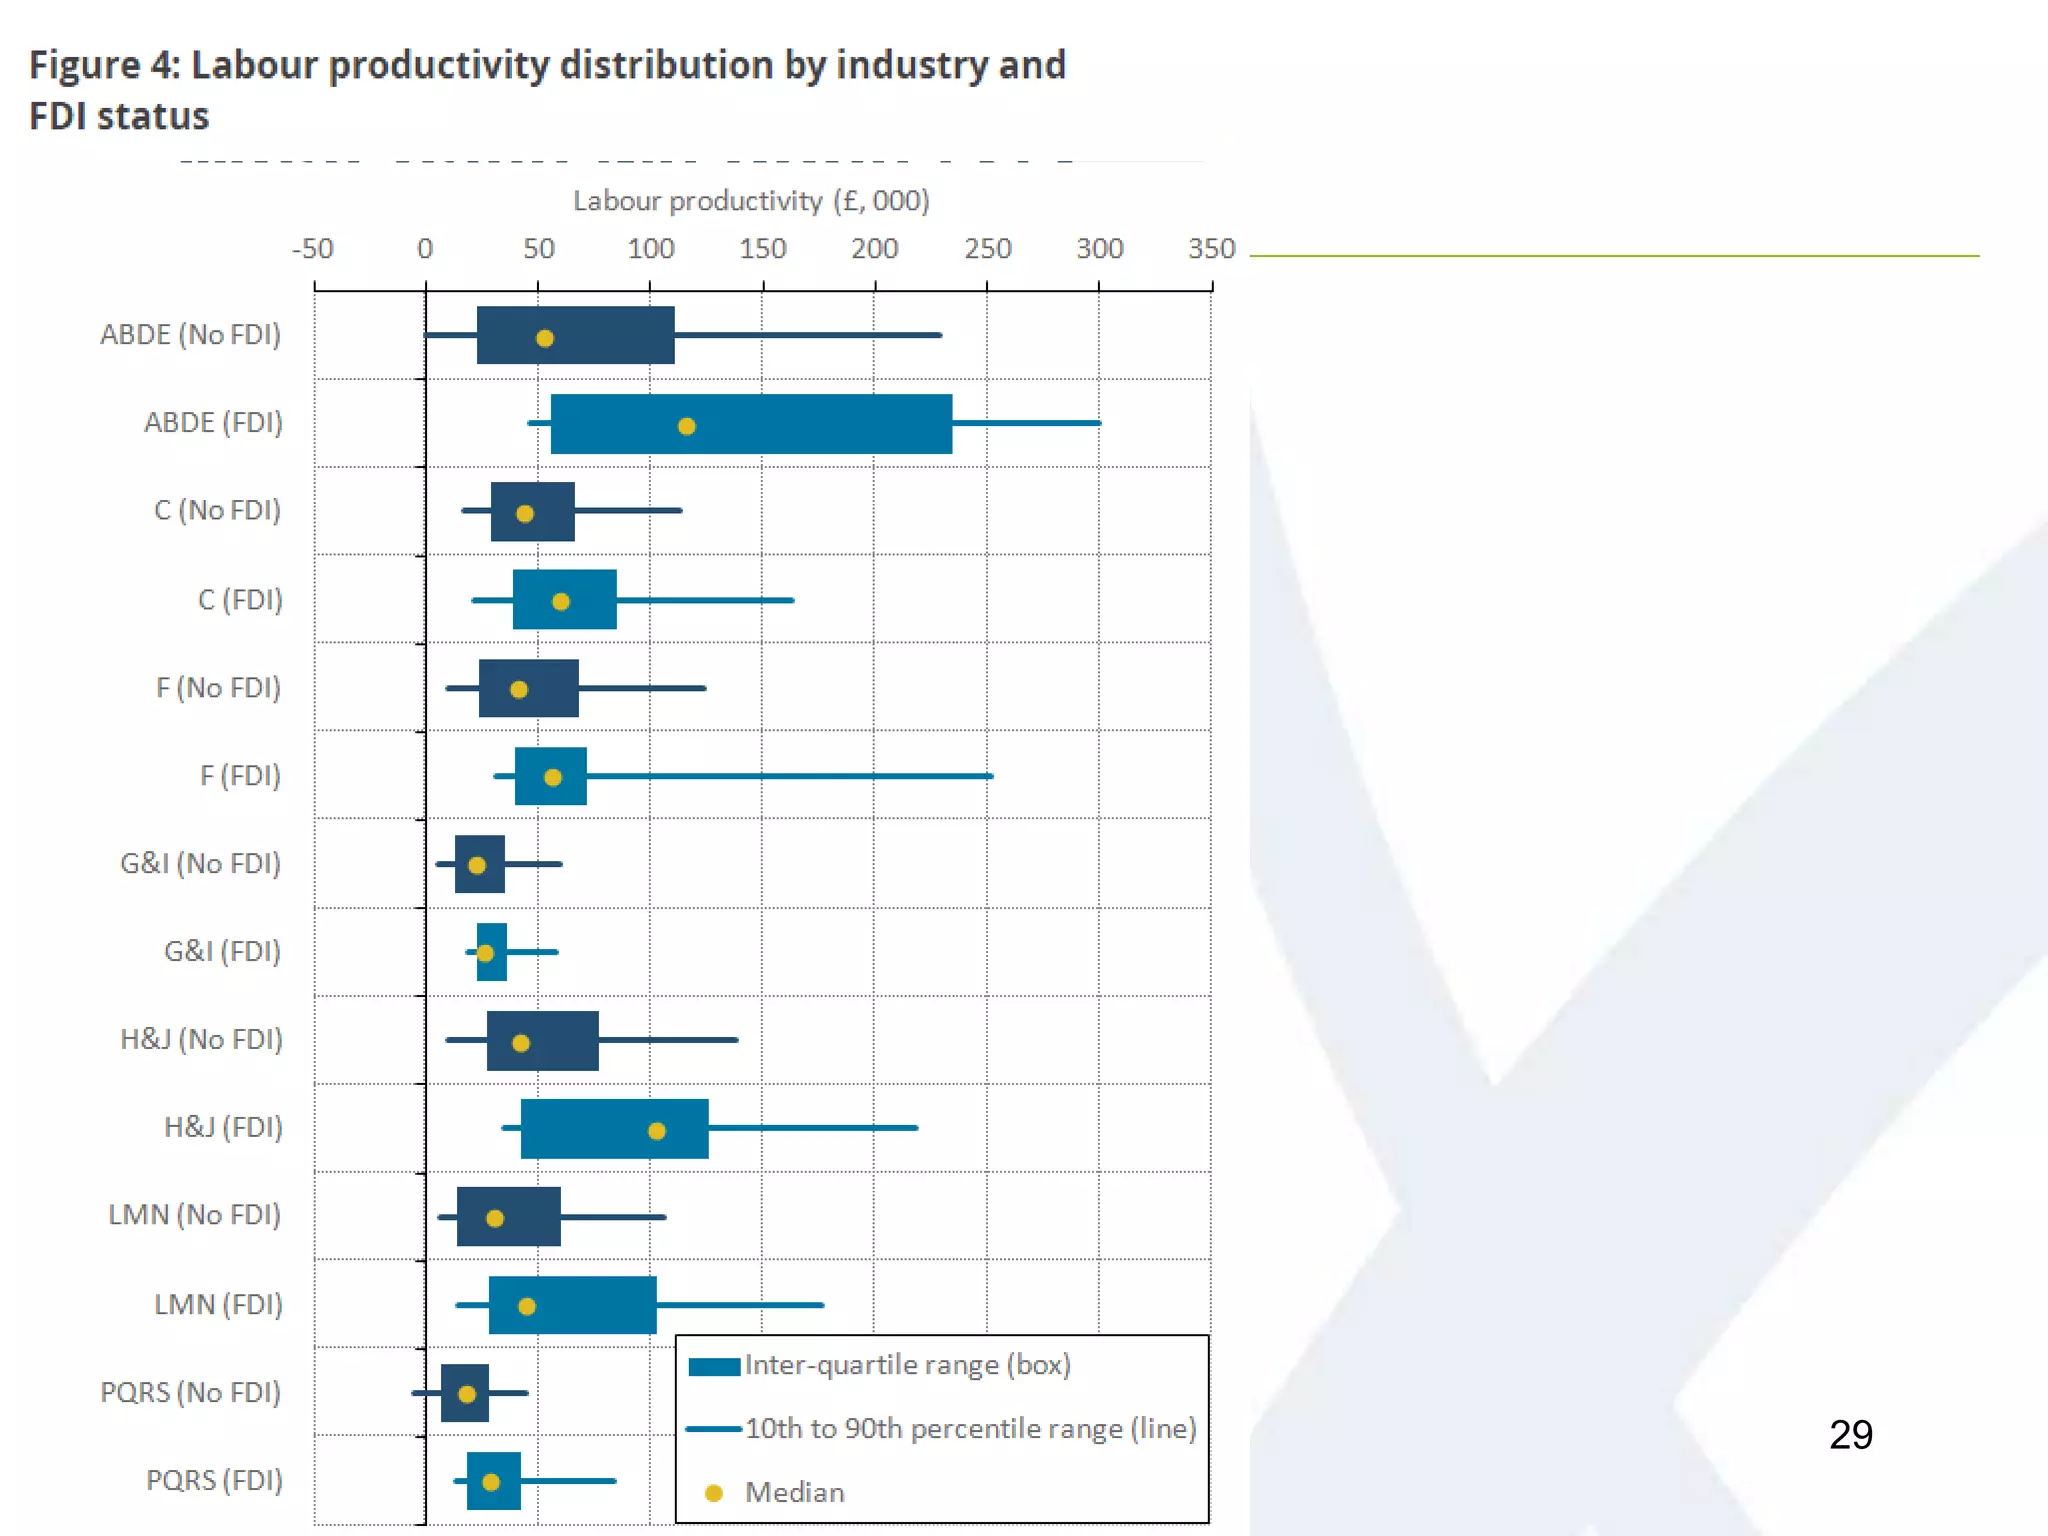
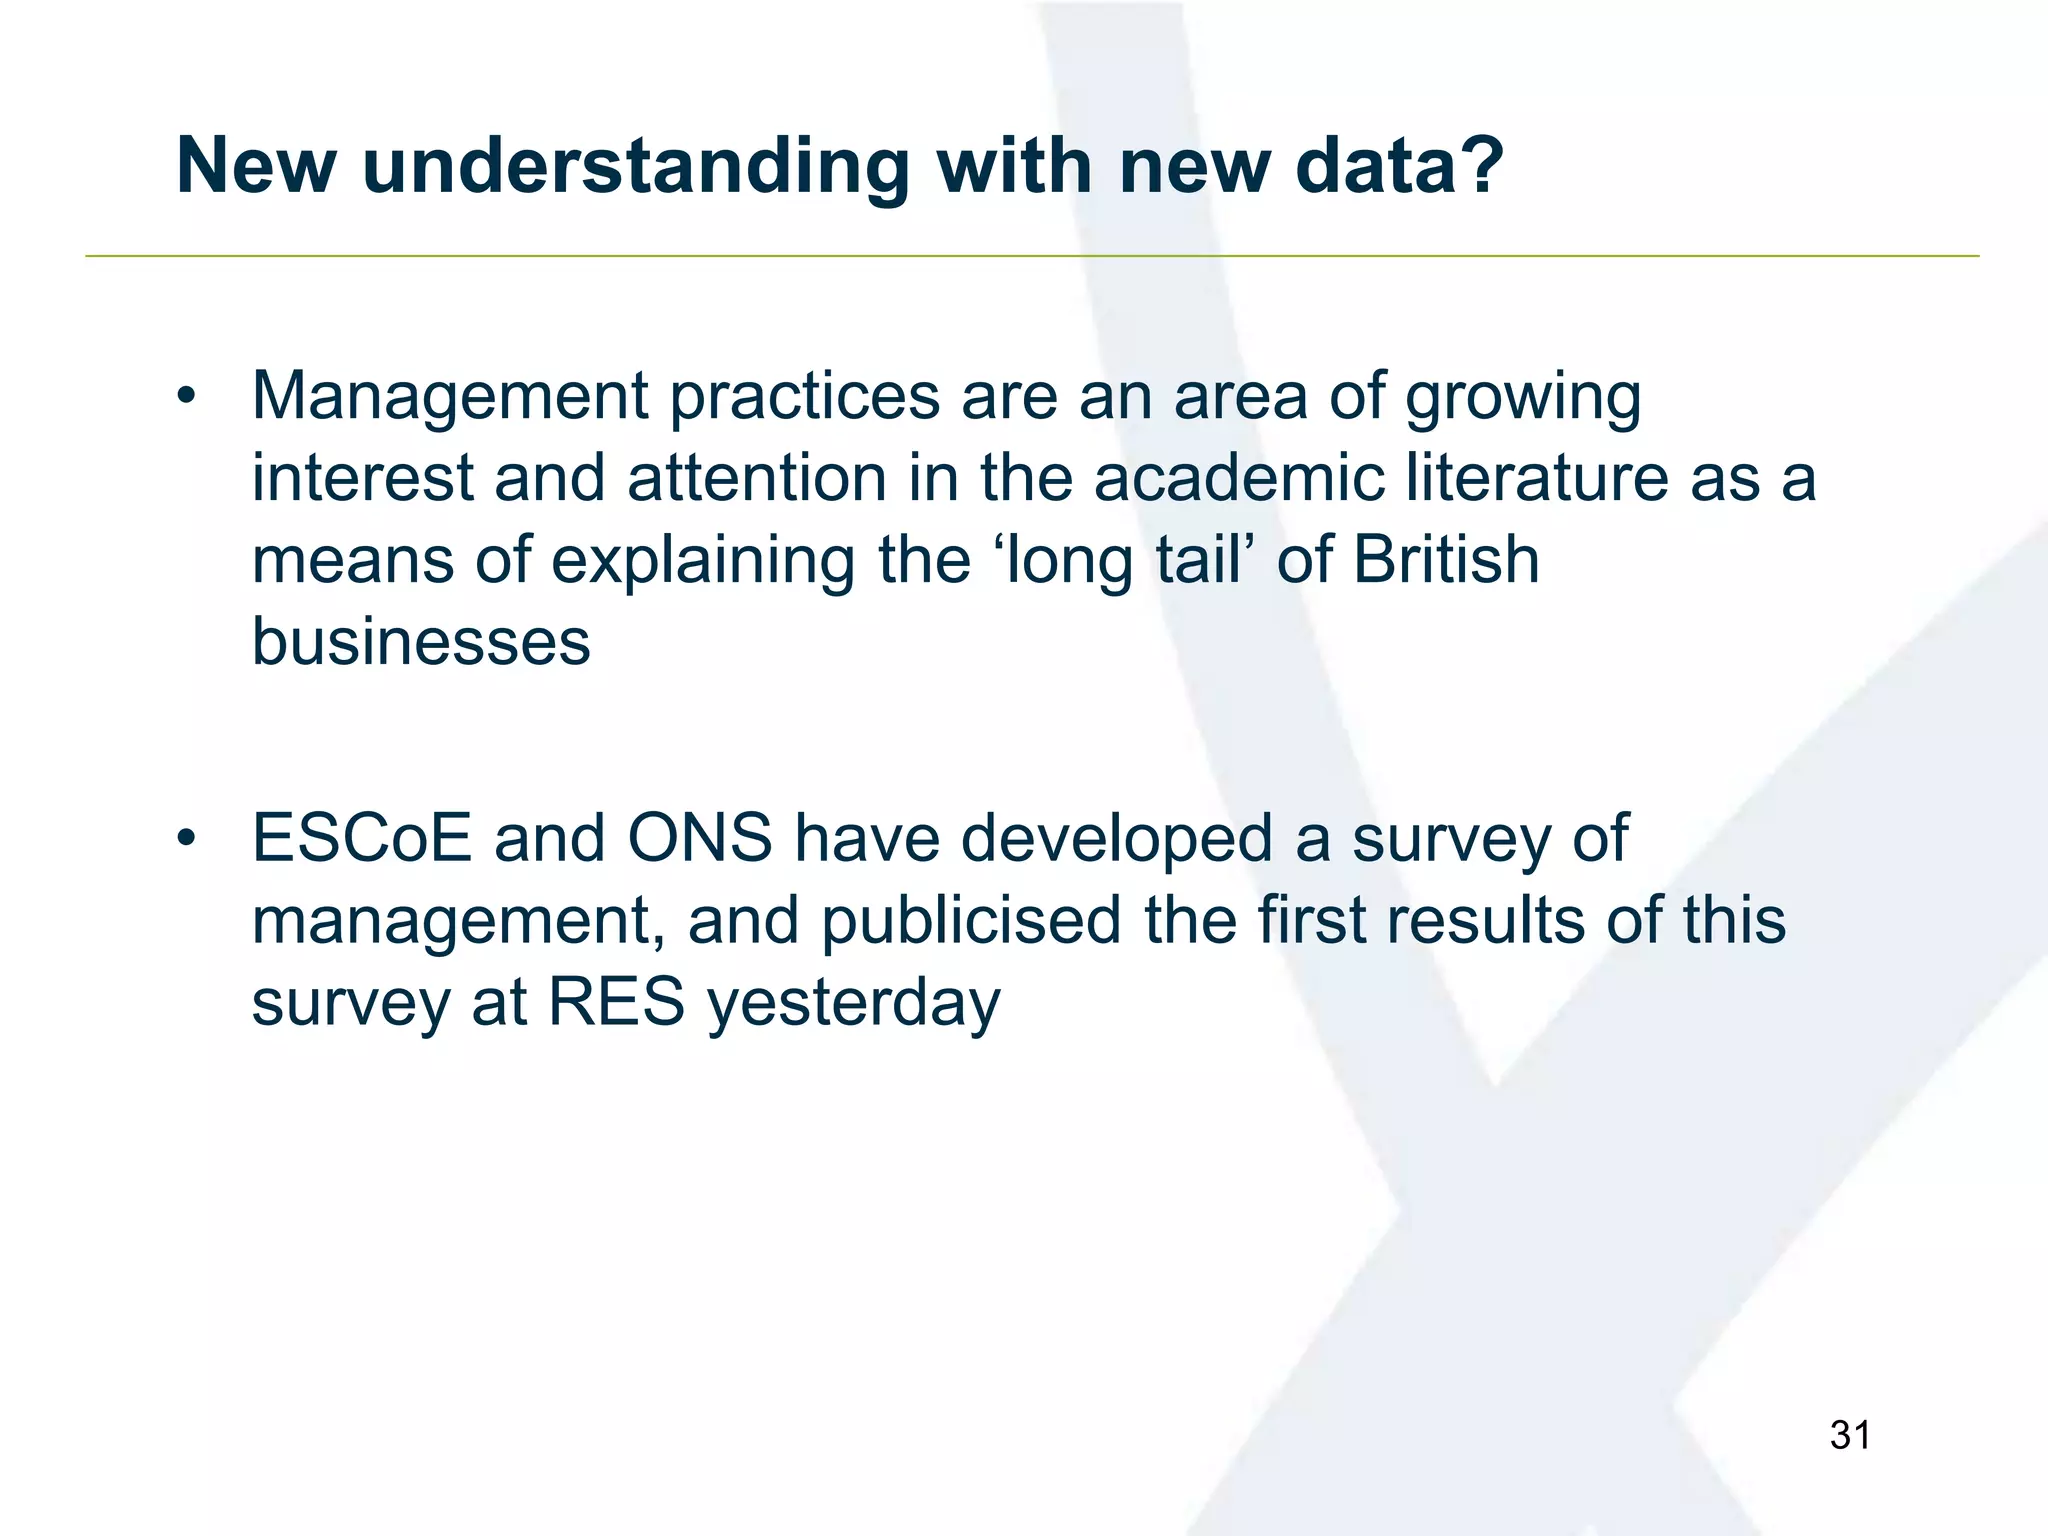
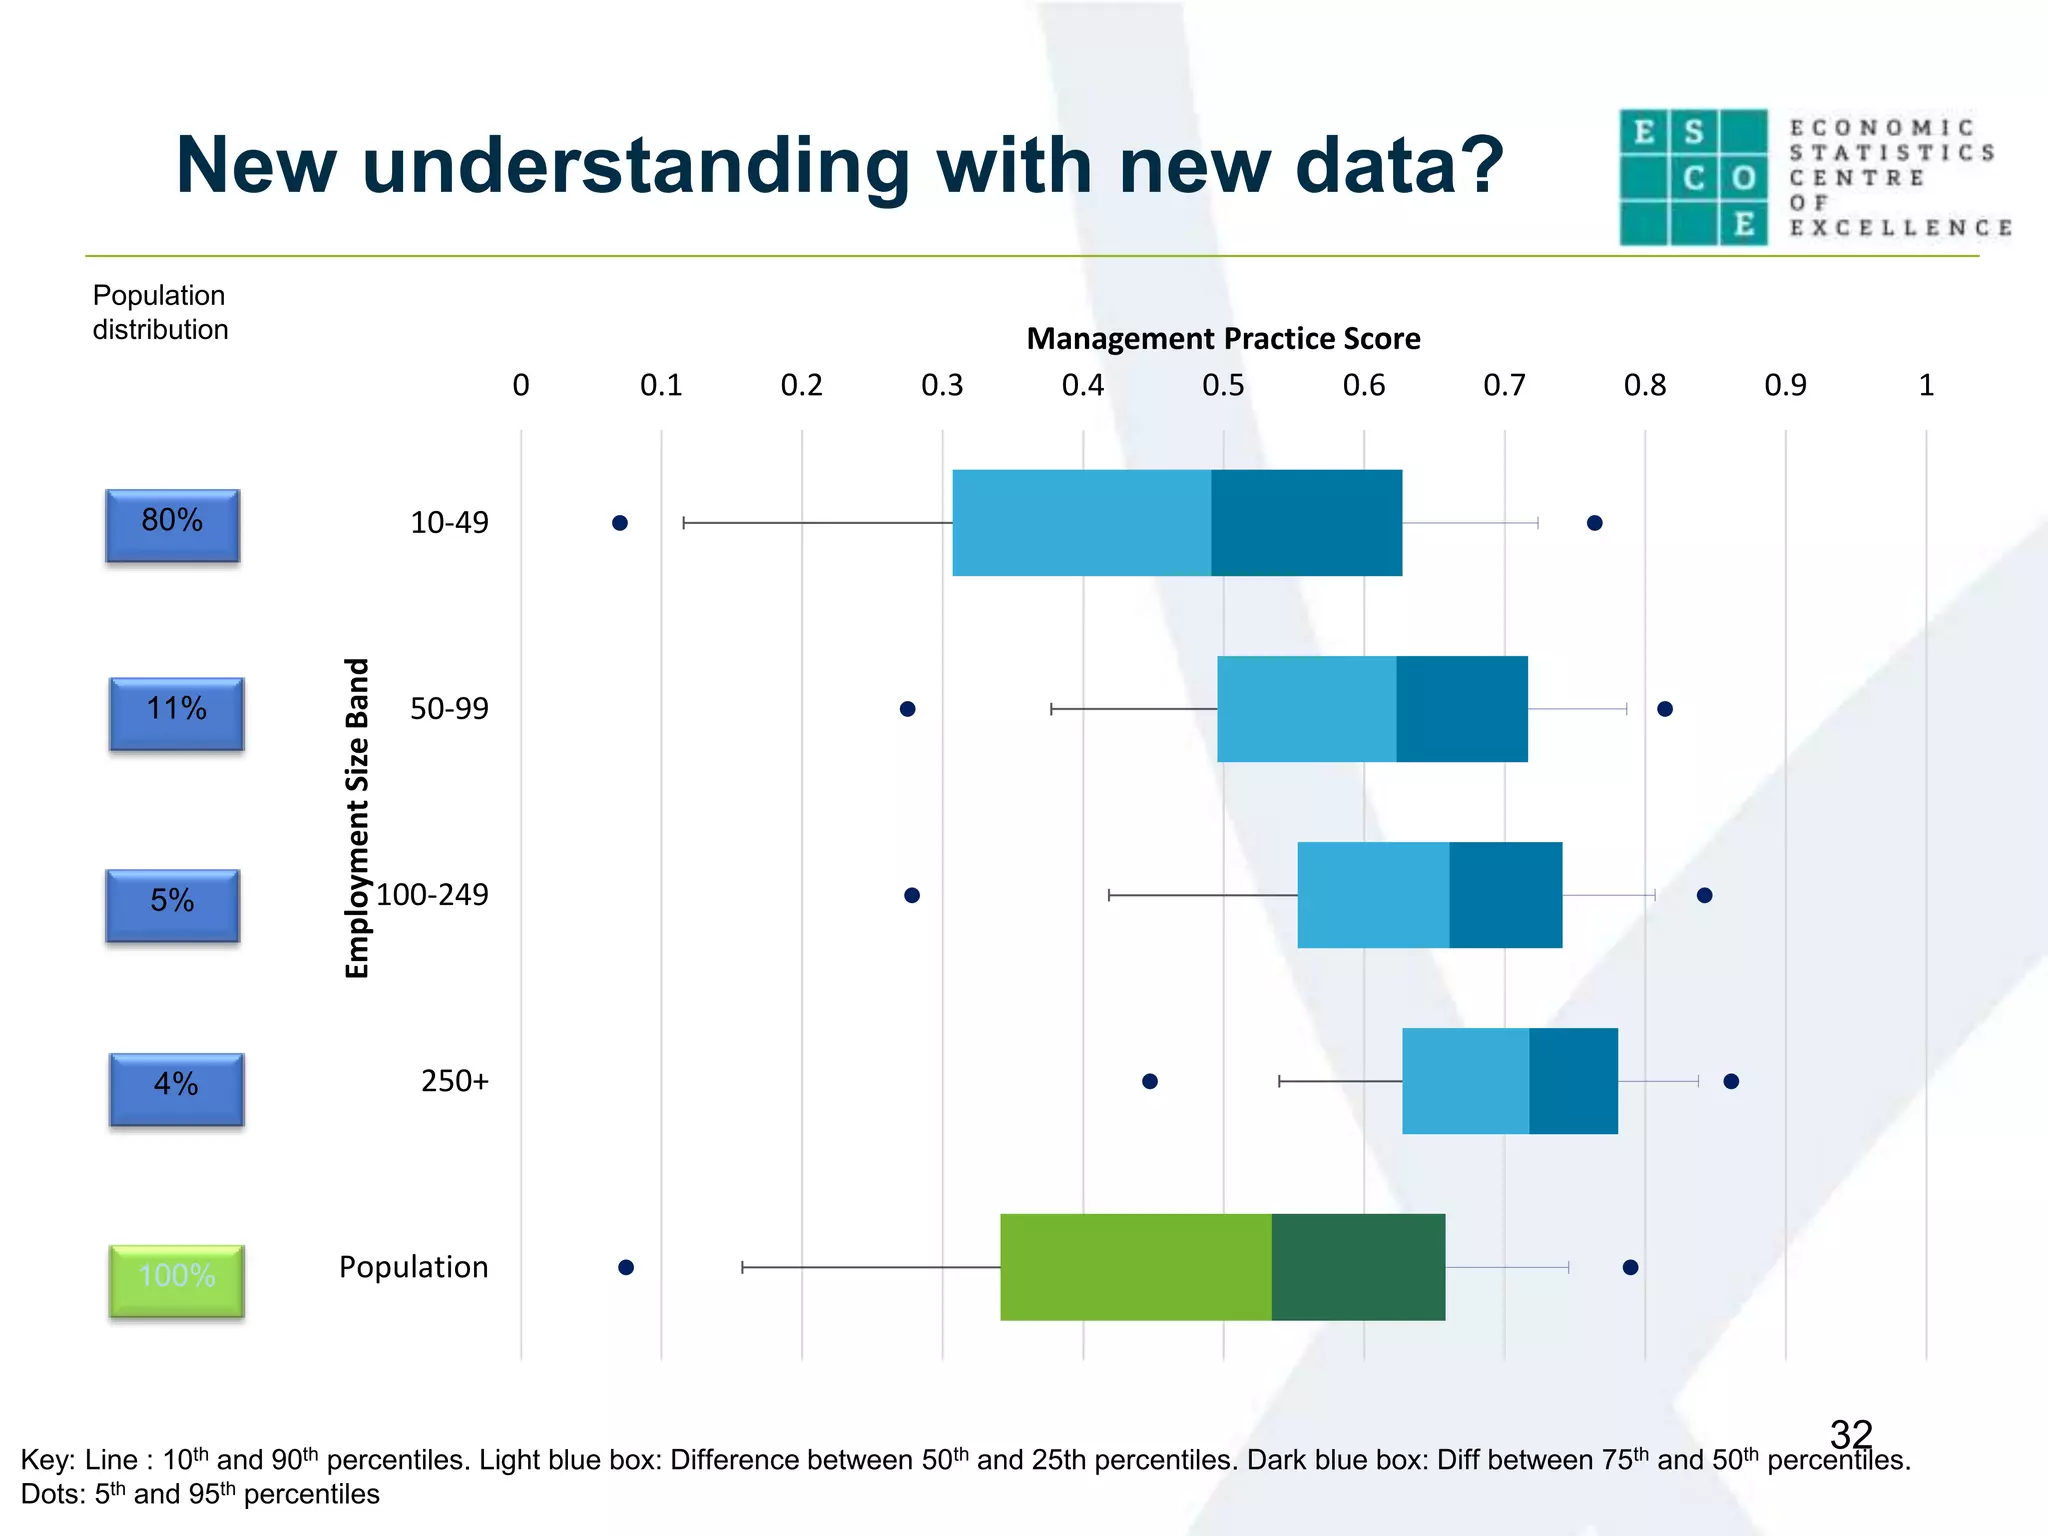
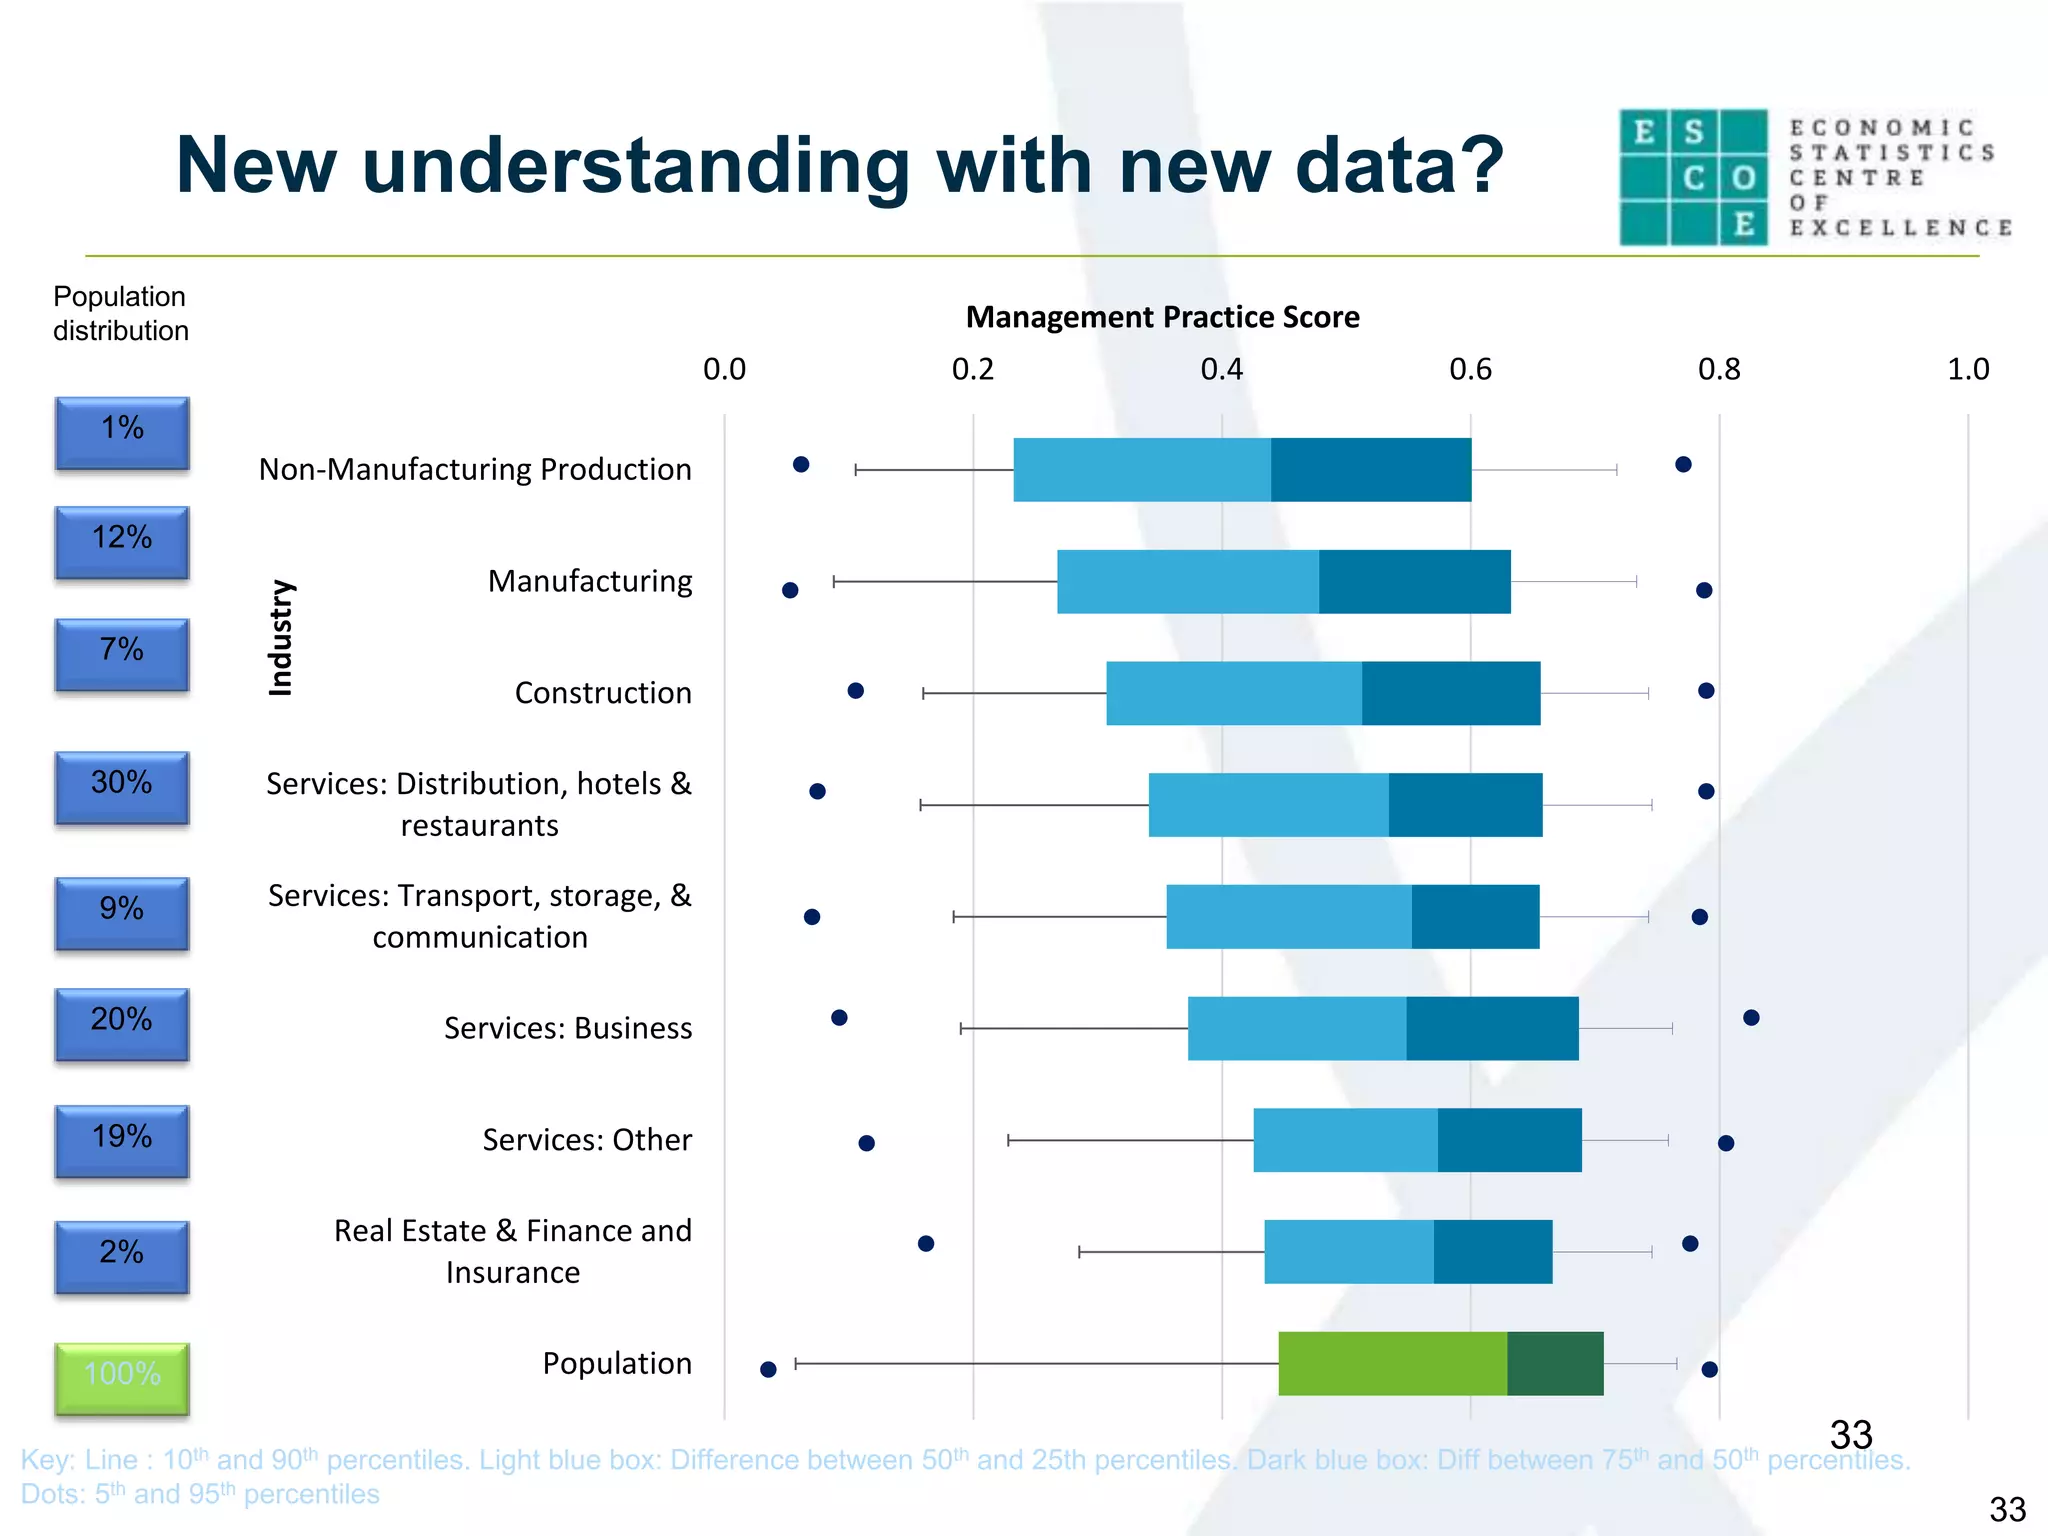


The document discusses the challenges of UK labor productivity, highlighting a significant productivity gap and disparities among businesses. It presents new aggregates and blends of existing data to provide insights into productivity performance and its drivers, including foreign direct investment and management practices. The analysis indicates a need for more detailed understanding and data to inform policy and improve productivity outcomes.