Download to read offline


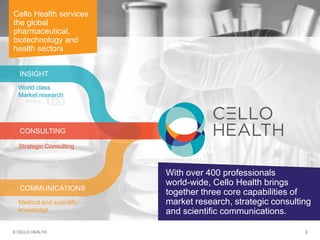


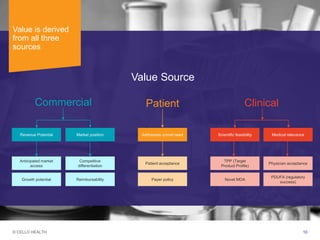
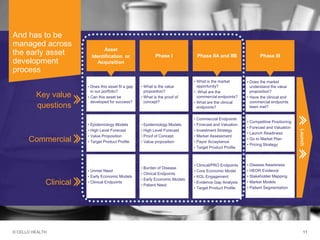
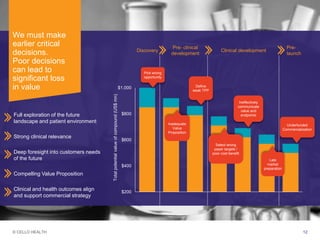

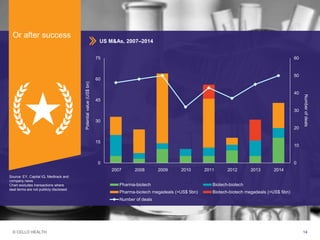
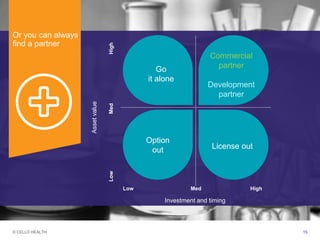

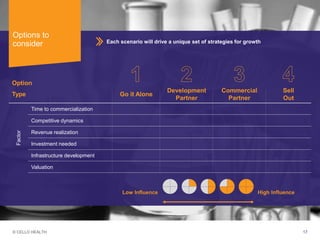
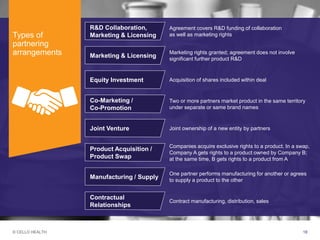
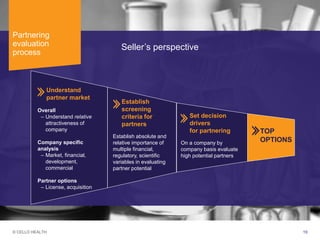
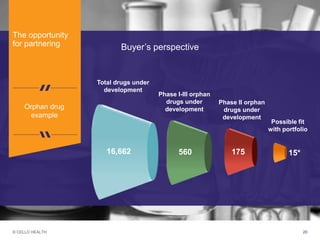
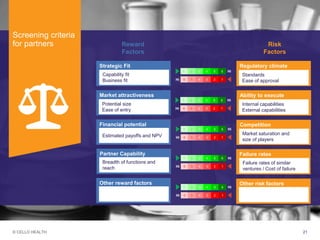

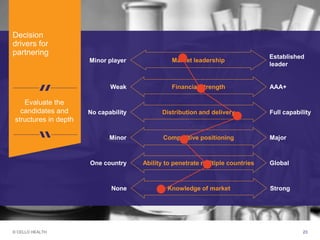


The document discusses early asset development and commercialization, and partnering arrangements. It introduces Cello Health and their services in market research, strategic consulting and scientific communications. It then discusses evaluating potential partners based on their capabilities and how they match a company's needs, as well as considering different types of partnering arrangements like licensing, acquisitions, joint ventures and more. Managing the value of early assets across development is also emphasized.


