This document summarizes Diplomat Pharmacy's business and growth opportunities:
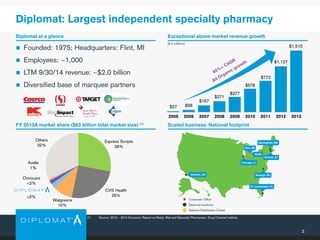
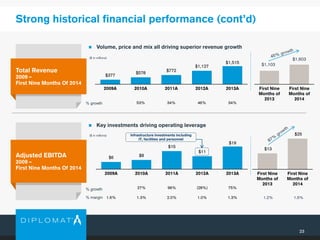
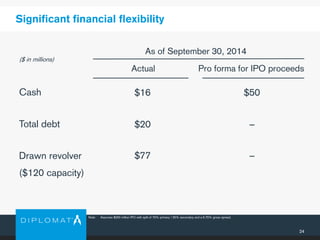
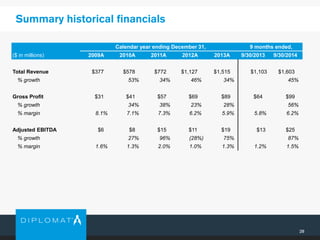
- Diplomat is the largest independent specialty pharmacy with a national footprint and over $2 billion in revenue.
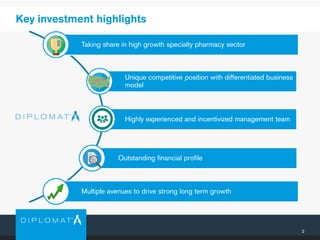
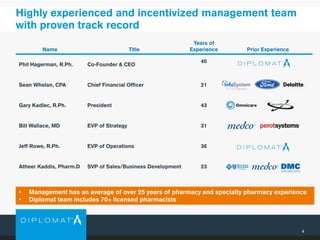
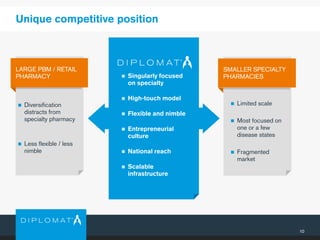
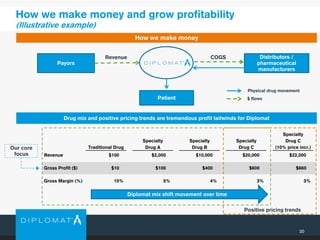
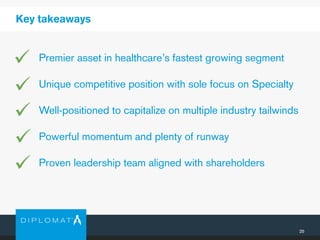
- It has a highly experienced management team and differentiated business model focused solely on specialty pharmacy.
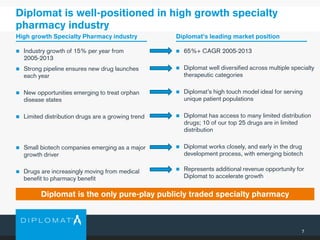
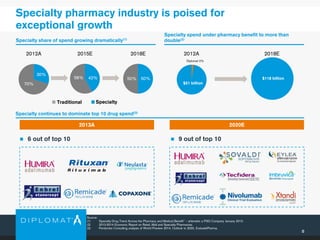
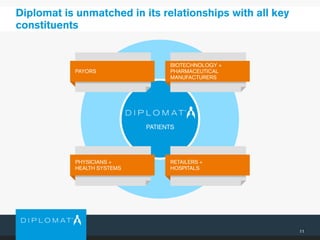
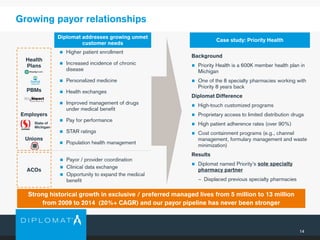
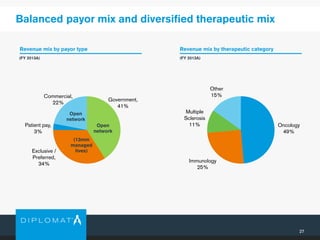
- The specialty pharmacy industry is growing rapidly due to new drug launches and a shift to pharmacy benefits, and Diplomat is well-positioned to capitalize on this through its scale and relationships.
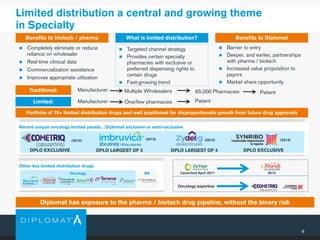
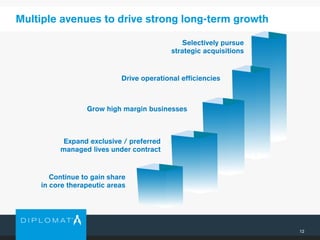
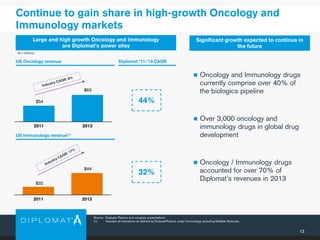
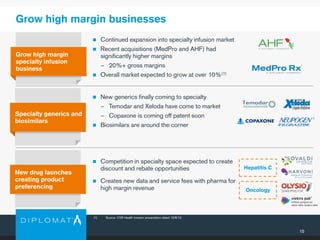
- Diplomat has multiple avenues for long-term growth including expanding in oncology/immunology, gaining more exclusive contracts, strategic acquisitions, and operational efficiencies.