Download to read offline

![An Experimental Study of the Effect of Control Parameters on the Surface Roughness in Turning
www.iosrjournals.org 35 | Page
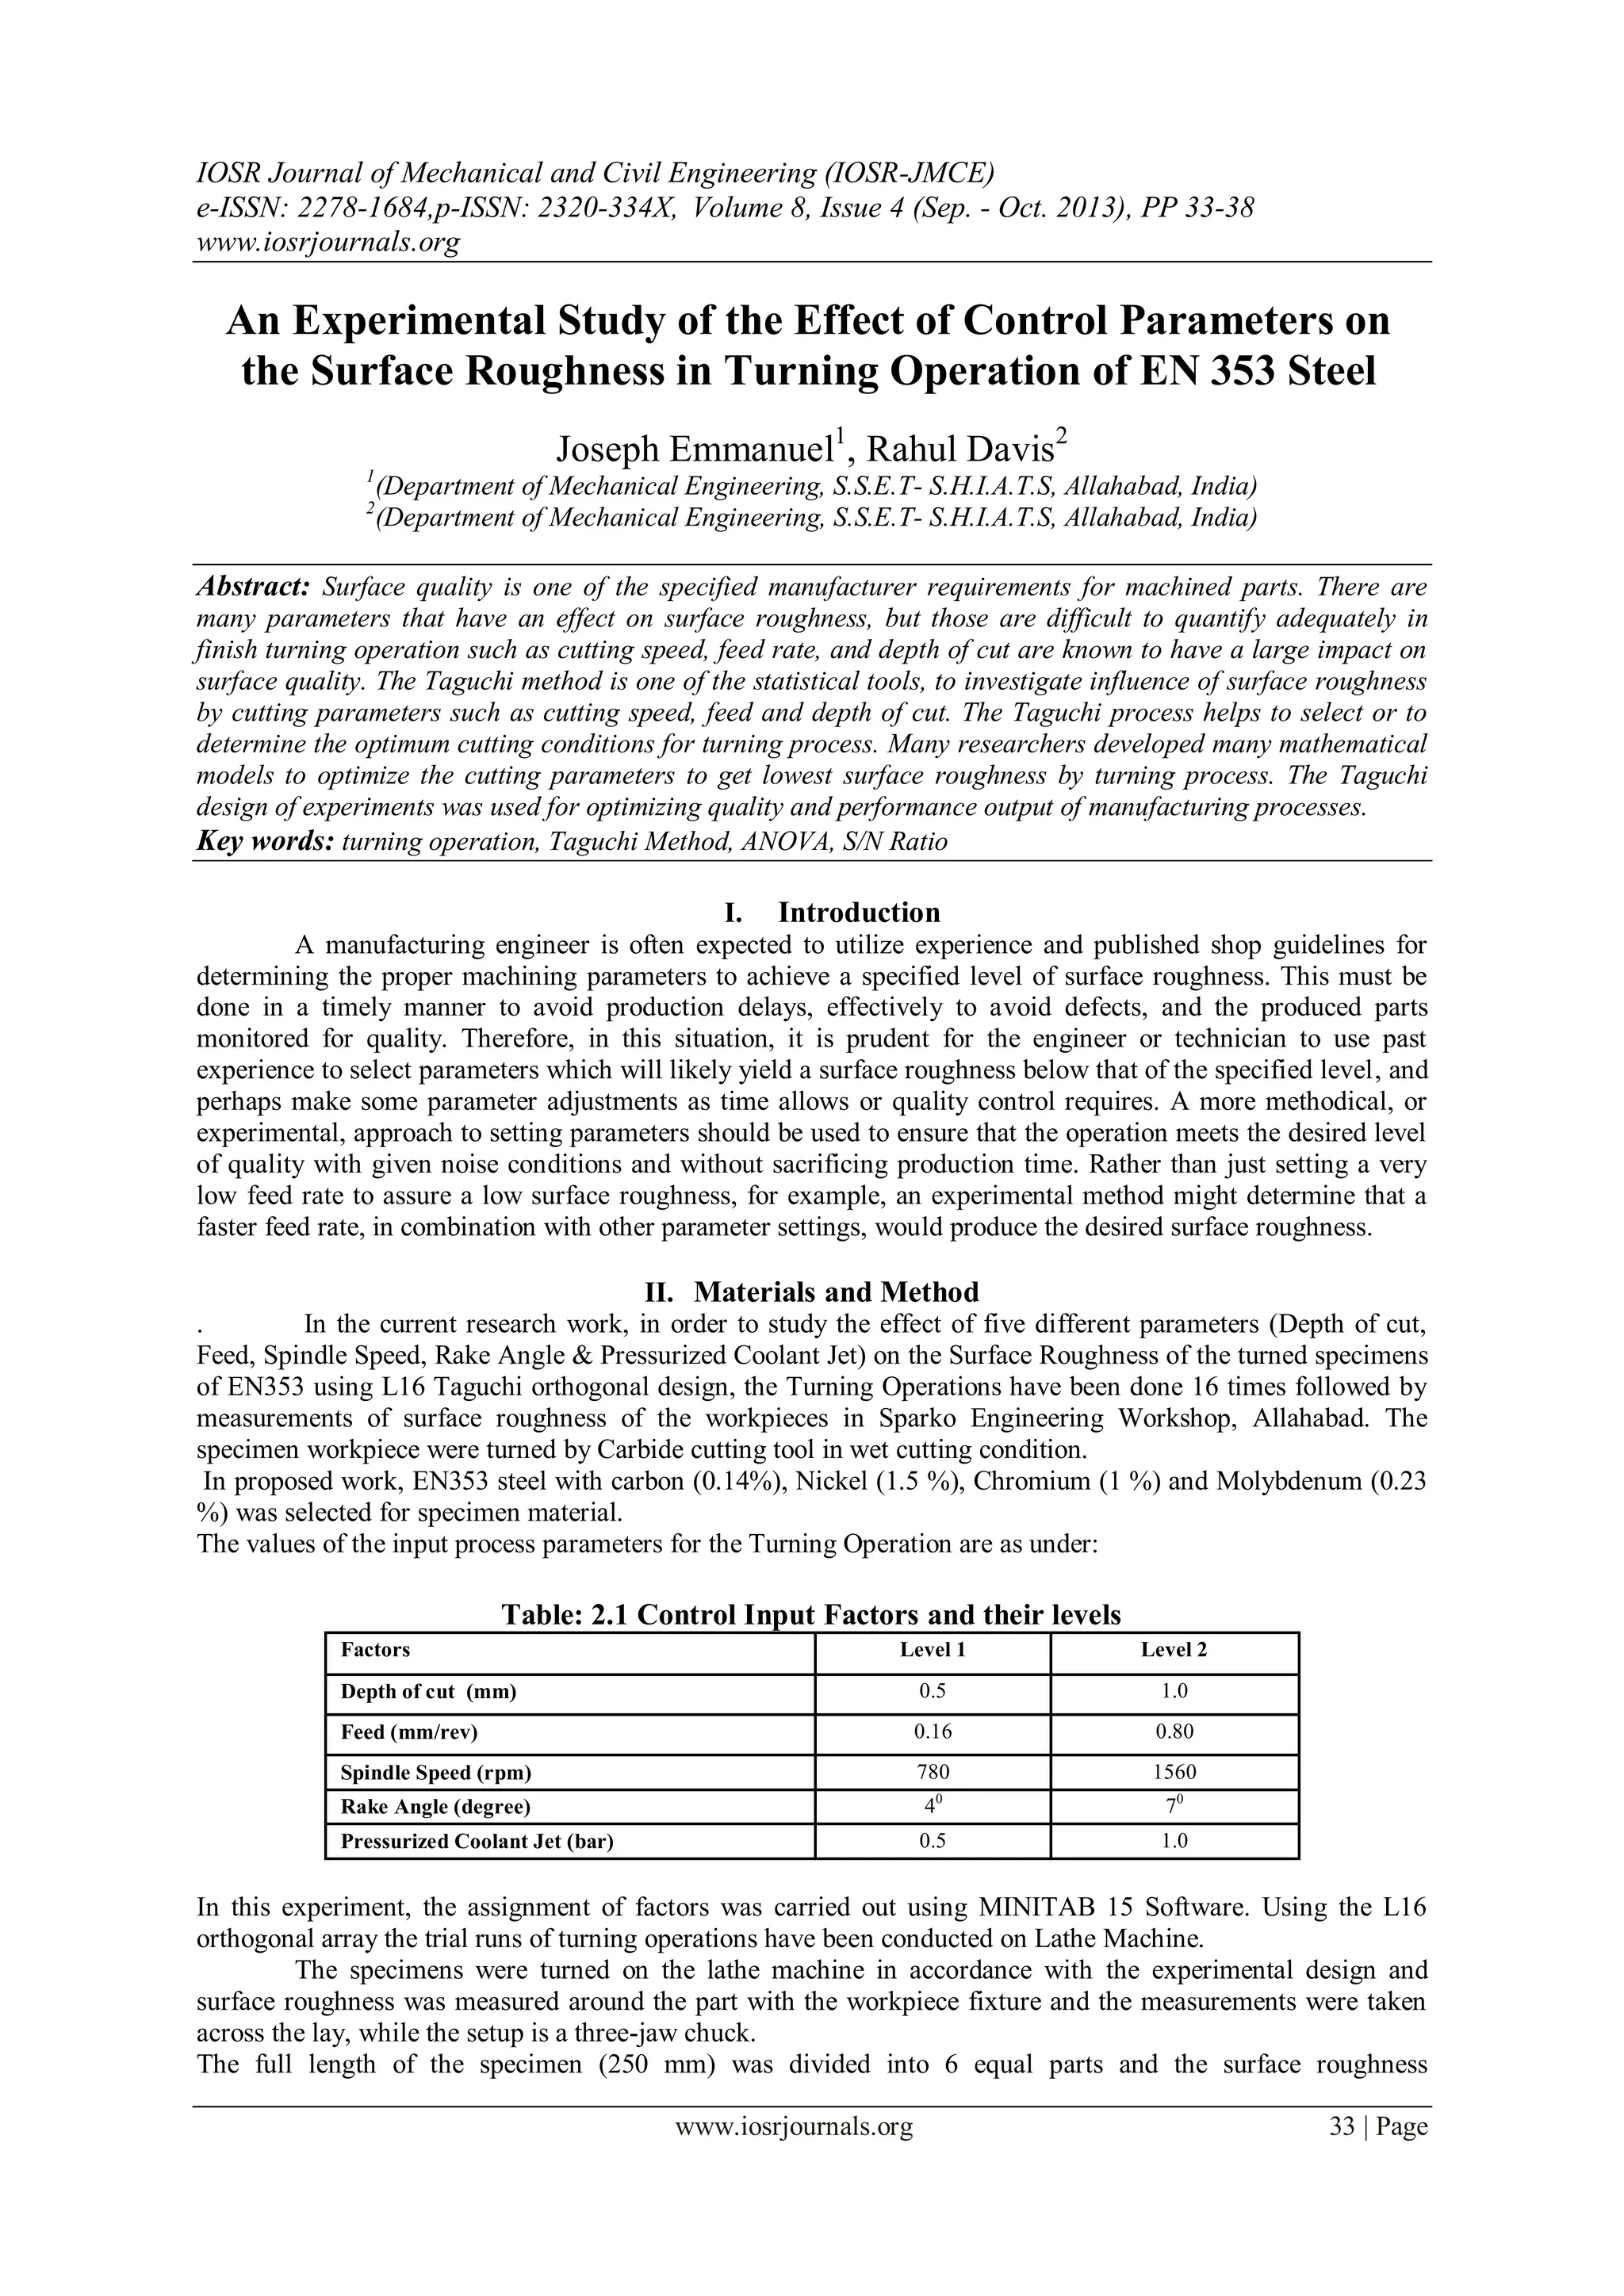
Table 2.5: Response Table for Signal-to-Noise ratio of Surface Roughness
Level Depth of Cut
(A)
Feed Rate
(B)
Spindle Speed
(C)
Rake Angle
(D)
Pressurized Coolant Jet
(E)
1 -39.94 -39.30 -38.17 -36.31 -39.33
2 -36.69 -37.33 -38.46 -40.33 -37.30
Delta
(∆max -∆min )
3.25 1.97 0.29 4.02 2.03
Rank 2 4 5 1 3
From Table 2.5, optimal levels of the Parameters for Turning Operation were A2, B2, C1, D2 & E2
Signal-to-noise ratio (SNR) is utilized to measure the deviation of quality characteristic from the target. In this
experiment, the response is the surface roughness which should be minimized, so the desired SNR characteristic
is in the category of smaller the better.
Table 2.5 shows the SNR of the surface roughness for each Level of the factors. The difference of SNR between
level 1 and 3 indicates that rake angle contributes the highest effect (Δmax-min = 4.07) on the surface roughness
followed by depth of cut (Δmax-min = 3.25), pressurized coolant jet (Δmax-min = 2.12), feed Rate (Δmax-min = 1.95)
and spindle speed (Δmax-min = 0.30).
Therefore the Predicted value of S/N Ratio for surface roughness
ηp (Surface Roughness)
= -38.305+ [(-37.33-(-38.305)] + [-36.68-(-38.305)] +
[-38.15-(-38.305)] + [-36.29-(-38.305)] + [-37.22-(-38.305)]
= -32.45
µp (Surface Roughness)
=91.95+ (85.24-91.95) + (76.56-91.95) + (86.04-91.95) + (70.14-91.95) + (78.14-91.95)
=28.32
III. Results and Discussion
Comparison of the F values of ANOVA Table 2.3 of Surface Roughness with the suitable F values of
the Factors (F0.05;1; 10 = 4.96) respectively shows that the all the factors except rake angle were found to be
insignificant.
0.800.16
110
100
90
80
70
1.00.5 1560780
74
110
100
90
80
70
1.00.5
Feed Rate(mm/rev)
MeanofMeans
Depth of Cut (mm) Spindle Speed(rpm)
Rake Angle (degree) Pressurized Coolant Jet (bar)
Main Effects Plot for Means
Data Means
Fig. 3.1 Main Effect Plot for Means](https://image.slidesharecdn.com/e0843338-150115234409-conversion-gate01/85/An-Experimental-Study-of-the-Effect-of-Control-Parameters-on-the-Surface-Roughness-in-Turning-Operation-of-EN-353-Steel-3-320.jpg)
![An Experimental Study of the Effect of Control Parameters on the Surface Roughness in Turning
www.iosrjournals.org 37 | Page
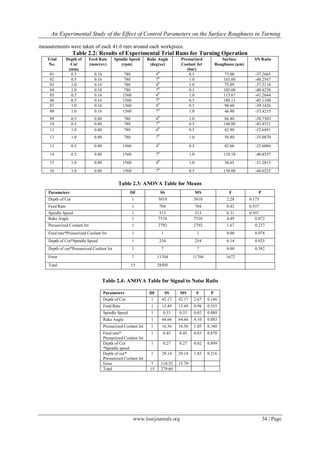
Table 2.6: Results for Confirmation Test Trial Runs of Turning Operation for Surface Roughness for the
Combination of Optimal Levels of Factors
Specimen Depth of
Cut (mm)
Feed Rate
(mm/rev)
Spindle
Speed
(rpm)
Rake Angle
(degrees)
Pressurized Coolant
Jet(bar)
Surface
Roughness
(µm)
1 1.0 0.8 780 70
1.0 28.34.
1 1.0 0.8 780 70
1.0 28.31
1 1.0 0.8 780 70
1.0 28.29
A parameter designs yielded the optimum condition of the controlled parameters, as well as a predictive
equation in each case and comparative study was done. A confirmation tests was then performed which
indicated that the selected parameters and predictive equation were accurate to within the limits of the
measurement instrument.
Therefore the above results can be recommended to get the lowest surface roughness for further studies.
In the current research work, the material used is EN353 with 0.14% carbon. The experimental work can
also be done for other materials having more hardness to see the effect of parameters on Surface
Roughness.
In each case interactions of the different levels of the factors can be included and study can be extended.
The experimental work and research can be extended by different tool geometry, different types of
coolants etc. as factors.
References
[1] Website: http://www.westyorkssteel.com/en353.html
[2] Website: www.kvsteel.co.uk/steel/EN353T.html
[3] Diwakar Reddy.V, Krishnaiah.G, A. Hemanth Kumar and Sushil Kumar Priya(2011), ANN Based Prediction of Surface Roughness in
Turning, International Conference on Trends in Mechanical and Industrial Engineering (ICTMIE'2011) Bangkok
[4] S.S.Mahapatra, Amar Patnaik, Prabina Ku. Patnaik (2006), Parametric Analysis and Optimization of Cutting Parameters for Turning
Operations based on Taguchi Method, Proceedings of the International Conference on Global Manufacturing and Innovation - July 27-29
[5] B. S. Raghuwanshi (2009), a course in Workshop Technology Vol.II (Machine Tools), Dhanpat Rai & Company Pvt. Ltd.
[6] Adeel H. Suhail, N. Ismail, S. V. Wong and N. A. Abdul Jalil(2010), Optimization of Cutting Parameters Based on Surface
Roughness and Assistance of Workpiece Surface Temperature in Turning Process, American J. of Engineering and Applied Sciences 3
(1): 102-108.
[7] C. A. van Luttervelt, T. H. C. Childs (1998), Present situation and future trends in modelling of machining operations, CIRP Ann.
[8] Daniel Kirby (2010), Optimizing the Turning Process toward an Ideal Surface Roughness Target.
[9] D. Philip Selvaraj, P. Chandramohan (2010), optimization of surface roughness of aisi 304 austenitic stainless steel in dry turning operation
using Taguchi design method Journal of Engineering Science and Technology,Vol. 5, no. 3 293 – 301, © school of engineering, Taylor’s
university college.
[10] E. Daniel Kirby (2006), Optimizing surface finish in a turning operation using the Taguchi parameter design method Int J Adv Manuf
Technol: 1021–1029.
[11] Guey-Jiuh Tzou, Ding-Yeng Chen (2006), Application of Taguchi method in the optimization of cutting parameters for turning operations.
Department of Mechanical Engineering, Lunghwa University of Science and Technology, Taiwan, (R.O.C.).
[12] Hari Singh (2008), Optimizing Tool Life of Carbide Inserts for Turned Parts using Taguchi’s design of Experiments Approach, Proceedings
of the International MultiConference of Engineers and Computer Scientists Vol II IMECS 2008, 19-21 March, , Hong Kong.
[13] Hasegawa. M, A. Seireg, R.A. Lindberg (1976), Surface roughness model for turning, Tribology International December 285-289.
[14] Karin Kandananond (2009), Characterization of FDB Sleeve Surface Roughness Using the Taguchi Approach, European Journal of
Scientific Research ISSN 1450-216X Vol.33 No.2 , pp.330-337 © Euro Journals Publishing, Inc.
[15] Madhav. S. Phadke (1989), Quality Engineering using Robust Design. Prentice Hall, Eaglewood Cliffs, New Jersey.
[16] Puertas. I. Arbizu, C.J. Luis Prez (2003), Surface roughness prediction by factorial design of experiments in turning processes, Journal of
Materials Processing Technology, 143- 144 390-396
[17] Palanikumar, L. Karunamoorthy, R. Krathikeyan (2006), Assessment of factors influencing surface roughness on the machining of glass –
reinforced polymer composites, Journal of Materials and Design.
[18] Sundaram. R.M., B.K. Lambert (1981), Mathematical models to predict surface finish in fine turning of steel, Part II, International Journal of
Production Research.
[19] S. Thamizhmanii, S. Saparudin, S. Hasan (2006), Analyses of roughness, forces and wear in turning gray cast iron, Journal of achievement in
Materials and Manufacturing Engineering, 17,.
[20] S. Thamizhmanii, S. Saparudin, S. Hasan (2006), Analyses of surface roughness by turning process using Taguchi method, journal of
Achievements in Materials and Manufacturing Engineering. Received 03.11.2006; accepted in revised form 15.11.2006.
[21] Philip j. Ross (2005), Taguchi Techniques for Quality Engineering, Tata McGraw-Hill Publishing Company Ltd.
First Author Profile: Er. Joseph Emmanuel having 1 year of teaching and research
experience and has
Published 1 International Journal. Presently Er. Emmanuel is teaching as an Assistant
Professor in the Department of Mechanical Engg. in Sam Higginbottom Institute of
Agriculture,
Technology & Sciences –Deemed University, Allahabad
Degree: M.Tech Industrial Engineering & Management
Institute: Sam Higginbottom Institute of Agriculture, Technology & Sciences](https://image.slidesharecdn.com/e0843338-150115234409-conversion-gate01/85/An-Experimental-Study-of-the-Effect-of-Control-Parameters-on-the-Surface-Roughness-in-Turning-Operation-of-EN-353-Steel-5-320.jpg)


This document presents an experimental study on the impact of control parameters on surface roughness during the turning operation of EN353 steel. Utilizing the Taguchi method, factors such as cutting speed, feed rate, and depth of cut were systematically analyzed to determine optimal machining conditions for improved surface quality. The results indicate that rake angle significantly affects surface roughness, with specific combinations of parameters identified for achieving the desired quality in manufacturing processes.