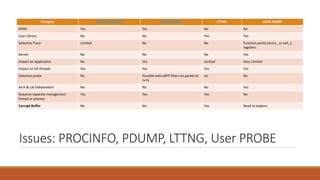
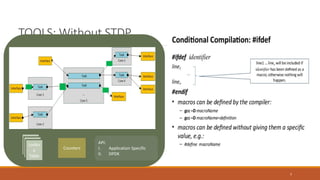
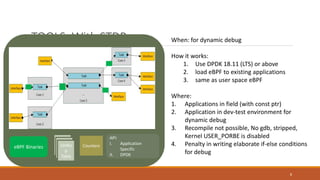
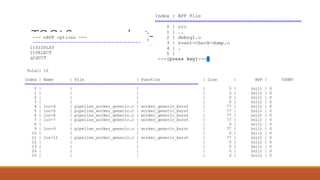
Static Trace
with dynamic
Debug
PRESENTED BY
VIPIN VARGHESE
DPDK: Why is it difficult to debug?
What we envision as simplified program
What we end up doing
DPDK: Where to debug?
RX to Worker stage –
since we mostly use
RSS for flow id
Worker – dequeue and
enqueue points
Dequeue packets to TX
– identify port-queue
pair against flows
DPDK: What to debug?
• How many actual
(enqueue – drop) from RX
for a given flow?
• Which is the RX port-
queue which packet are
dropped?
• Which worker is has
lowest dequeue
request in a given
event queue?
• Which flow that is
least events
enqueued?
• Which Is the port
with highest
enqueue towards
specific QoS?
Issues: PROCINFO, PDUMP, LTTNG, User PROBE
Category DPDK-PROCINFO DPDK-PDUMP LTTNG USER PROBE
DPDK Yes Yes No No
User Library No No Yes Yes
Selective Trace Limited No No Function points (entry_ or exit_),
registers
Kernel No No No Yes
Impact on Application No Yes Limited Very Limited
Impact on OS threads Yes Yes Yes Yes
Selective probe No Possible with eBPF filters on packet at
rx-tx
no No
Arch & Lib independent No No No Yes
Requires separate management
thread or process
Yes Yes Yes No
Corrupt Buffer No No Yes Need to explore
Tools: Why
Static Trace &
Dynamic
Probe?
OVERVIEW,
SCREENSHOT &
DEMO
TOOLS: Without STDP
7
Looku
p
Table
Counters
API:
I. Application Specific
II. DPDK
TOOLS: With STDP
8
Looku
p
Table
Counters
API:
I. Application
Specific
II. DPDK
eBPF Binaries
When: for dynamic debug
How it works:
1. Use DPDK 18.11 (LTS) or above
2. load eBPF to existing applications
3. same as user space eBPF
Where:
1. Applications in field (with const ptr)
2. Application in dev-test environment for
dynamic debug
3. Recompile not possible, No gdb, stripped,
Kernel USER_PORBE is disabled
4. Penalty in writing elaborate if-else conditions
for debug
TOOLS: screenshot-1
TOOLS: screenshot-2 (CSV to matplot)
TOOLS: screenshot-3 (application code changes)
TOOLS: screenshot-3 (helper code)
13
# llvm-objdump -S t3.o
t3.o: file format ELF64-BPF
Disassembly of section .text:
entry:
0: bf 12 00 00 00 00 00 00 r2 = r1
1: 69 21 10 00 00 00 00 00 r1 = *(u16 *)(r2 + 16)
2: 79 23 00 00 00 00 00 00 r3 = *(u64 *)(r2 + 0)
3: 0f 13 00 00 00 00 00 00 r3 += r1
4: 69 31 0c 00 00 00 00 00 r1 = *(u16 *)(r3 + 12)
5: 15 01 01 00 08 06 00 00 if r1 == 1544 goto +1 <LBB0_2>
6: 55 01 05 00 08 00 00 00 if r1 != 8 goto +5 <LBB0_3>
LBB0_2:
7: 18 01 00 00 00 00 00 00 00 00 00 00 00 00 00 00 r1 = 0 ll
9: 79 11 00 00 00 00 00 00 r1 = *(u64 *)(r1 + 0)
10: b7 03 00 00 40 00 00 00 r3 = 64
11: 85 10 00 00 ff ff ff ff call -1
LBB0_3:
12: b7 00 00 00 01 00 00 00 r0 = 1
13: 95 00 00 00 00 00 00 00 exit
Future things to explore
• user probe like dynamic trace.
• csv import of user events counter to vtune.
• csv import of user events meta-data to vtune.
• EBPF entry function from ‘void *’ to ‘const void *’ to prevent data
corruption in eBPF byte code.
• More DPDK cases: pipeline, soft-nic, crypto, hqos, CVL meta-data
• More application cases: spdk, ipsec stack, ADK, vpp. OVS

Dynamic user trace

  • 1.
  • 2.
    DPDK: Why isit difficult to debug? What we envision as simplified program What we end up doing
  • 3.
    DPDK: Where todebug? RX to Worker stage – since we mostly use RSS for flow id Worker – dequeue and enqueue points Dequeue packets to TX – identify port-queue pair against flows
  • 4.
    DPDK: What todebug? • How many actual (enqueue – drop) from RX for a given flow? • Which is the RX port- queue which packet are dropped? • Which worker is has lowest dequeue request in a given event queue? • Which flow that is least events enqueued? • Which Is the port with highest enqueue towards specific QoS?
  • 5.
    Issues: PROCINFO, PDUMP,LTTNG, User PROBE Category DPDK-PROCINFO DPDK-PDUMP LTTNG USER PROBE DPDK Yes Yes No No User Library No No Yes Yes Selective Trace Limited No No Function points (entry_ or exit_), registers Kernel No No No Yes Impact on Application No Yes Limited Very Limited Impact on OS threads Yes Yes Yes Yes Selective probe No Possible with eBPF filters on packet at rx-tx no No Arch & Lib independent No No No Yes Requires separate management thread or process Yes Yes Yes No Corrupt Buffer No No Yes Need to explore
  • 6.
    Tools: Why Static Trace& Dynamic Probe? OVERVIEW, SCREENSHOT & DEMO
  • 7.
  • 8.
    TOOLS: With STDP 8 Looku p Table Counters API: I.Application Specific II. DPDK eBPF Binaries When: for dynamic debug How it works: 1. Use DPDK 18.11 (LTS) or above 2. load eBPF to existing applications 3. same as user space eBPF Where: 1. Applications in field (with const ptr) 2. Application in dev-test environment for dynamic debug 3. Recompile not possible, No gdb, stripped, Kernel USER_PORBE is disabled 4. Penalty in writing elaborate if-else conditions for debug
  • 9.
  • 10.
  • 11.
  • 12.
  • 13.
    13 # llvm-objdump -St3.o t3.o: file format ELF64-BPF Disassembly of section .text: entry: 0: bf 12 00 00 00 00 00 00 r2 = r1 1: 69 21 10 00 00 00 00 00 r1 = *(u16 *)(r2 + 16) 2: 79 23 00 00 00 00 00 00 r3 = *(u64 *)(r2 + 0) 3: 0f 13 00 00 00 00 00 00 r3 += r1 4: 69 31 0c 00 00 00 00 00 r1 = *(u16 *)(r3 + 12) 5: 15 01 01 00 08 06 00 00 if r1 == 1544 goto +1 <LBB0_2> 6: 55 01 05 00 08 00 00 00 if r1 != 8 goto +5 <LBB0_3> LBB0_2: 7: 18 01 00 00 00 00 00 00 00 00 00 00 00 00 00 00 r1 = 0 ll 9: 79 11 00 00 00 00 00 00 r1 = *(u64 *)(r1 + 0) 10: b7 03 00 00 40 00 00 00 r3 = 64 11: 85 10 00 00 ff ff ff ff call -1 LBB0_3: 12: b7 00 00 00 01 00 00 00 r0 = 1 13: 95 00 00 00 00 00 00 00 exit
  • 14.
    Future things toexplore • user probe like dynamic trace. • csv import of user events counter to vtune. • csv import of user events meta-data to vtune. • EBPF entry function from ‘void *’ to ‘const void *’ to prevent data corruption in eBPF byte code. • More DPDK cases: pipeline, soft-nic, crypto, hqos, CVL meta-data • More application cases: spdk, ipsec stack, ADK, vpp. OVS