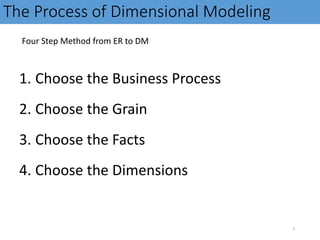
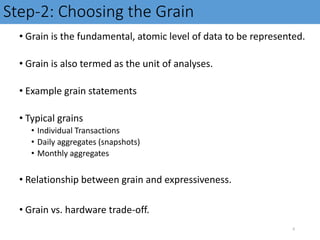
Data Warehousing
Lecture
Process of Dimensional Modeling
1
Process of Dimensional Modeling
2
The Process of Dimensional Modeling
Four Step Method from ER to DM
1. Choose the Business Process
2. Choose the Grain
3. Choose the Facts
4. Choose the Dimensions
3
Step-1: Choose the Business Process
• A business process is a major operational process in an organization.
• Typically supported by a legacy system (database) or an OLTP.
• Examples: Orders, Invoices, Inventory etc.
• Business Processes are often termed as Data Marts and that is why
many people criticize DM as being data mart oriented.
4
Step-1: Separating the Process
5
Star-1
Star-2
Snow-flake
Step-2: Choosing the Grain
• Grain is the fundamental, atomic level of data to be represented.
• Grain is also termed as the unit of analyses.
• Example grain statements
• Typical grains
• Individual Transactions
• Daily aggregates (snapshots)
• Monthly aggregates
• Relationship between grain and expressiveness.
• Grain vs. hardware trade-off.
6
Continue……
Grain is the lowest level of detail or the atomic level of data stored in the warehouse. The lowest
level of data in the warehouse may not be the lowest level of data recorded in the business system.
It is also termed as the unit of analysis e.g. unit of weight is Kg etc.
Example grain statements: (one fact row represents a…)
• Entry from a cash register receipt
• Boarding pass to get on a flight
• Daily snapshot of inventory level for a product in a warehouse
• Sensor reading per minute for a sensor
• Student enrolled in a course
Finer-grained fact tables:
• are more expressive
• have more rows
Trade-off between performance and expressiveness
• Rule of thumb: Err in favor of expressiveness
• Pre-computed aggregates can solve performance problems
In the absence of aggregates, there is a potential to waste millions of dollars on hardware upgrades
to solve performance problems that could have been otherwise addressed by aggregates.
7
Step-2: Relationship b/w Grain
8
Daily aggregates
6 x 4 = 24 values
Four aggregates per week
4 x 4 = 16 values
Two aggregates per week
2 x 4 = 8 values
LOW Granularity HIGH Granularity
The case FOR data aggregation
• Works well for repetitive queries.
• Justifiable if used for max number of queries.
• Provides a “big picture” or macroscopic view.
9
The case AGAINST data aggregation
• Aggregation is irreversible.
• Can create monthly sales data from weekly sales data, but the reverse is not possible.
• Aggregation limits the questions that can be answered.
• What, when, why, where, what-else, what-next
10
The case AGAINST data aggregation
• Aggregation can hide crucial facts.
• The average of 100 & 100 is same as 150 & 50
11
Aggregation hides crucial facts Example
Week-1 Week-2 Week-3 Week-4 Average
Zone-1 100 100 100 100 100
Zone-2 50 100 150 100 100
Zone-3 50 100 100 150 100
Zone-4 200 100 50 50 100
Average 100 100 100 100
12
Just looking at the averages i.e. aggregate
Aggregation hides crucial facts chart
0
50
100
150
200
250
Week-1 Week-2 Week-3 Week-4
Z1 Z2 Z3 Z4
13
Z1: Sale is constant (need to work on it)
Z2: Sale went up, then fell (need of concern)
Z3: Sale is on the rise, why?
Z4: Sale dropped sharply, need to look deeply.
W2: Static sale
Step 3: Choose Facts statement
14
“We need monthly sales
volume and Rs. by
week, product and Zone”
Facts
Dimensions
Step 3: Choose Facts
•Choose the facts that will populate each
fact table record.
•Remember that best Facts are Numeric,
Continuously Valued and Additive.
•Example: Quantity Sold, Amount etc.
15
Step 4: Choose Dimensions
•Choose the dimensions that apply to each
fact in the fact table.
•Typical dimensions: time, product, geography
etc.
•Determine hierarchies within each dimension.
•Where clause
16
Step-4: How to Identify a Dimension?
•The single valued attributes during recording of a
transaction are dimensions.
17
Calendar_Date
Time_of_Day
Account _No
ATM_Location
Transaction_Type
Transaction_Rs
Fact Table
Dim
Time_of_day: Morning, Mid Morning, Lunch Break etc.
Transaction_Type: Withdrawal, Deposit, Check balance etc.
Continue…..
• The success in selecting the right dimensions for a given fact table is dependent on
correctly identifying any description that has a single value for an individual fact table
record or transaction. Note that the fact table record considered could be a single
transaction or weekly aggregate or monthly sums etc i.e. a grain is associated. Once this is
correctly identified and settled, then as many dimensions can be added to the fact able as
required. For the ATM customer transaction example, the following dimensions all have a
single value during the recording of the transaction, as none of the above dimensions
change during a single transaction:
• Calendar_Date
• Time_of_Day
• Account _No
• ATM_Location
• Transaction_Type (withdrawal, deposit, balance inquiry etc.) Over here
Time_of_Day refers to specific periods such as Morning, Mid Morning, Lunch Break, Office_Off etc.
Note that during an atomic transaction, the value of Time_of_Day does not change (as a transaction
takes less than a minute), hence it is a dimension. In the context of the ATM example, the only
numeric attribute is the Transaction_Rs, so it is a fact. Observe that we use this convention in real
life also, when people say we will visit you first time or second time of the day etc.
18
Step-4: Can Dimensions be Multi-valued?
•Are dimensions ALWYS single?
• Not really
• What are the problems? And how to handle them
19
 Calendar_Date (of inspection)
 Reg_No
 Technician
 Workshop
 Maintenance_Operation
 How many maintenance operations are possible?
 Few
 Maybe more for old cars.
Step-4: Dimensions & Grain
•Several grains are possible as per business
requirement.
• For some aggregations certain descriptions do not remain
atomic.
• Example: Time_of_Day may change several times during
daily aggregate, but not during a transaction
•Choose the dimensions that are applicable within the
selected grain.
20
Continue…..
There is a relationship between the grain and the dimensions. When building a fact table, the most
important step is to declare the grain (aggregation level) of the fact table. The grain declares the exact
meaning of an individual fact record. Consider the case of transactions for an ATM machine. The grain
could be individual customer transaction, or number of transaction per week or the amount drawn per
month.
• Calendar_Date
• Time_of_Day
• Account _No
• ATM_Location
• Transaction_Type (withdrawal, deposit, balance inquiry etc.)
Note that none of the above dimensions change during a single transaction. However, for weekly
transactions probably only Account _No and ATM_Location can be treated as a dimension.
Note that higher the level of aggregation of the fact table, the fewer will be the number of
dimensions you can attach to the fact records. The converse of this is surprising. The more granular the
data, the more dimensions make sense. Hence the lowest-level data in any organization is the most
dimensional.
21

Lecture 3F.ppt

  • 1.
  • 2.
  • 3.
    The Process ofDimensional Modeling Four Step Method from ER to DM 1. Choose the Business Process 2. Choose the Grain 3. Choose the Facts 4. Choose the Dimensions 3
  • 4.
    Step-1: Choose theBusiness Process • A business process is a major operational process in an organization. • Typically supported by a legacy system (database) or an OLTP. • Examples: Orders, Invoices, Inventory etc. • Business Processes are often termed as Data Marts and that is why many people criticize DM as being data mart oriented. 4
  • 5.
    Step-1: Separating theProcess 5 Star-1 Star-2 Snow-flake
  • 6.
    Step-2: Choosing theGrain • Grain is the fundamental, atomic level of data to be represented. • Grain is also termed as the unit of analyses. • Example grain statements • Typical grains • Individual Transactions • Daily aggregates (snapshots) • Monthly aggregates • Relationship between grain and expressiveness. • Grain vs. hardware trade-off. 6
  • 7.
    Continue…… Grain is thelowest level of detail or the atomic level of data stored in the warehouse. The lowest level of data in the warehouse may not be the lowest level of data recorded in the business system. It is also termed as the unit of analysis e.g. unit of weight is Kg etc. Example grain statements: (one fact row represents a…) • Entry from a cash register receipt • Boarding pass to get on a flight • Daily snapshot of inventory level for a product in a warehouse • Sensor reading per minute for a sensor • Student enrolled in a course Finer-grained fact tables: • are more expressive • have more rows Trade-off between performance and expressiveness • Rule of thumb: Err in favor of expressiveness • Pre-computed aggregates can solve performance problems In the absence of aggregates, there is a potential to waste millions of dollars on hardware upgrades to solve performance problems that could have been otherwise addressed by aggregates. 7
  • 8.
    Step-2: Relationship b/wGrain 8 Daily aggregates 6 x 4 = 24 values Four aggregates per week 4 x 4 = 16 values Two aggregates per week 2 x 4 = 8 values LOW Granularity HIGH Granularity
  • 9.
    The case FORdata aggregation • Works well for repetitive queries. • Justifiable if used for max number of queries. • Provides a “big picture” or macroscopic view. 9
  • 10.
    The case AGAINSTdata aggregation • Aggregation is irreversible. • Can create monthly sales data from weekly sales data, but the reverse is not possible. • Aggregation limits the questions that can be answered. • What, when, why, where, what-else, what-next 10
  • 11.
    The case AGAINSTdata aggregation • Aggregation can hide crucial facts. • The average of 100 & 100 is same as 150 & 50 11
  • 12.
    Aggregation hides crucialfacts Example Week-1 Week-2 Week-3 Week-4 Average Zone-1 100 100 100 100 100 Zone-2 50 100 150 100 100 Zone-3 50 100 100 150 100 Zone-4 200 100 50 50 100 Average 100 100 100 100 12 Just looking at the averages i.e. aggregate
  • 13.
    Aggregation hides crucialfacts chart 0 50 100 150 200 250 Week-1 Week-2 Week-3 Week-4 Z1 Z2 Z3 Z4 13 Z1: Sale is constant (need to work on it) Z2: Sale went up, then fell (need of concern) Z3: Sale is on the rise, why? Z4: Sale dropped sharply, need to look deeply. W2: Static sale
  • 14.
    Step 3: ChooseFacts statement 14 “We need monthly sales volume and Rs. by week, product and Zone” Facts Dimensions
  • 15.
    Step 3: ChooseFacts •Choose the facts that will populate each fact table record. •Remember that best Facts are Numeric, Continuously Valued and Additive. •Example: Quantity Sold, Amount etc. 15
  • 16.
    Step 4: ChooseDimensions •Choose the dimensions that apply to each fact in the fact table. •Typical dimensions: time, product, geography etc. •Determine hierarchies within each dimension. •Where clause 16
  • 17.
    Step-4: How toIdentify a Dimension? •The single valued attributes during recording of a transaction are dimensions. 17 Calendar_Date Time_of_Day Account _No ATM_Location Transaction_Type Transaction_Rs Fact Table Dim Time_of_day: Morning, Mid Morning, Lunch Break etc. Transaction_Type: Withdrawal, Deposit, Check balance etc.
  • 18.
    Continue….. • The successin selecting the right dimensions for a given fact table is dependent on correctly identifying any description that has a single value for an individual fact table record or transaction. Note that the fact table record considered could be a single transaction or weekly aggregate or monthly sums etc i.e. a grain is associated. Once this is correctly identified and settled, then as many dimensions can be added to the fact able as required. For the ATM customer transaction example, the following dimensions all have a single value during the recording of the transaction, as none of the above dimensions change during a single transaction: • Calendar_Date • Time_of_Day • Account _No • ATM_Location • Transaction_Type (withdrawal, deposit, balance inquiry etc.) Over here Time_of_Day refers to specific periods such as Morning, Mid Morning, Lunch Break, Office_Off etc. Note that during an atomic transaction, the value of Time_of_Day does not change (as a transaction takes less than a minute), hence it is a dimension. In the context of the ATM example, the only numeric attribute is the Transaction_Rs, so it is a fact. Observe that we use this convention in real life also, when people say we will visit you first time or second time of the day etc. 18
  • 19.
    Step-4: Can Dimensionsbe Multi-valued? •Are dimensions ALWYS single? • Not really • What are the problems? And how to handle them 19  Calendar_Date (of inspection)  Reg_No  Technician  Workshop  Maintenance_Operation  How many maintenance operations are possible?  Few  Maybe more for old cars.
  • 20.
    Step-4: Dimensions &Grain •Several grains are possible as per business requirement. • For some aggregations certain descriptions do not remain atomic. • Example: Time_of_Day may change several times during daily aggregate, but not during a transaction •Choose the dimensions that are applicable within the selected grain. 20
  • 21.
    Continue….. There is arelationship between the grain and the dimensions. When building a fact table, the most important step is to declare the grain (aggregation level) of the fact table. The grain declares the exact meaning of an individual fact record. Consider the case of transactions for an ATM machine. The grain could be individual customer transaction, or number of transaction per week or the amount drawn per month. • Calendar_Date • Time_of_Day • Account _No • ATM_Location • Transaction_Type (withdrawal, deposit, balance inquiry etc.) Note that none of the above dimensions change during a single transaction. However, for weekly transactions probably only Account _No and ATM_Location can be treated as a dimension. Note that higher the level of aggregation of the fact table, the fewer will be the number of dimensions you can attach to the fact records. The converse of this is surprising. The more granular the data, the more dimensions make sense. Hence the lowest-level data in any organization is the most dimensional. 21