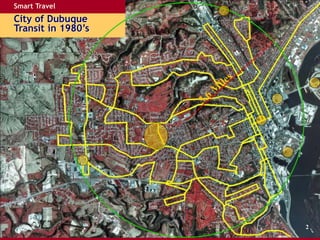
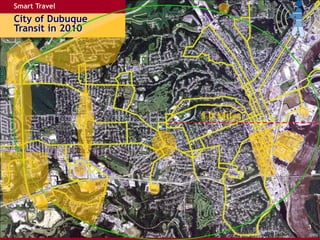
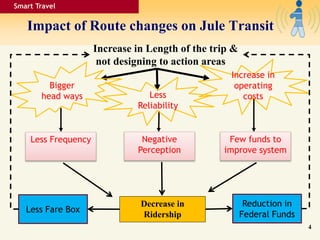
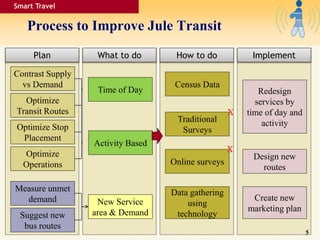
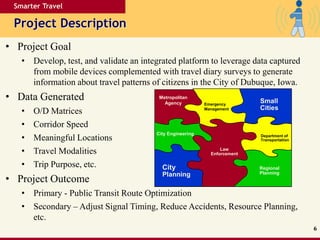
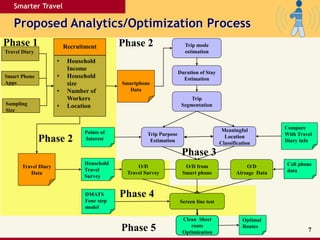
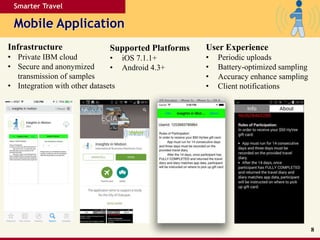
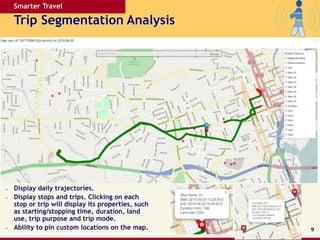
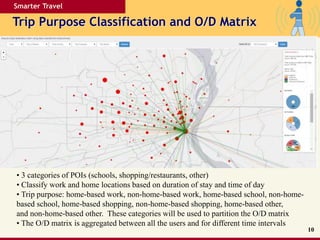
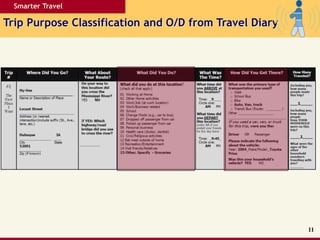
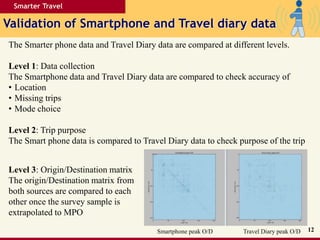
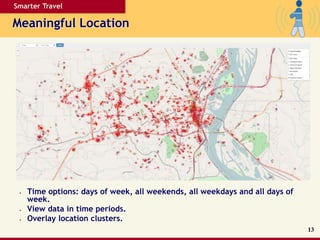
Dubuque Smarter
Travel
Smarter Travel
NADO Conference
0/201
Smart Travel
City of Dubuque
Transit in 1980’s
2
Smart Travel
City of Dubuque
Transit in 2010
5.0 Miles
3
Impact of Route changes on Jule Transit
Smart Travel
Increase in Length of the trip &
not designing to action areas
Decrease in
Ridership
Bigger
head ways Less
Reliability
Increase in
operating
costs
Less Fare Box
Less Frequency Negative
Perception
Few funds to
improve system
Reduction in
Federal Funds
4
Process to Improve Jule Transit
Smart Travel
Plan
Optimize
Transit Routes
Optimize Stop
Placement
Contrast Supply
vs Demand
Optimize
Operations
Measure unmet
demand
Suggest new
bus routes
What to do
Time of Day
Activity Based
New Service
area & Demand
How to do
Census Data
Traditional
Surveys
Online surveys
Data gathering
using
technology
X
X
Implement
Design new
routes
Redesign
services by
time of day and
activity
Create new
marketing plan
5
Smarter Travel
Project Description
6
• Project Goal
• Develop, test, and validate an integrated platform to leverage data captured
from mobile devices complemented with travel diary surveys to generate
information about travel patterns of citizens in the City of Dubuque, Iowa.
• Data Generated
• O/D Matrices
• Corridor Speed
• Meaningful Locations
• Travel Modalities
• Trip Purpose, etc.
• Project Outcome
• Primary - Public Transit Route Optimization
• Secondary – Adjust Signal Timing, Reduce Accidents, Resource Planning,
etc.
Metropolitan
Agency Emergency
Management
Small
Cities
Department of
Transportation
Regional
Planning
Law
Enforcement
City Engineering
City
Planning
Smarter Travel
Proposed Analytics/Optimization Process
7
Trip mode
estimation
Duration of Stay
Estimation
Trip
Segmentation
Trip Purpose
Estimation
Meaningful
Location
Classification
O/D from
Smart phone
Points of
Interest
O/D
Airsage Data
Smartphone
Data
Cell phone
data
O/D
Travel Survey
Compare
With Travel
Diary info
Household
Travel
Survey
DMATS
Four step
model
Screen line test
Clean Sheet
route
Optimization
Optimal
Routes
Recruitment
• Household
Income
• Household
size
• Number of
Workers
• Location
Travel Diary
Data
Travel Diary
Smart Phone
Apps
Sampling
Size
Phase 1 Phase 2
Phase 2
Phase 3
Phase 4
Phase 5
Smarter Travel
Mobile Application
8
Infrastructure
• Private IBM cloud
• Secure and anonymized
transmission of samples
• Integration with other datasets
Supported Platforms
• iOS 7.1.1+
• Android 4.3+
User Experience
• Periodic uploads
• Battery-optimized sampling
• Accuracy enhance sampling
• Client notifications
Smarter Travel
Trip Segmentation Analysis
9
• Display daily trajectories.
• Display stops and trips. Clicking on each
stop or trip will display its properties, such
as starting/stopping time, duration, land
use, trip purpose and trip mode.
• Ability to pin custom locations on the map.
Smarter Travel
Trip Purpose Classification and O/D Matrix
10
• 3 categories of POIs (schools, shopping/restaurants, other)
• Classify work and home locations based on duration of stay and time of day
• Trip purpose: home-based work, non-home-based work, home-based school, non-home-
based school, home-based shopping, non-home-based shopping, home-based other,
and non-home-based other. These categories will be used to partition the O/D matrix
• The O/D matrix is aggregated between all the users and for different time intervals
Smarter Travel
Trip Purpose Classification and O/D from Travel Diary
11
Smarter Travel
Validation of Smartphone and Travel diary data
12
The Smarter phone data and Travel Diary data are compared at different levels.
Level 1: Data collection
The Smartphone data and Travel Diary data are compared to check accuracy of
• Location
• Missing trips
• Mode choice
Level 2: Trip purpose
The Smart phone data is compared to Travel Diary data to check purpose of the trip
Level 3: Origin/Destination matrix
The origin/Destination matrix from
both sources are compared to each
other once the survey sample is
extrapolated to MPO
Smartphone peak O/D Travel Diary peak O/D
Smarter Travel
Meaningful Location
13
• Time options: days of week, all weekends, all weekdays and all days of
week.
• View data in time periods.
• Overlay location clusters.
Smarter Travel
Corridor Speed and Travel Time
14
• Corridor speed or travel time
• Time options: Time of Day
• Direction of Travel.
Smarter Travel
Bus Route Optimization approach
15
• Input data:
• Street intersections and street links
• Travel time of various travel modes
on each link
• Maximum number of buses and bus
capacities.
• O/D matrix
• Additional constraints/requirements
• Generate a set of candidate routes
• Can include constraints such as hubs, limited change from current routes,
etc.
• Choose an optimal set of routes minimizing average travel time by formulating
objective function and optimization problem as an mixed integer program
(MIP).
• Solve MIP using 2 types of algorithms: CPLEX and Volume algorithm
• Routes are adjusted based on feedback and expert guidance from Jule
Generate
candidate
routes
Select
optimal set
of routes
Smarter Travel
Optimized Bus routes
16
Bus routes based on peak period O/D
Smarter Travel
Contact info
Contacts
17
Chandra Ravada
Director of Transportation Department
East Central Intergovernmental Association
ph.: 563-556-4166
e-mail: cravada@ecia.org
Web Sources
http://www.cityofdubuque.org/1496/Smarter-Travel
http://www.eciatrans.org/DMATS/SmarterTravel.cfm

Dubuque Smarter Travel

  • 1.
  • 2.
    Smart Travel City ofDubuque Transit in 1980’s 2
  • 3.
    Smart Travel City ofDubuque Transit in 2010 5.0 Miles 3
  • 4.
    Impact of Routechanges on Jule Transit Smart Travel Increase in Length of the trip & not designing to action areas Decrease in Ridership Bigger head ways Less Reliability Increase in operating costs Less Fare Box Less Frequency Negative Perception Few funds to improve system Reduction in Federal Funds 4
  • 5.
    Process to ImproveJule Transit Smart Travel Plan Optimize Transit Routes Optimize Stop Placement Contrast Supply vs Demand Optimize Operations Measure unmet demand Suggest new bus routes What to do Time of Day Activity Based New Service area & Demand How to do Census Data Traditional Surveys Online surveys Data gathering using technology X X Implement Design new routes Redesign services by time of day and activity Create new marketing plan 5
  • 6.
    Smarter Travel Project Description 6 •Project Goal • Develop, test, and validate an integrated platform to leverage data captured from mobile devices complemented with travel diary surveys to generate information about travel patterns of citizens in the City of Dubuque, Iowa. • Data Generated • O/D Matrices • Corridor Speed • Meaningful Locations • Travel Modalities • Trip Purpose, etc. • Project Outcome • Primary - Public Transit Route Optimization • Secondary – Adjust Signal Timing, Reduce Accidents, Resource Planning, etc. Metropolitan Agency Emergency Management Small Cities Department of Transportation Regional Planning Law Enforcement City Engineering City Planning
  • 7.
    Smarter Travel Proposed Analytics/OptimizationProcess 7 Trip mode estimation Duration of Stay Estimation Trip Segmentation Trip Purpose Estimation Meaningful Location Classification O/D from Smart phone Points of Interest O/D Airsage Data Smartphone Data Cell phone data O/D Travel Survey Compare With Travel Diary info Household Travel Survey DMATS Four step model Screen line test Clean Sheet route Optimization Optimal Routes Recruitment • Household Income • Household size • Number of Workers • Location Travel Diary Data Travel Diary Smart Phone Apps Sampling Size Phase 1 Phase 2 Phase 2 Phase 3 Phase 4 Phase 5
  • 8.
    Smarter Travel Mobile Application 8 Infrastructure •Private IBM cloud • Secure and anonymized transmission of samples • Integration with other datasets Supported Platforms • iOS 7.1.1+ • Android 4.3+ User Experience • Periodic uploads • Battery-optimized sampling • Accuracy enhance sampling • Client notifications
  • 9.
    Smarter Travel Trip SegmentationAnalysis 9 • Display daily trajectories. • Display stops and trips. Clicking on each stop or trip will display its properties, such as starting/stopping time, duration, land use, trip purpose and trip mode. • Ability to pin custom locations on the map.
  • 10.
    Smarter Travel Trip PurposeClassification and O/D Matrix 10 • 3 categories of POIs (schools, shopping/restaurants, other) • Classify work and home locations based on duration of stay and time of day • Trip purpose: home-based work, non-home-based work, home-based school, non-home- based school, home-based shopping, non-home-based shopping, home-based other, and non-home-based other. These categories will be used to partition the O/D matrix • The O/D matrix is aggregated between all the users and for different time intervals
  • 11.
    Smarter Travel Trip PurposeClassification and O/D from Travel Diary 11
  • 12.
    Smarter Travel Validation ofSmartphone and Travel diary data 12 The Smarter phone data and Travel Diary data are compared at different levels. Level 1: Data collection The Smartphone data and Travel Diary data are compared to check accuracy of • Location • Missing trips • Mode choice Level 2: Trip purpose The Smart phone data is compared to Travel Diary data to check purpose of the trip Level 3: Origin/Destination matrix The origin/Destination matrix from both sources are compared to each other once the survey sample is extrapolated to MPO Smartphone peak O/D Travel Diary peak O/D
  • 13.
    Smarter Travel Meaningful Location 13 •Time options: days of week, all weekends, all weekdays and all days of week. • View data in time periods. • Overlay location clusters.
  • 14.
    Smarter Travel Corridor Speedand Travel Time 14 • Corridor speed or travel time • Time options: Time of Day • Direction of Travel.
  • 15.
    Smarter Travel Bus RouteOptimization approach 15 • Input data: • Street intersections and street links • Travel time of various travel modes on each link • Maximum number of buses and bus capacities. • O/D matrix • Additional constraints/requirements • Generate a set of candidate routes • Can include constraints such as hubs, limited change from current routes, etc. • Choose an optimal set of routes minimizing average travel time by formulating objective function and optimization problem as an mixed integer program (MIP). • Solve MIP using 2 types of algorithms: CPLEX and Volume algorithm • Routes are adjusted based on feedback and expert guidance from Jule Generate candidate routes Select optimal set of routes
  • 16.
    Smarter Travel Optimized Busroutes 16 Bus routes based on peak period O/D
  • 17.
    Smarter Travel Contact info Contacts 17 ChandraRavada Director of Transportation Department East Central Intergovernmental Association ph.: 563-556-4166 e-mail: cravada@ecia.org Web Sources http://www.cityofdubuque.org/1496/Smarter-Travel http://www.eciatrans.org/DMATS/SmarterTravel.cfm

Editor's Notes

  • #3 City of Dubuque in 1980. Better connectivity Smaller headways How is this possible Less automobile ownership hence more dependent on transit The system is designed to connect major residential areas with attraction zones in the region Total number of annual ridership in 1980’s is 1.4 million
  • #4 City of Dubuque in 2010. The Connectivity is not good as the routes are not designed basing on the needs Headways increased How did this happen More automobile ownership hence less dependent on transit The system is not able to meet the needs in the region as costs increased and revenue decreased Total ridership in 2010 is 400,000
  • #5 Service got cut as revenue decreased and cost increased. The headways increased and frequency decreased as service got cut. The negative perception about the system increase as the system became less reliable. With negative perception the ridership went down and revenues decreased. With less ridership there is less federal aid and the system became more dependent on local governments.
  • #6 The Plan is to develop demand by time of day in the area and see how we can accommodate the demand. Redesign the routes and stop locations and optimize operation by tome of day activity. The plan is also designed to measure unmet needs and suggest new routes to accommodate unmet needs. How are we planning to do this. Traditional survey might work but we are not sure as trip patterns are dependent on seasons in our region We chose to use technology to gather data as it can accommodate data gather for longer periods. We created a marketing plan to advertise the new routes and attract new transit users.
  • #7 The project is designed to identify options for commuters to save money, conserve resources, and improve the environment through better travel choices, whether it’s utilizing public transit, bicycles or walking. The project is designed to generate origin/destination matrix by mode choice and corridor speed using smart phone, traditional survey and Airsage data. The O/D matrices are used to generate optimization route for public transit. The project is expected to increase transit ridership to capture 8% of overall transportation trips within the metro area over the course of the next three years. The data will be used in other projects like eliminating delays by adjusting signal timing by time if day travels, reduce accident prone areas etc. The phase II of the project will involve Multidisiplinary safety teams.
  • #8  Phase 1 o data analysis for sample size, online survey for recruitment, travel diary to collect origin/destination information, determining recruitment sample size, and developing the public engagement and recruitment plan. o developing and testing iPhone and android applications to collect origin/destination information and development of transit route optimization process. Phase 2 o volunteer recruitment based on demographic data. Phase 3 o create O/D from traditional survey methods, smart phone data and Airsage data. Phase 4 o Screenline testing of O/D using DMATS travel demand forecast model. Phase 5 o Transit route optimization using Origin / Destination (O/D) from traditional methods, smart phone and Airsage data.
  • #9 Two applications for collecting GPS location data from the volunteer’s smartphones were developed, one for the iOS platform and one for the Android platform. The gathered data is sent to the IBM cloud, where it is processed, analyzed, and aggregated for the various insights, models, and for the optimization of various services. The system cleans the data taking into account data transfer and sampling errors and converts it into a series of locations of the volunteers. It runs as a background service for all practical purposes with a minimal user interface. The application senses the subject’s location, accuracy of location data, speed and timestamp data and transmits the data to the backend data gateway. Since location tracking is critical to the successful execution of the app, notifications are provided to the user if location tracking is turned off on the phone. A major challenge of using the GPS receiver on smart phones is its high energy consumption; it is one of the most energy consuming components on smart phones. Usually a GPS receiver consumes one order of magnitude more energy than low power sensors such as accelerometer, and two to three orders of magnitude more energy than processor and memory. An adaptive sensing algorithm is used to minimize the duration of having the GPS hardware turned on.
  • #10 To support the recruitment process, a dashboard was developed that provides self-service access to the recruitment team (as well as other authorized users) to daily reports and analytics data of new users, active users, and inactive users. The dashboard is delivered on the IBM Cloud and secured via IBM Identification (IBM ID). The dashboard currently supports multiple types of reports. For instance, Trip Analysis by User provides a listing of all the volunteers that have downloaded and installed the app. Additional information such as the volunteer’s status, phone number, enrollment date, enrolled days, active days, first upload, last upload, device, phone type and version are also made available. A user trajectory map overlays trip analysis results, and allows pinning of user submitted address to the map. This function will be used to validate the accuracy of the trips capture via the trip diary with the trips from the Smartphone. Clicking on the individual stop will show the starting and stopping time of each stop, the stop duration and land use of selected stop. Click on the individual trip will show the starting and stopping time of each trip, trip duration, trip purpose and trip mode.
  • #11 This report provides an overview of activity of all TAZs along various dimensions, such as time, day of week, time of day, trip purpose and trip mode. The system uses a rule-based trip purpose classification algorithm to estimate the initial trip purposes without volunteer input or domain knowledge. The algorithm uses arrival time, arrival day, stop time, the nearest point of interest (POI) or land use of the origin and destination, and the distances between origin/destination and home/work/school etc. The trip purpose classification algorithm is run after all the trip analysis is run on all volunteer GPS over the recruitment period and has identified the stops of each user over the entire period. Trip purpose can be: home-based work, non-home-based work, home-based school, non-home-based school, home-based shopping, non-home-based shopping, home-based other, and non-home-based other. Clicking on a TAZ shows a network of connections to/from this TAZ to other TAZs. Clicking on a connection shows the traffic information between 2 TAZs. Additional statistics about the TAZ are available in the side panel.
  • #12 The purpose classification and O/D from Travel Diary is based on the activity and mode choice of the trip.
  • #13 The Smarter phone data and Travel Diary data are compared at different levels. Level 1: Data collection The Smartphone data and Travel Diary data are compared to check accuracy of Location Missing trips Mode choice Level 2: Trip purpose The Smart phone data is compare to Travel Diary data to check purpose of the trip Level 3: Origin/Destination matrix The origin/Destination matrix from both sources are compared to each other once the survey sample is extrapolated to MPO
  • #14 Meaningful location detection is a procedure to extract important places from volunteer GPS trajectories. The important places can be home, work, shopping, or school. The system’s measurement of the “importance” of a place is based on how long the volunteer stays there and how many people have visited the same location. The system uses spatial clustering techniques to detect meaningful locations. In spatial clustering, all the geo-location points of daily events are clustered into groups. These meaningful locations are used by the home and work detection algorithm combined with the duration of stay, time of day and landuse data.
  • #15 Corridor speed is the average speed on roads during a specific time interval. The speed on roads with classification fedfunc < 5 is collected from smartphone data. All the trips from all users and across all days are extracted. The direction of the movement is also detected. The speed data points for each trip of each user on the same street are interpolated via piecewise-linear interpolation and the average speed computed from the integral of the interpolated function. The dashboard allows the average speed to be computed and displayed based on time bucket and direction.
  • #16 A 2 phase approach will be utilized to generate the optimal transit route network based on the O/D data. The bus route optimization algorithm is formulated as a Mixed Integer Program (MIP). In phase 1, a set of candidate routes are generated incorporating constraints and requirements such as preference for hubs or city centers, avoidance of certain streets, limit on the route size, maximizing coverage, using existing bus stops, etc. Starting with a set of candidate links, a set of candidate routes is generated based on shortest paths and/or the addition of links to a set of partial or predefined routes. In phase 2, an optimization algorithm is applied to select optimal routes from the set of candidate routes based on the objective function incorporating the tradeoffs described above. The objective function minimizes the total travel time for all the people traveling. The model includes a constraint on the number of buses that can be used in order to limit the operator cost. Other constraints include flow conservation constraints for each O-D pair, which says that the number of people arriving at each node is equal to the number of people leaving the node, and bounds on the number of people traveling by bus on each link based on the bus capacity. The model assumes that on each link people can either walk or take public transit. Two approaches were investigated to solve the MIP problem: CPLEX and the Volume algorithm. We decided to use the Volume algorithm because it is more efficient at a minor tradeoff in optimality. A key observation from the analysis is that there are several constraints and requirements about practical bus routes that are not available or not quantifiable and require the expertise from Jule to guide the optimization. In addition, the output from the optimization is expected to be tweaked and validated by Jule before physical implementation.
  • #17 Here is an example of the generated bus routes based on O/D data during peak period. There are more routes downtown as the O/D matrix is more connected with more links in these areas.