Download to read offline
![Challenge – Recruiting and retaining subjects
Past mobile apps have been created specifically to replace travel
behavior surveys:
• TRAC-IT [1]
• Future Mobility Survey [2]
• Quantified Traveler[3]
• SmarTrAC [4]
• Florida Trip Tracker[5]
These apps all suffer from user fatigue from manually recorded trips
and have only been deployed in small research settings
• No ongoing incentive or value to user for using app
• Negative impacts on battery life
[1] Philip L. Winters, Sean J. Barbeau, and Nevine L. Georggi (2008). "Smart Phone Application to Influence Travel Behavior (TRAC-IT Phase 3)," National Center for Transit Research.
[2] C; Pereira Cottrill, F.; Zhao, F.;Dias,I.; Lim, H. B. ;Ben-Akiva, M.;Zegra, C. (2013), "Future Mobility Survey: Experience in Developing a Smart-Phone-Based Travel Survey in Singapore," Transportation Research Record, pp. 59-67.
[3] Jerald; Abou-Zeid Jariyasunant, Maya; Carrel, Andre;Ekambaram, Venkatesan (2019), "Quantified Traveler: Travel Feedback Meets the Cloud to Change Behavior," Journal of Intelligent Transportation Systems, Vol. 19 pp. 1-16.
[4] Yingling ; Wolfson Fan, Julian ;Adomavicius,Gediminas ; Das, Kirti V; Khandelwal, Yash ;Kang,Jie (2015). "SmarTrAC: A Smartphone Solution for Context-Aware Travel and Activity Capturing," University of Minnesota, February 2015.
[5] AECOM Tallahassee. "Florida Trip Tracker." Accessed December 11, 2019 from https://play.google.com/store/apps/details?id=com.urs.triptracks](https://image.slidesharecdn.com/improvingthequalityandcosteffectivenessofmultimodaltravelbehaviordatacollection-v2-200424143545/75/Improving-the-quality-and-cost-effectiveness-of-multimodal-travel-behavior-data-collection-6-2048.jpg)
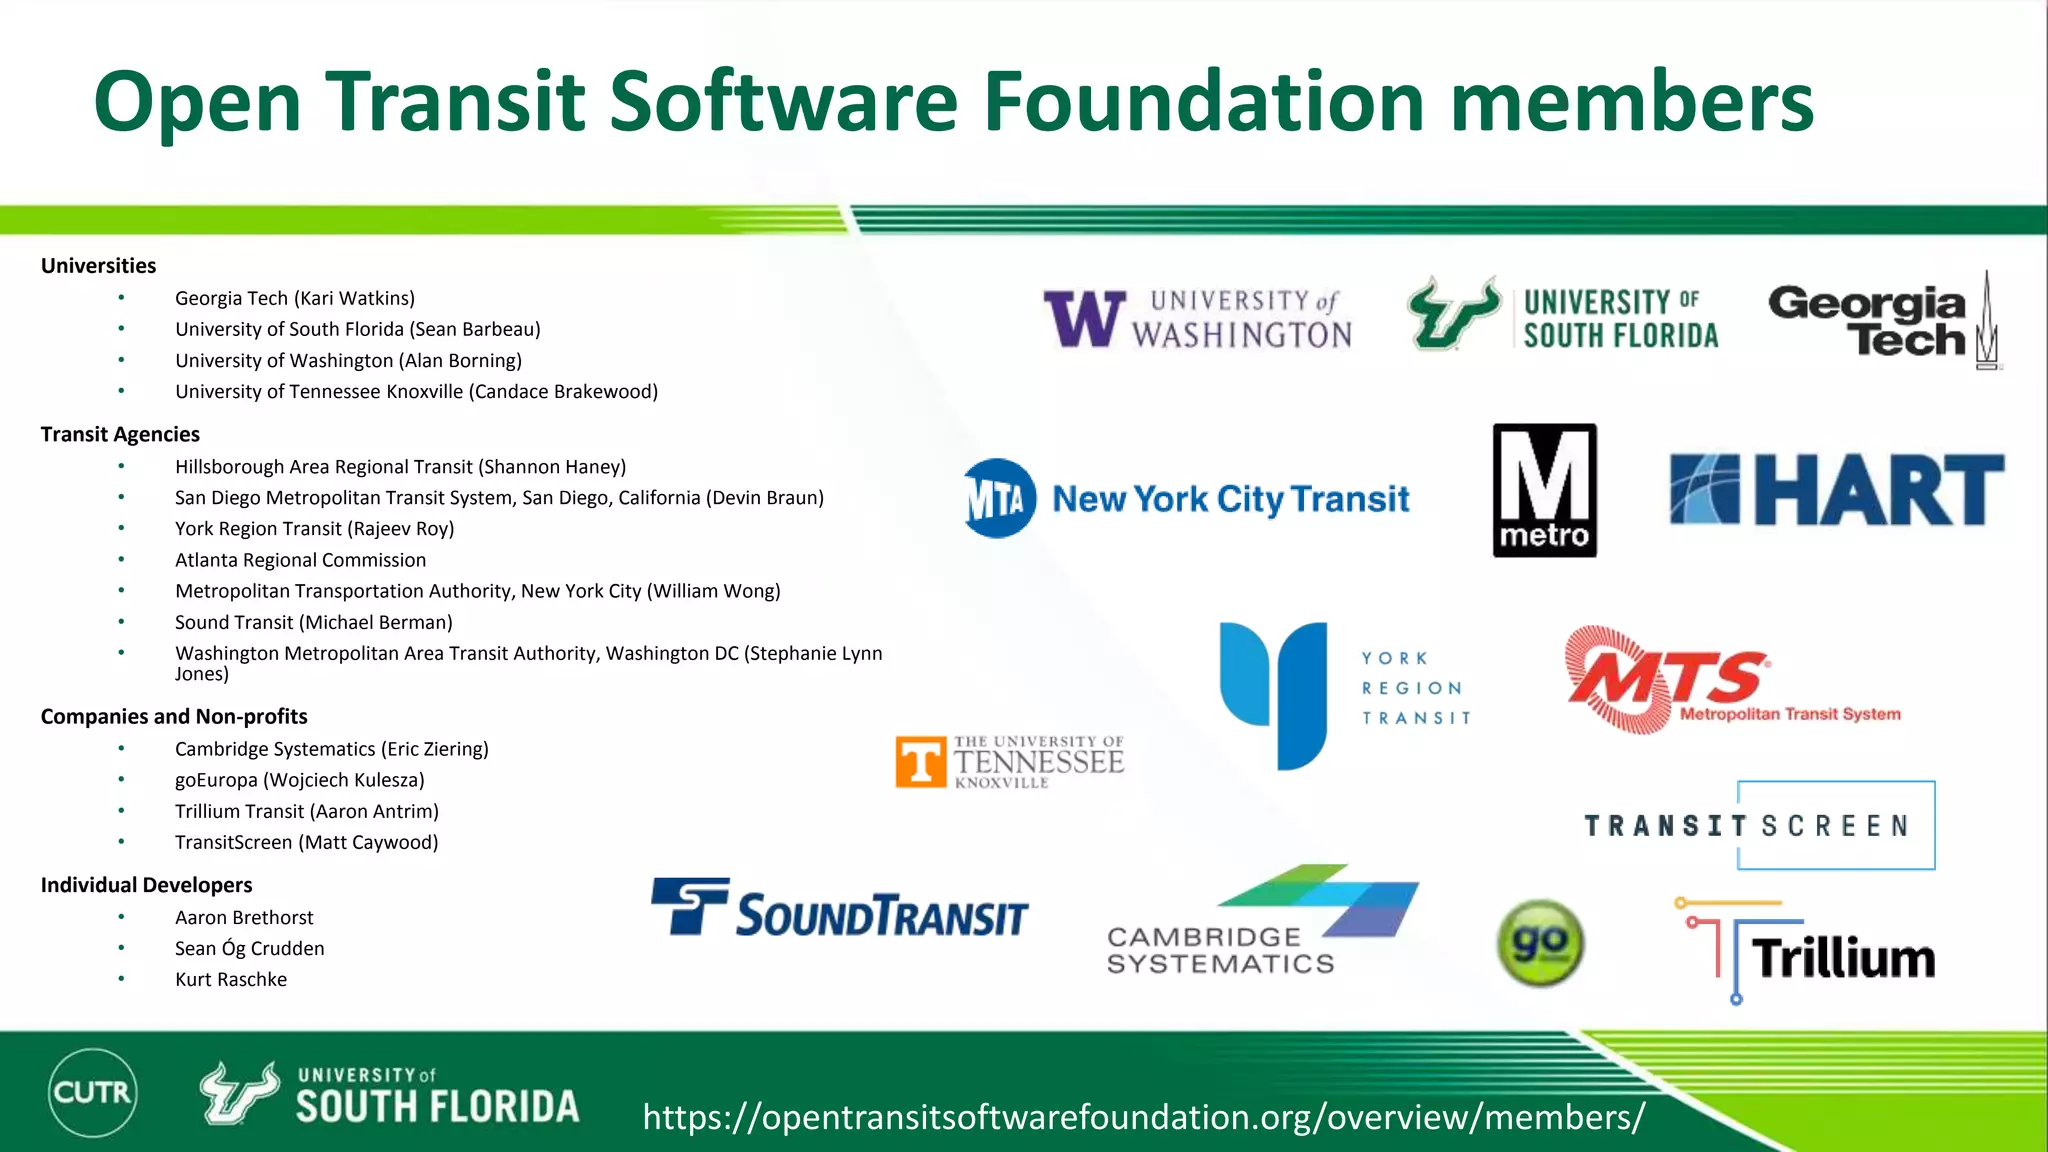
![Solution - OneBusAway
An open-source platform for real-time transit information
Supported by the Open Transit Software Foundation, a 501(c)3 non-profit
• Includes transit agencies, universities, consultants, and independent
developers
Deployed by agencies in 11 cities worldwide
Agencies see advantages to pooling resources to implement similar rider-
facing features[6]
For iOS and Android (not including web, SMS, IVR, Alexa):
• Over 1 million unique users
• Typically ~330k active users in the last 30 days
Hundreds of thousands more when including web and white-label
deployments
Platform for research (users can opt-in)
onebusaway.org
[6] Sean J. Barbeau, Steven Polzin. “Open Source Software in Public Transportation: A Case Study,” Presented at the
Transportation Research Board (TRB) 99th Annual Meeting, Washington, D.C., January 12-16, 2020.](https://image.slidesharecdn.com/improvingthequalityandcosteffectivenessofmultimodaltravelbehaviordatacollection-v2-200424143545/75/Improving-the-quality-and-cost-effectiveness-of-multimodal-travel-behavior-data-collection-7-2048.jpg)


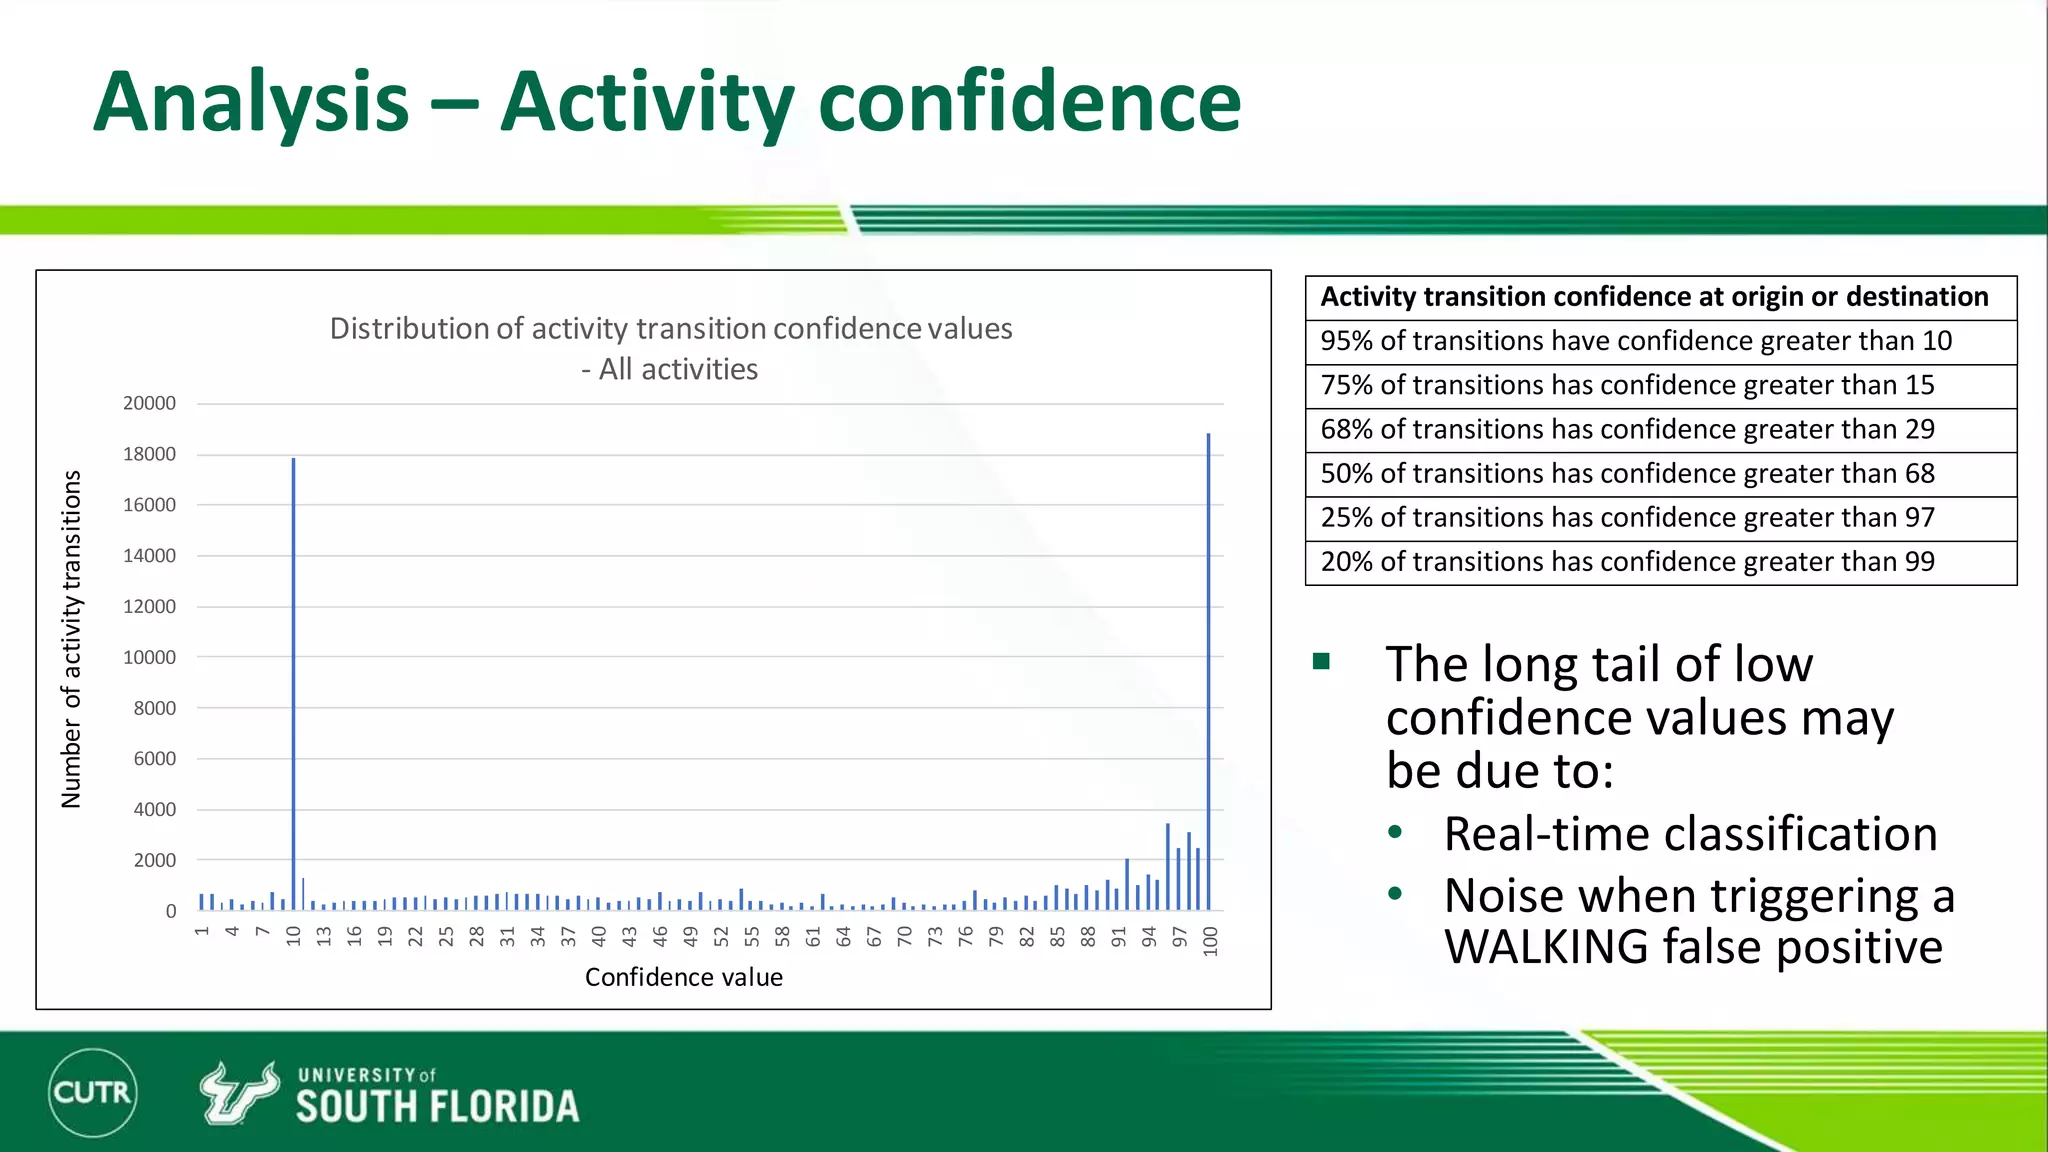
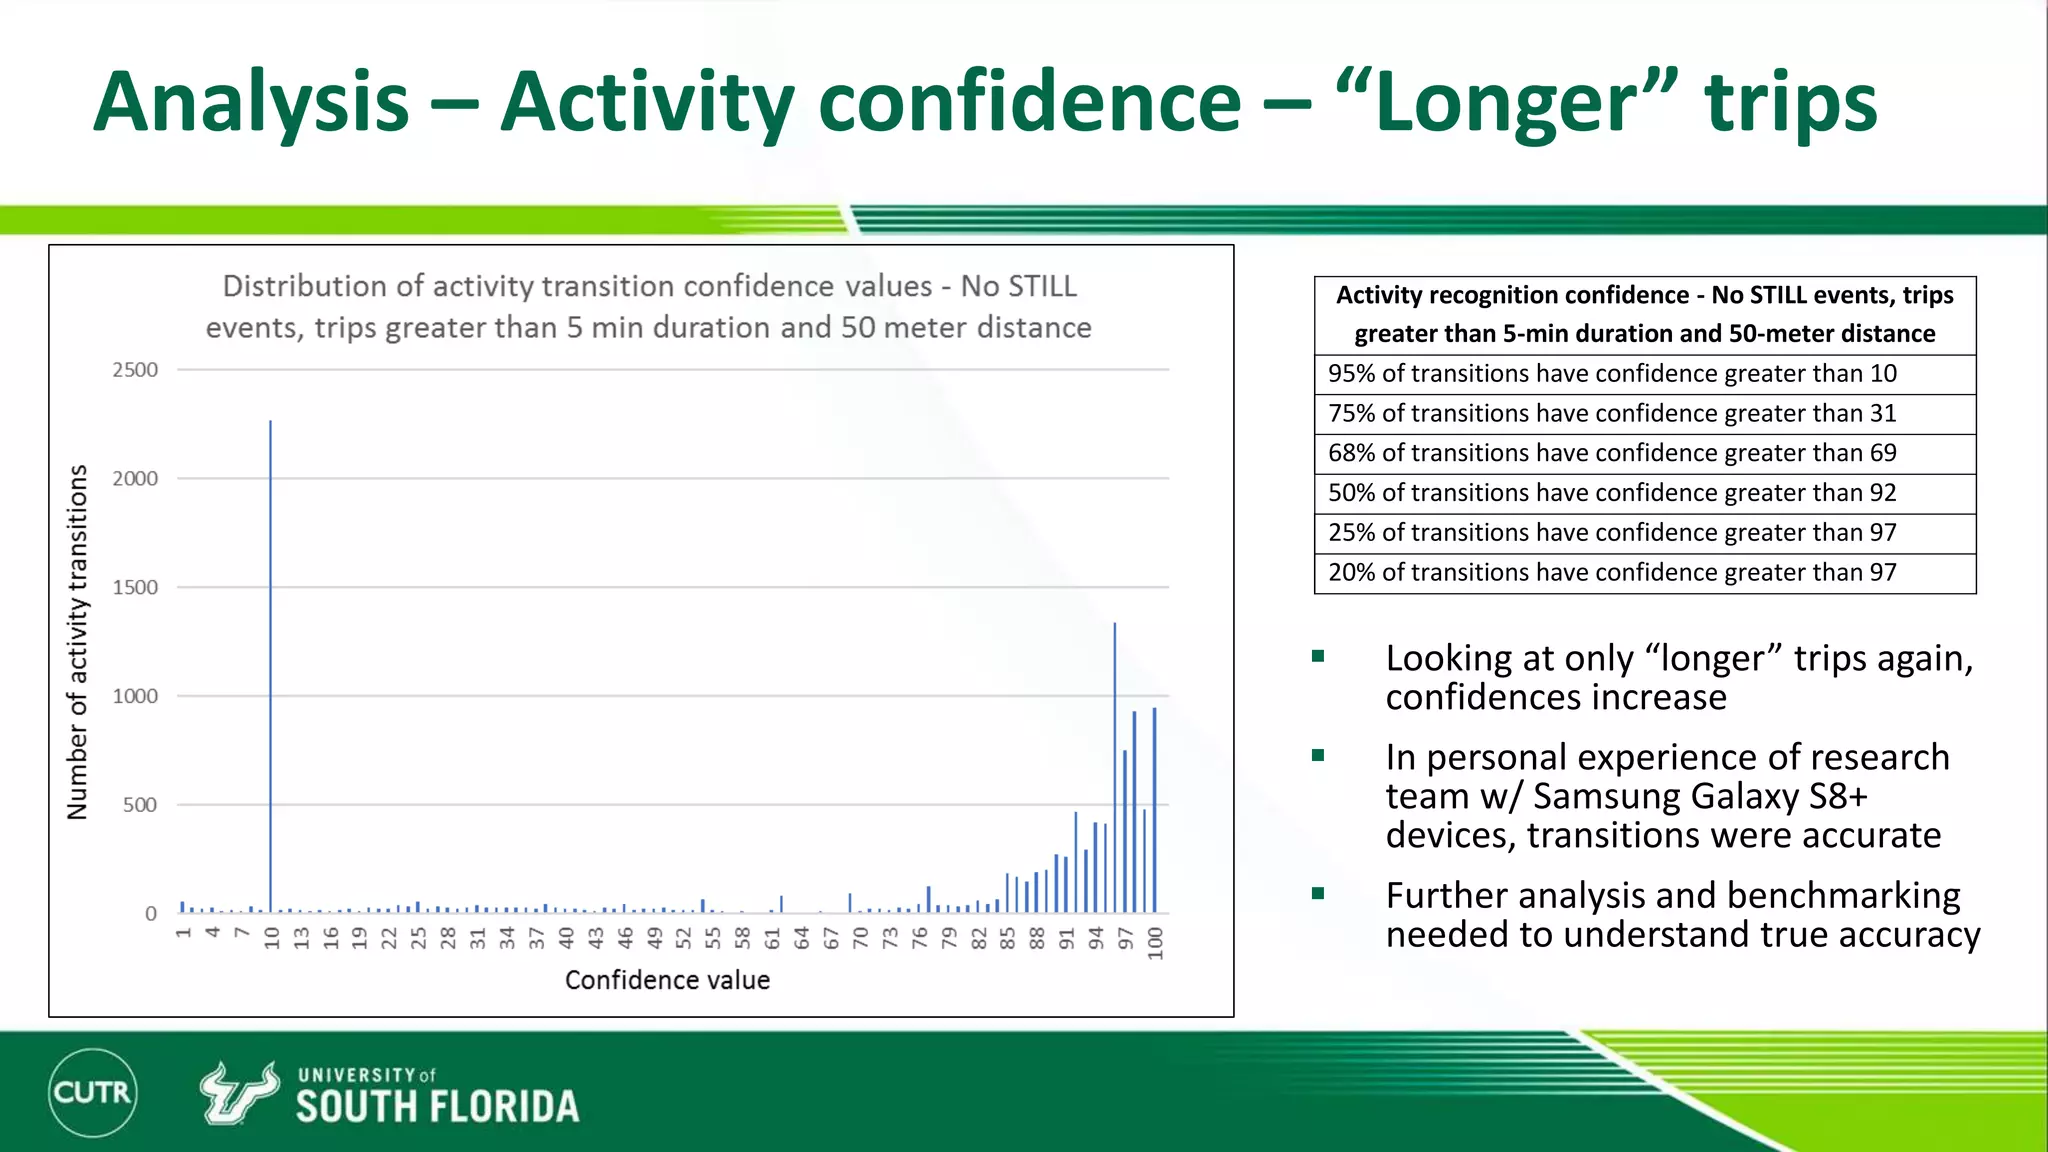
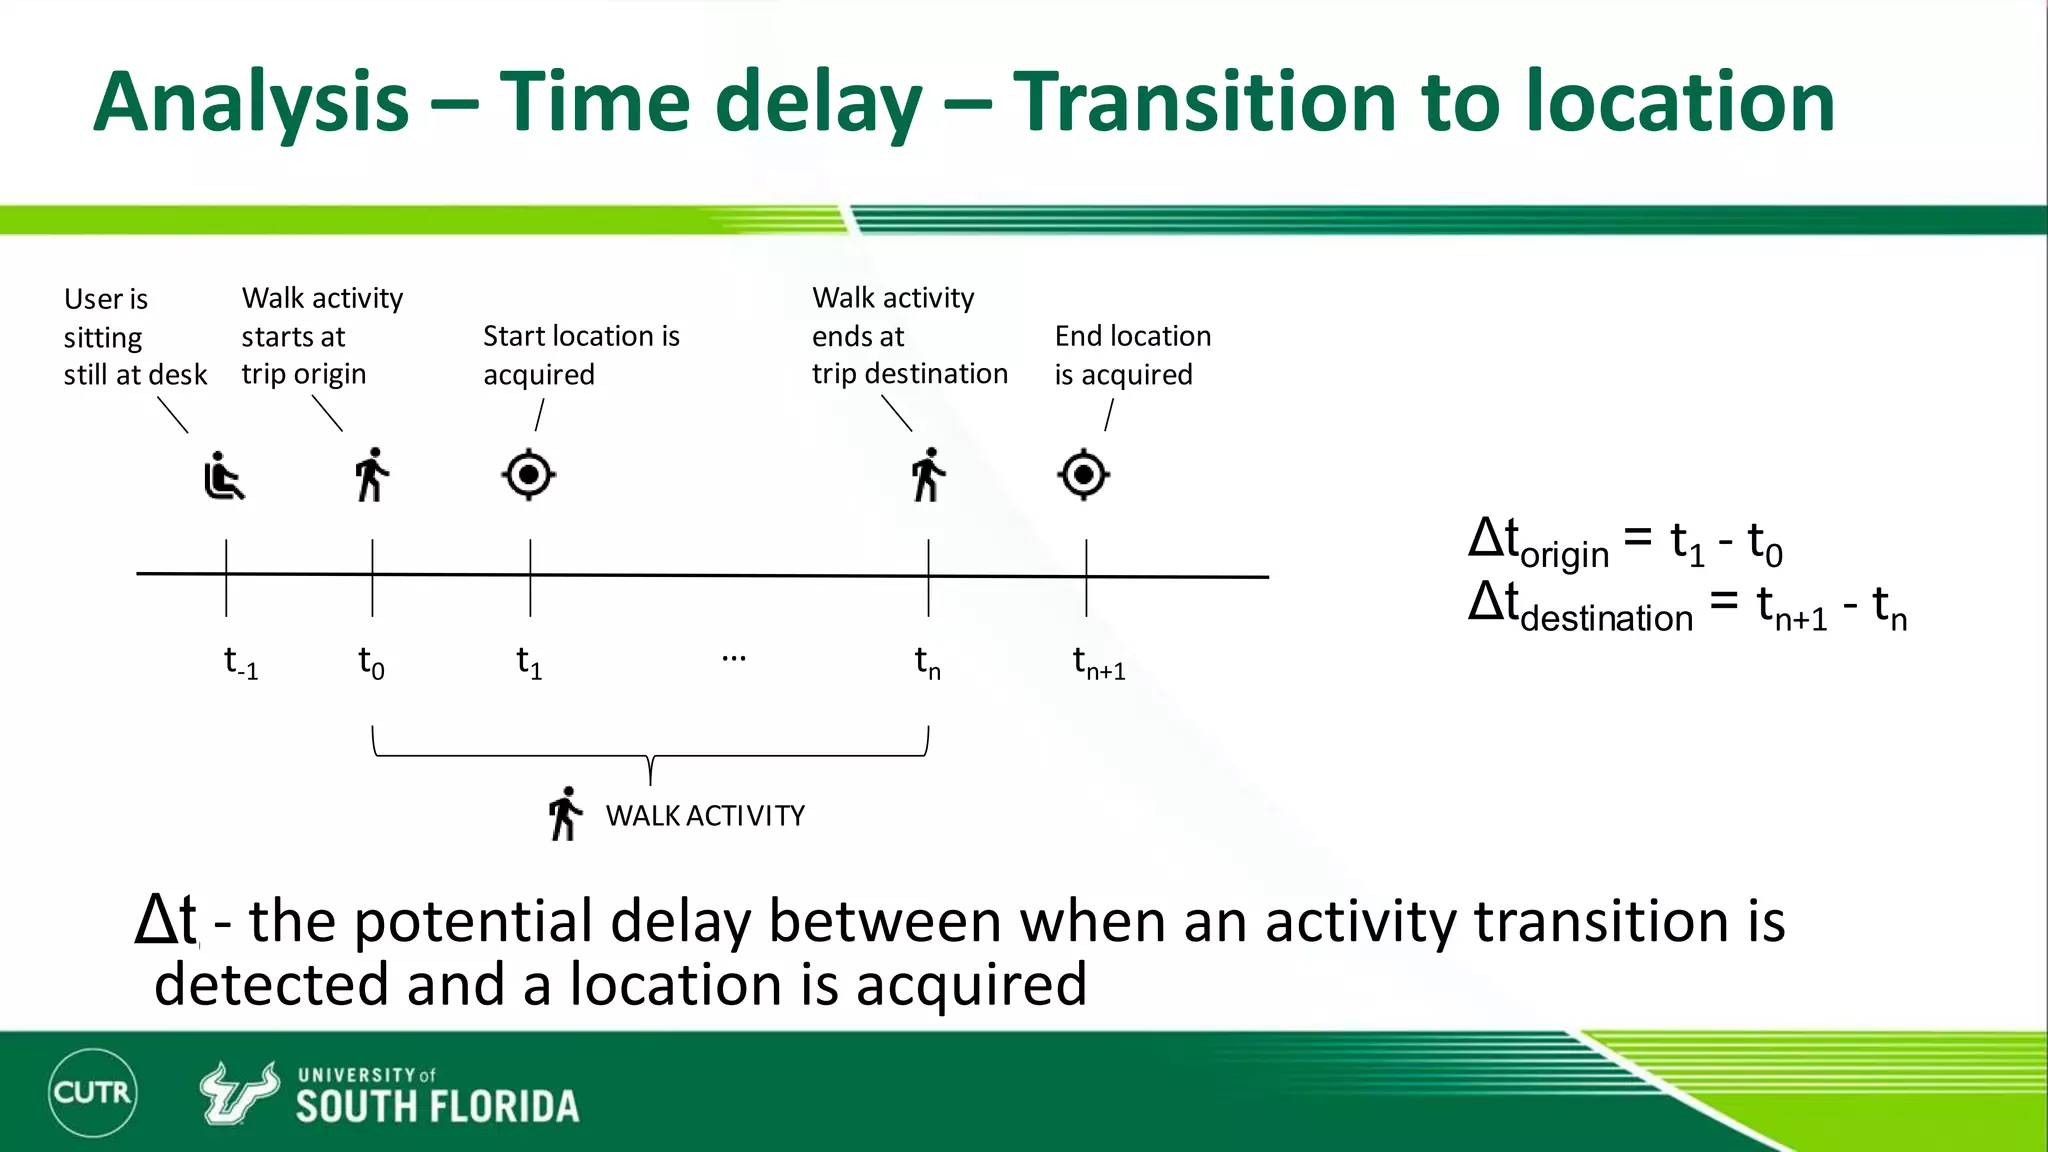
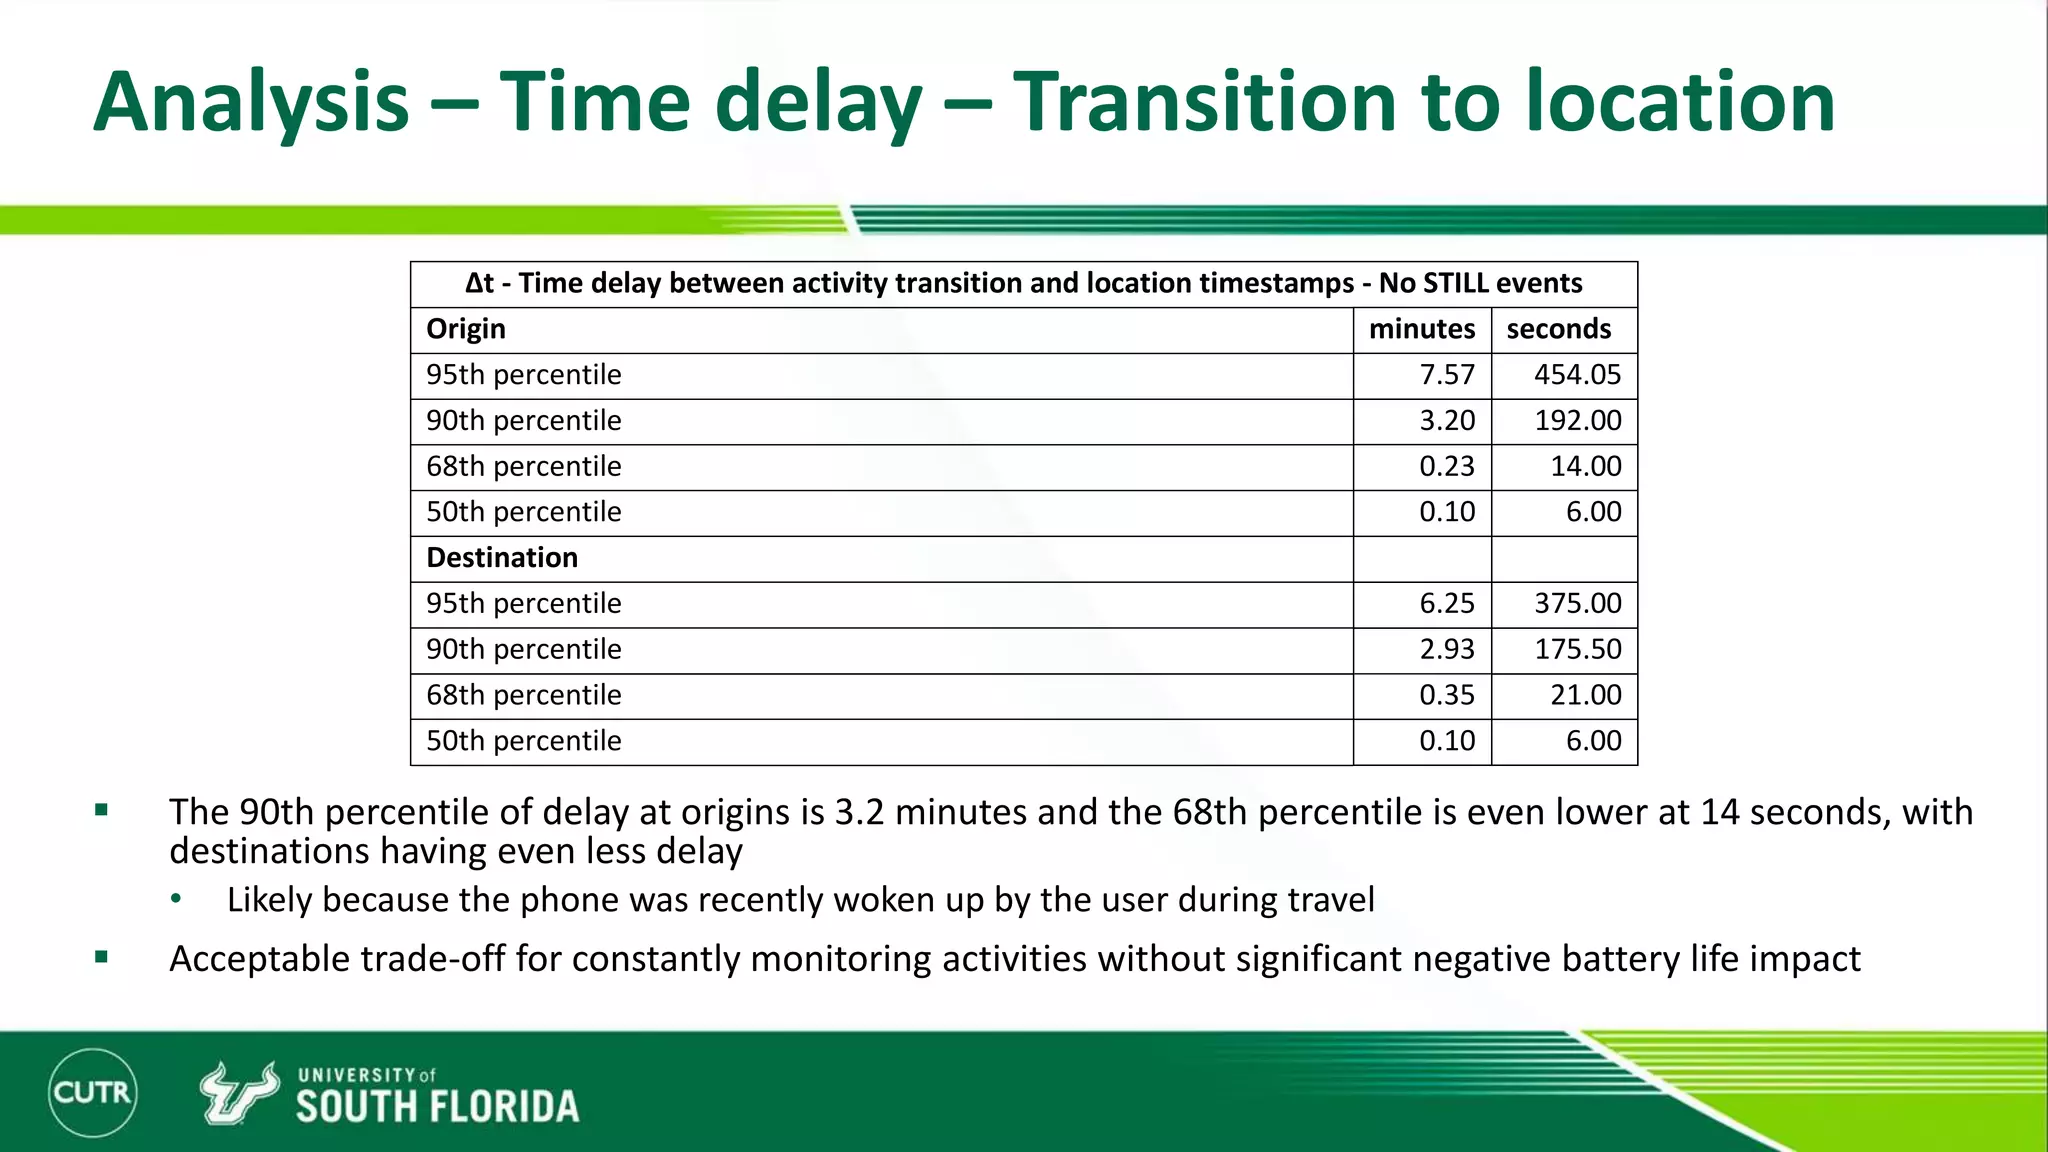


The document discusses a project aimed at improving the quality and cost-effectiveness of multimodal travel behavior data collection, addressing limitations in current methods such as manual trip recording and app-based fatigue. The solution involves leveraging an open-source platform called OneBusAway, which uses sensor co-processors in mobile devices to accurately capture user activities and collect data without significantly impacting battery life. Preliminary findings suggest successful data collection with minimal user fatigue and acceptable accuracy, showcasing the promise of app-based transitions for further transportation studies.