Microtransit Planning &
Implementation Lessons from the
NC Experience
Subid Ghimire1, Dr. Eleni Bardaka1, Dr. Kai Monast2,
Juan Wang1, Waugh Wright2, and Jeremy Scott2
1 Department of Civil, Construction, and Environmental Engineering,
North Carolina State University (NCSU)
2 Institute for Transportation Research and Education (ITRE), NCSU
Research objectives
• Consolidate the experience of the six transit agencies in NC that
have implemented microtransit
• Discuss the challenges they faced during planning and
implementation and the lessons learned
• Examine the cost of microtransit systems through analysis of the
operational expenditures and the contracts public agencies formed
with service providers.
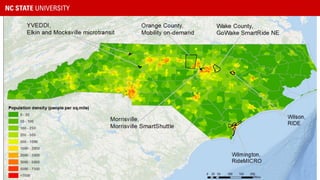
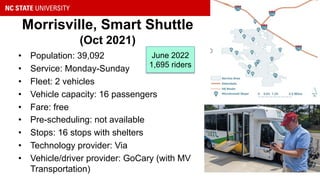
Morrisville, Smart Shuttle
(Oct 2021)
• Population: 39,092
• Service: Monday-Sunday
• Fleet: 2 vehicles
• Vehicle capacity: 16 passengers
• Fare: free
• Pre-scheduling: not available
• Stops: 16 stops with shelters
• Technology provider: Via
• Vehicle/driver provider: GoCary (with MV
Transportation)
June 2022
1,695 riders
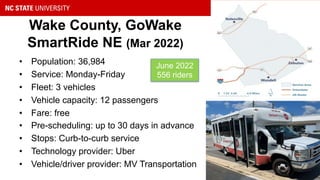
Wake County, GoWake
SmartRide NE (Mar 2022)
• Population: 36,984
• Service: Monday-Friday
• Fleet: 3 vehicles
• Vehicle capacity: 12 passengers
• Fare: free
• Pre-scheduling: up to 30 days in advance
• Stops: Curb-to-curb service
• Technology provider: Uber
• Vehicle/driver provider: MV Transportation
June 2022
556 riders
YVEDDI, Elkin and Mocksville
microtransit (Jul 2022)
• Population: 5,484
• Service: Monday-Friday
• Fleet: 4 vehicles
• Vehicle capacity: 12-15 passengers
• Fare: $1
• Pre-scheduling: up to 2 days in advance
• Stops: Curb-to-curb service
• Technology provider: CTS
• Vehicle/driver provider: YVEDDI
Planning and implementation challenges
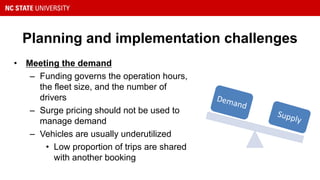
• Meeting the demand
– Funding governs the operation hours,
the fleet size, and the number of
drivers
– Surge pricing should not be used to
manage demand
– Vehicles are usually underutilized
• Low proportion of trips are shared
with another booking
Demand
Supply
Planning and implementation challenges
• ADA compliance
– If microtransit replaced a fixed route, the
requirement for ADA paratransit is removed
– Equivalent service to individuals with
disabilities
– Different process for scheduling, limited ADA
certified operators, limited numbers of ADA
compliant vehicles
Planning and implementation challenges
• Banking and technology related barriers
– Call centers are important
– Most trips requested by phone in Wilmington
and Wake
– Trip requests may require electronic form of
payment
Planning and implementation challenges
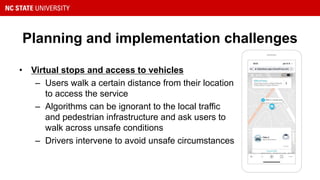
• Virtual stops and access to vehicles
– Users walk a certain distance from their location
to access the service
– Algorithms can be ignorant to the local traffic
and pedestrian infrastructure and ask users to
walk across unsafe conditions
– Drivers intervene to avoid unsafe circumstances
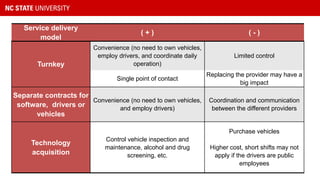
Service delivery
model
( + ) ( - )
Turnkey
Convenience (no need to own vehicles,
employ drivers, and coordinate daily
operation)
Limited control
Single point of contact
Replacing the provider may have a
big impact
Separate contracts for
software, drivers or
vehicles
Convenience (no need to own vehicles,
and employ drivers)
Coordination and communication
between the different providers
Technology
acquisition
Control vehicle inspection and
maintenance, alcohol and drug
screening, etc.
Purchase vehicles
Higher cost, short shifts may not
apply if the drivers are public
employees
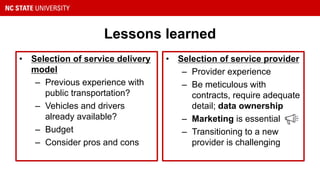
Lessons learned
• Selection of service delivery
model
– Previous experience with
public transportation?
– Vehicles and drivers
already available?
– Budget
– Consider pros and cons
• Selection of service provider
– Provider experience
– Be meticulous with
contracts, require adequate
detail; data ownership
– Marketing is essential
– Transitioning to a new
provider is challenging
Lessons learned
• Data ownership
– Unless explicitly specified in the contract, the
technology provider owns the microdata
– The agency can only access daily, weekly,
monthly reports
– Public agencies need to negotiate data
ownership in the contract with the technology
provider
Lessons learned
• On-demand vs. pre-scheduled trips
– Strictly on-demand systems may not
work well for time-sensitive trips and
pattern-reliant individuals
• Transitioning beyond microtransit
– Uncover transportation need
– Leverage data to plan future public
systems
Funding Acknowledgment
Contacts
• Dr. Eleni Bardaka ebardak@ncsu.edu
• Dr. Kai Monast kai_monast@ncsu.edu
Supplementary slides
Service delivery models
• Turnkey model: technology, vehicles, drivers, and operations
through a single contract with one private provider
• Separate contracts for technology, drivers, or vehicles with different
entities
• Technology acquisition model: the public agency owns the
vehicles and ensures that vehicle operators are available while
contracting with a private service provider to obtain the technology
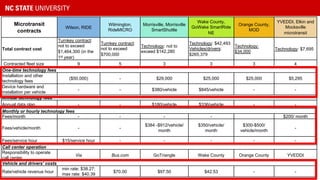
Microtransit
contracts
Wilson, RIDE
Wilmington,
RideMICRO
Morrisville, Morrisville
SmartShuttle
Wake County,
GoWake SmartRide
NE
Orange County,
MOD
YVEDDI, Elkin and
Mocksville
microtransit
Total contract cost
Turnkey contract:
not to exceed
$1,464,300 (in the
1st year)
Turnkey contract:
not to exceed
$700,000
Technology: not to
exceed $142,280
Technology: $42,493
Vehicles/drivers:
$265,379
Technology:
$34,000
Technology: $7,695
Contracted fleet size 9 5 3 3 3 4
One-time technology fees
Installation and other
technology fees
($50,000) - $29,000 $25,000 $25,000 $5,295
Device hardware and
installation per vehicle
- - $380/vehicle $845/vehicle - -
Annual technology fees
Annual data plan - - $180/vehicle $336/vehicle - -
Monthly or hourly technology fees
Fees/month - - - - $200/ month
Fees/vehicle/month - -
$384 -$912/vehicle/
month
$350/vehicle/
month
$300-$500/
vehicle/month
-
Fees/service hour $15/service hour - - - - -
Call center operation
Responsibility to operate
call center
Via Bus.com GoTriangle Wake County Orange County YVEDDI
Vehicle and drivers’ costs
Rate/vehicle revenue hour
min rate: $38.27;
max rate: $40.39
$70.00 $97.50 $42.53 - -
Microtransit operational
expenditures
Wilson, RIDE
Wilmington,
RideMICRO
Morrisville, Morrisville
SmartShuttle
Wake County,
GoWake SmartRide
NE
Average monthly ridership 13,074 176 1,236 364
Latest monthly ridership (June
2022)
16,243 301 1,695 556
Cost per operating day $5,141 $2,106 $1,572 $806
Cost per vehicle revenue hour $72.92 $70.75 $95.43 $42.12
Cost per revenue mile $5.10 $22.47 $7.80 $3.61
Cost per passenger $10.26 $246.08 $38.30 $41.05
Operational expenditures
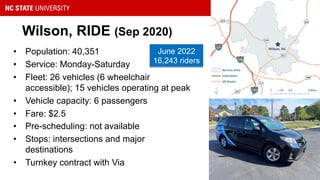
Wilson, RIDE (Sep 2020)
• Population: 40,351
• Service: Monday-Saturday
• Fleet: 26 vehicles (6 wheelchair
accessible); 15 vehicles operating at peak
• Vehicle capacity: 6 passengers
• Fare: $2.5
• Pre-scheduling: not available
• Stops: intersections and major
destinations
• Turnkey contract with Via
June 2022
16,243 riders
YVEDDI, Elkin and Mocksville
microtransit (Jul 2022)
• Population: 5,484
• Service: Monday-Friday
• Fleet: 4 vehicles
• Vehicle capacity: 12-15 passengers
• Fare: $1
• Pre-scheduling: up to 2 days in advance
• Stops: Curb-to-curb service
• Technology provider: CTS
• Vehicle/driver provider: YVEDDI
Ridership
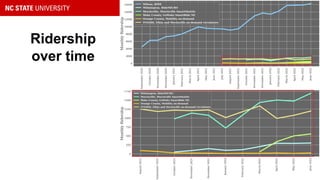
over time
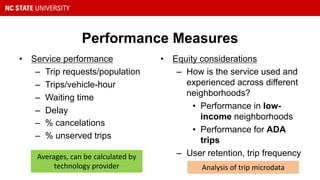
Performance Measures
• Service performance
– Trip requests/population
– Trips/vehicle-hour
– Waiting time
– Delay
– % cancelations
– % unserved trips
• Equity considerations
– How is the service used and
experienced across different
neighborhoods?
• Performance in low-
income neighborhoods
• Performance for ADA
trips
– User retention, trip frequency
Averages, can be calculated by
technology provider Analysis of trip microdata
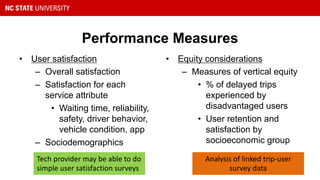
Performance Measures
• User satisfaction
– Overall satisfaction
– Satisfaction for each
service attribute
• Waiting time, reliability,
safety, driver behavior,
vehicle condition, app
– Sociodemographics
• Equity considerations
– Measures of vertical equity
• % of delayed trips
experienced by
disadvantaged users
• User retention and
satisfaction by
socioeconomic group
Tech provider may be able to do
simple user satisfaction surveys
Analysis of linked trip-user
survey data