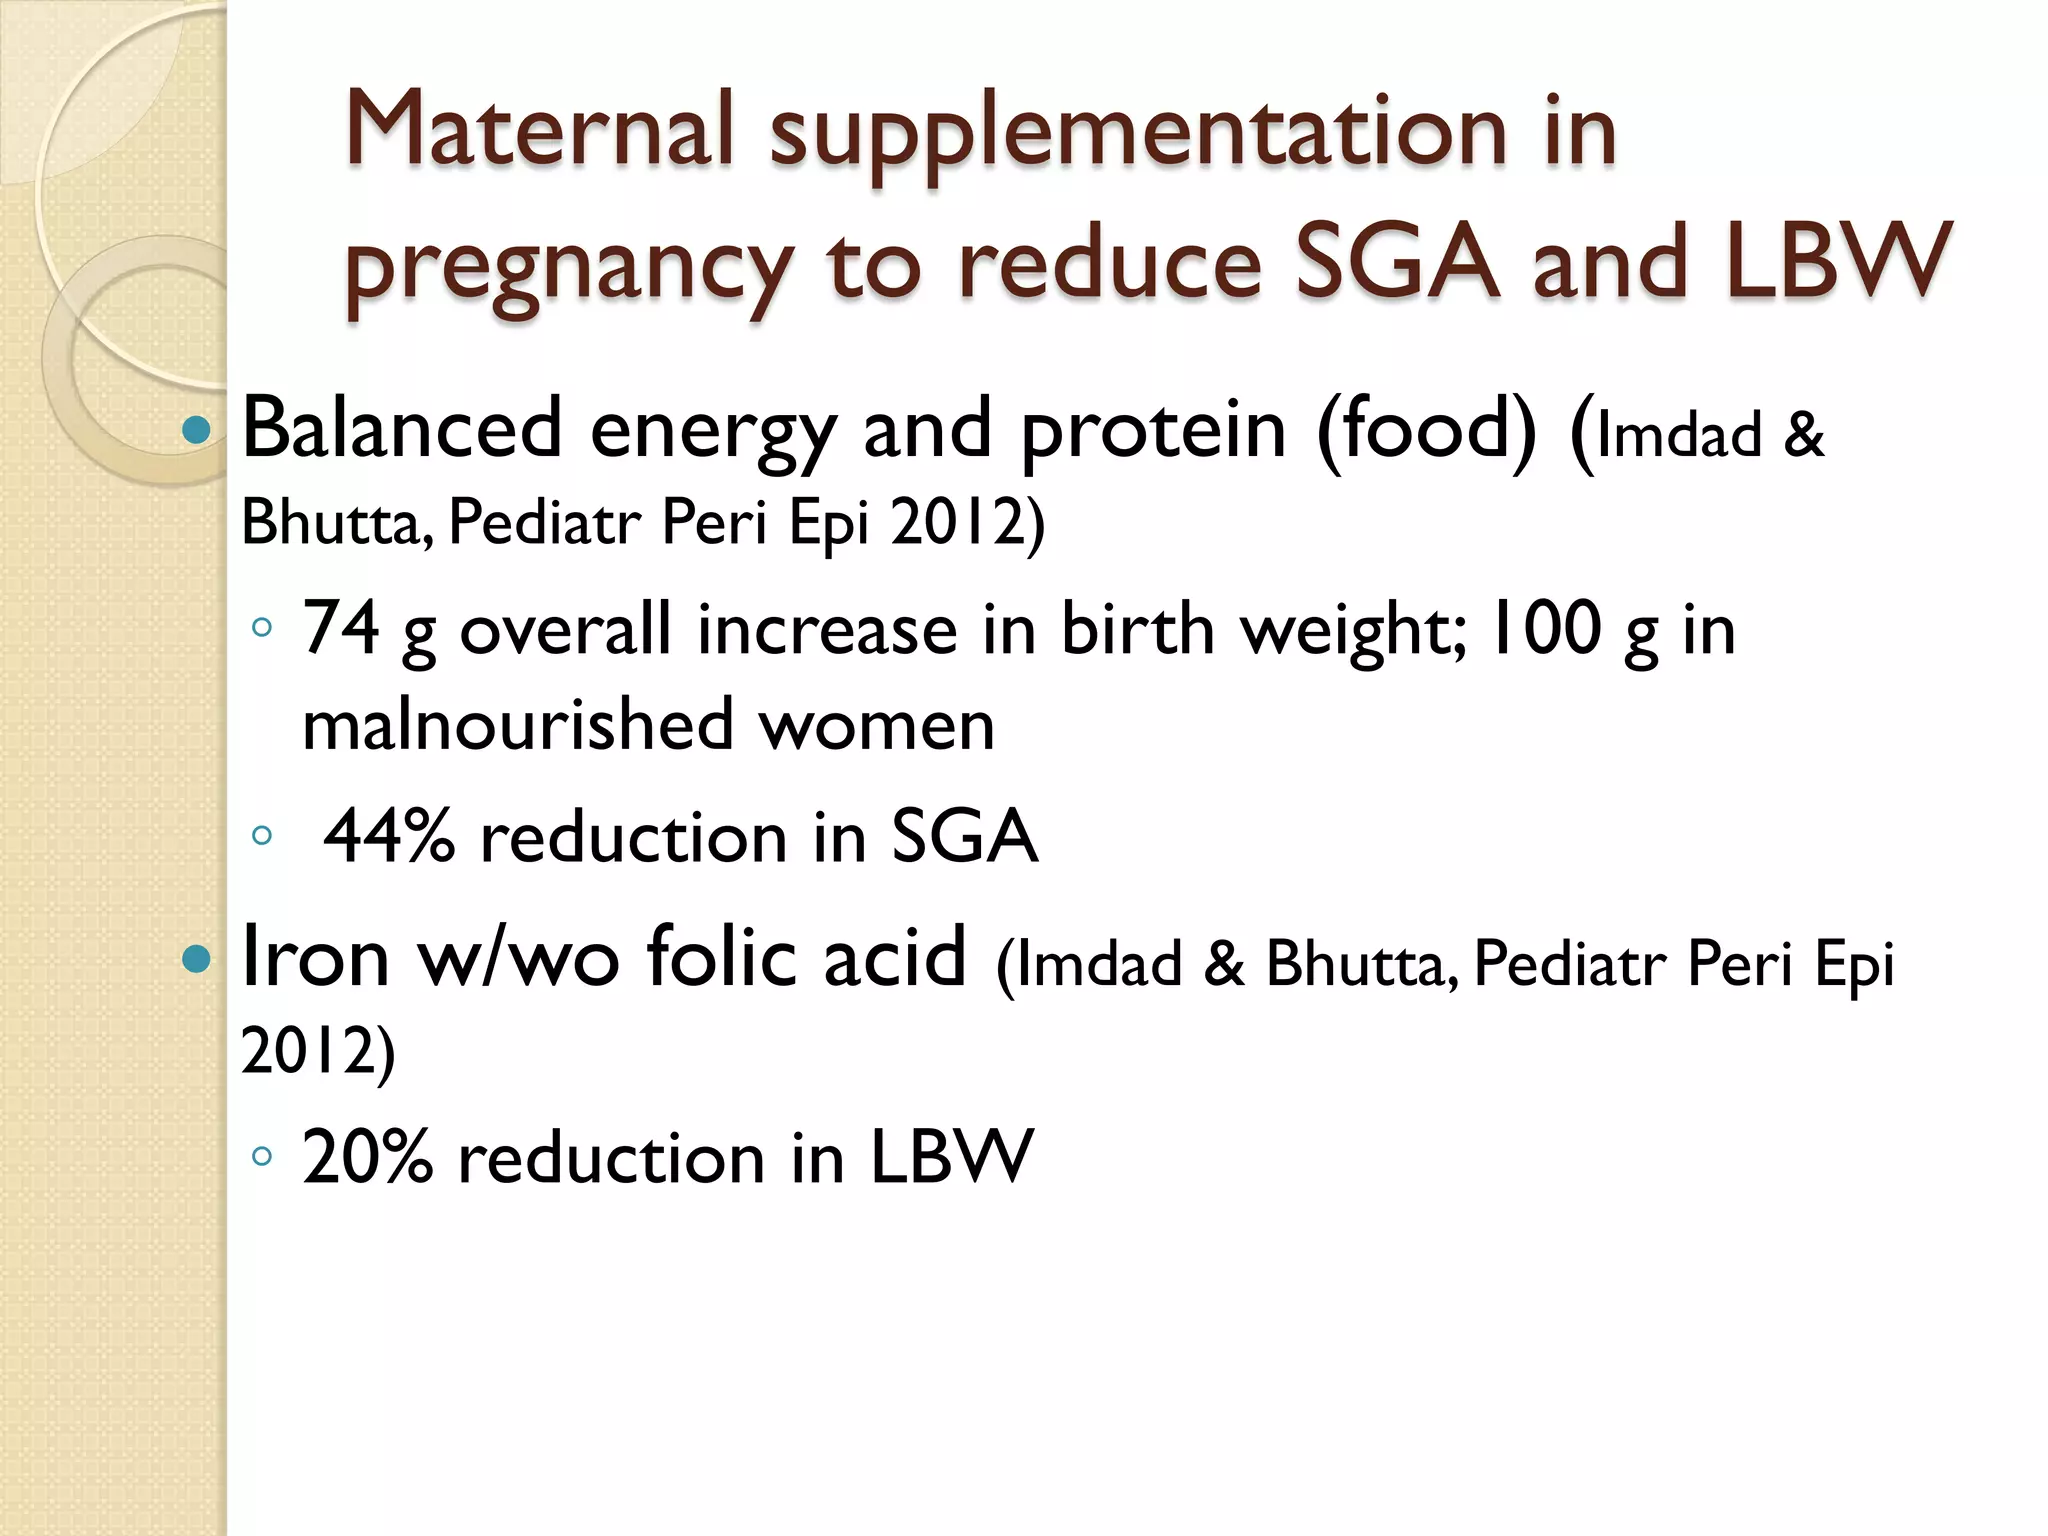
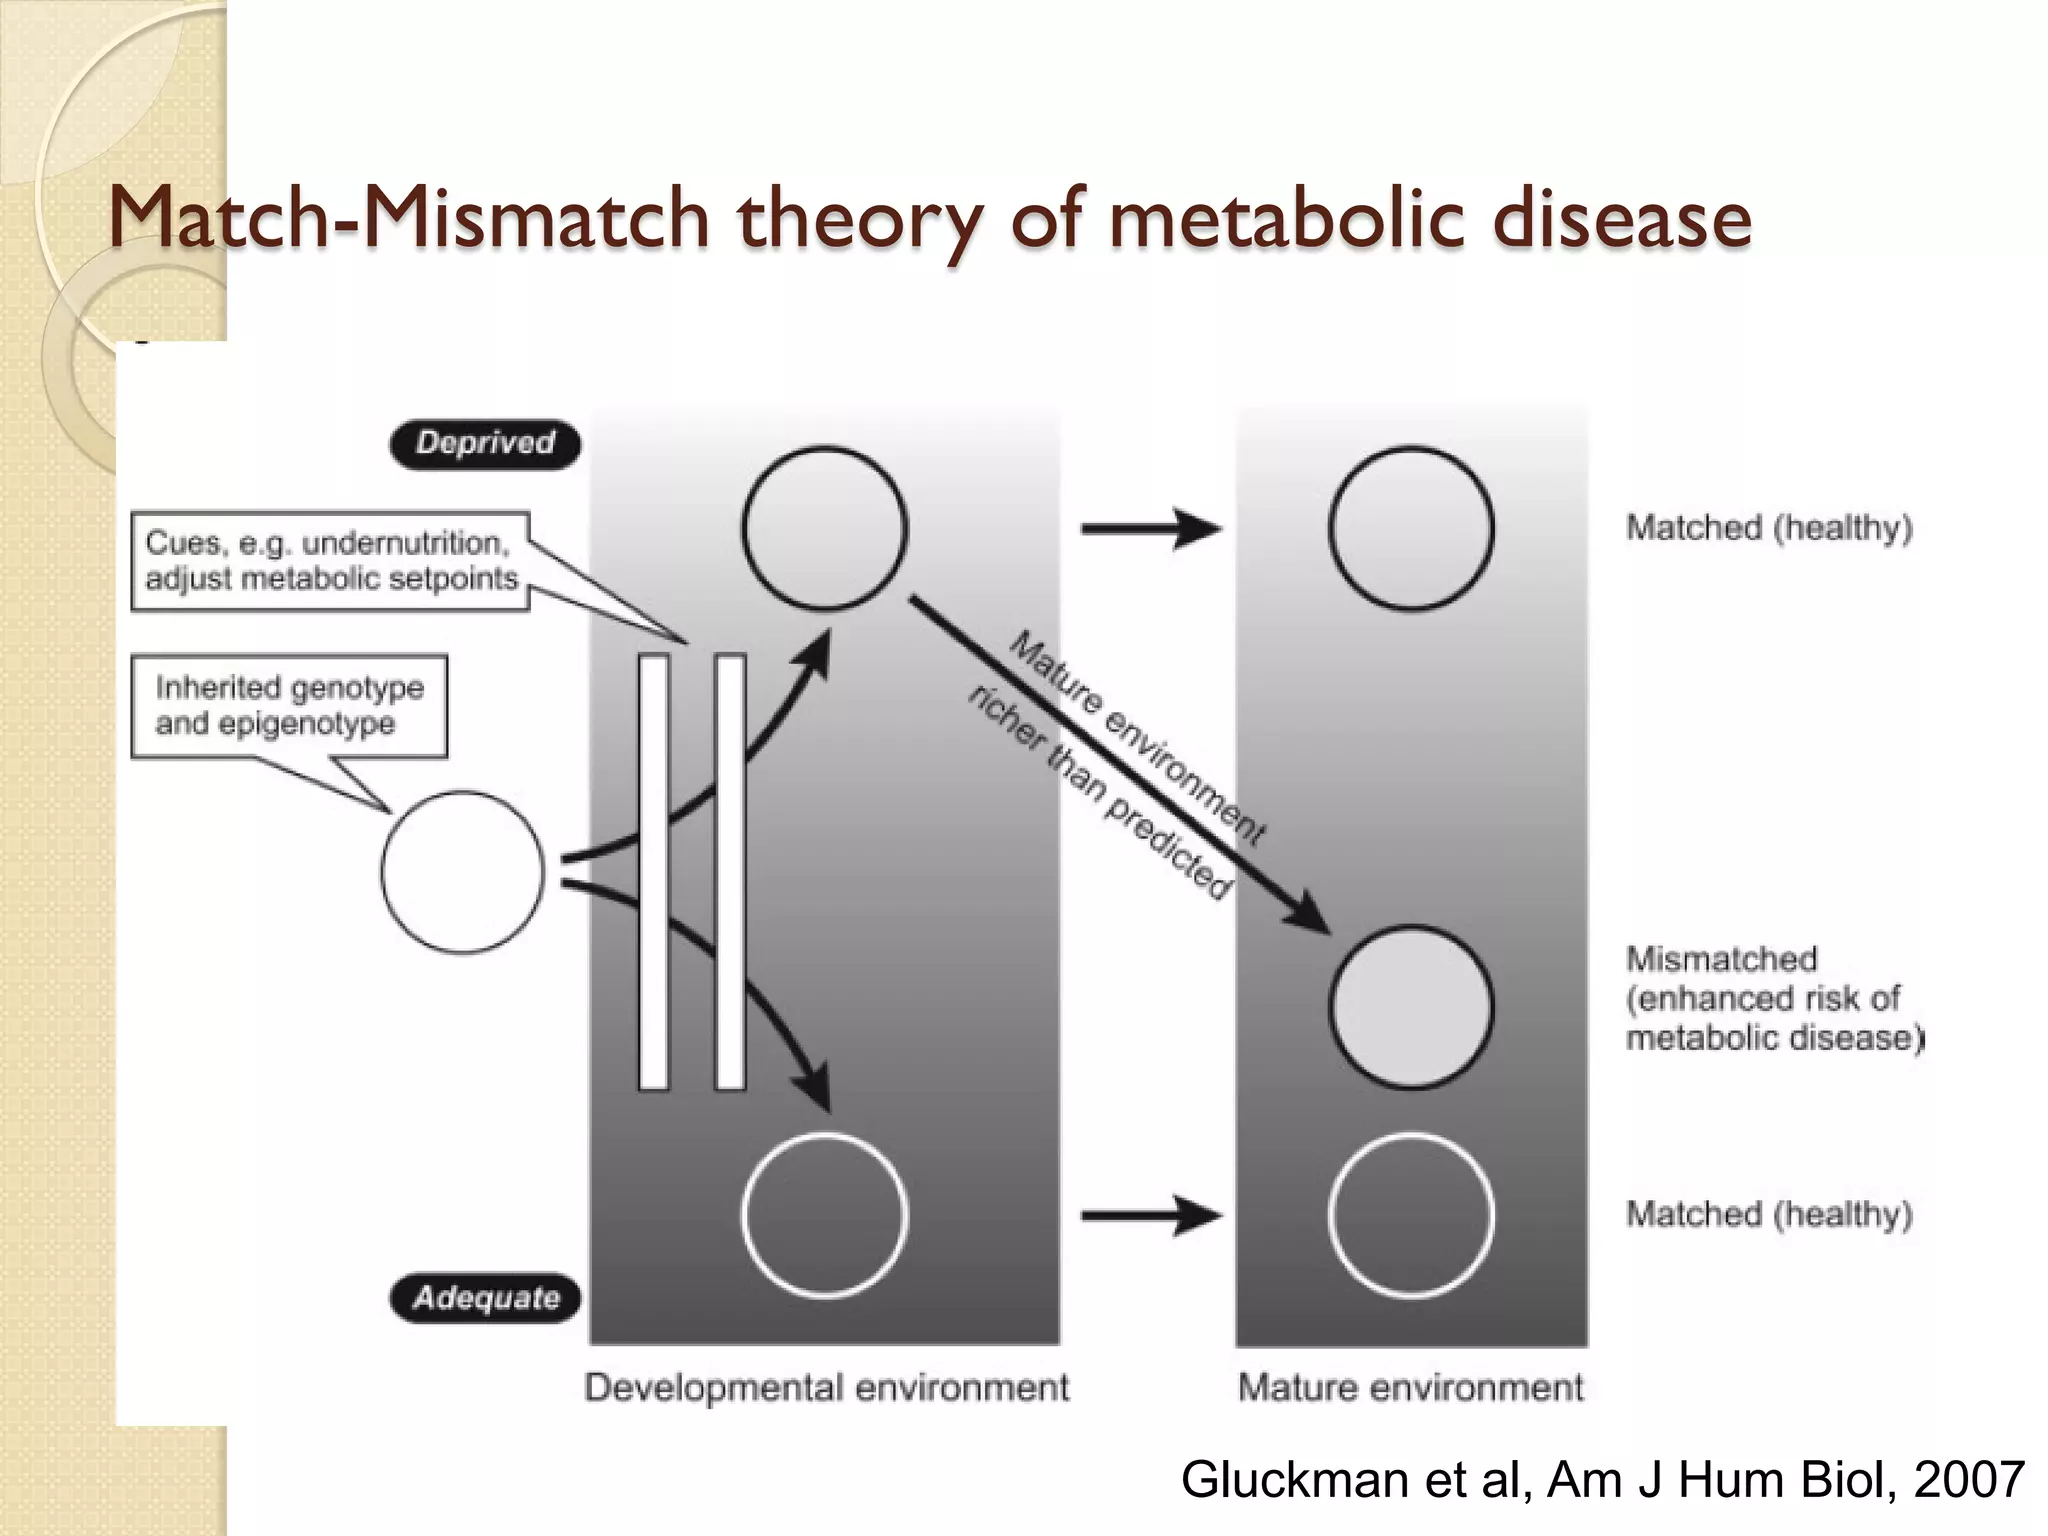
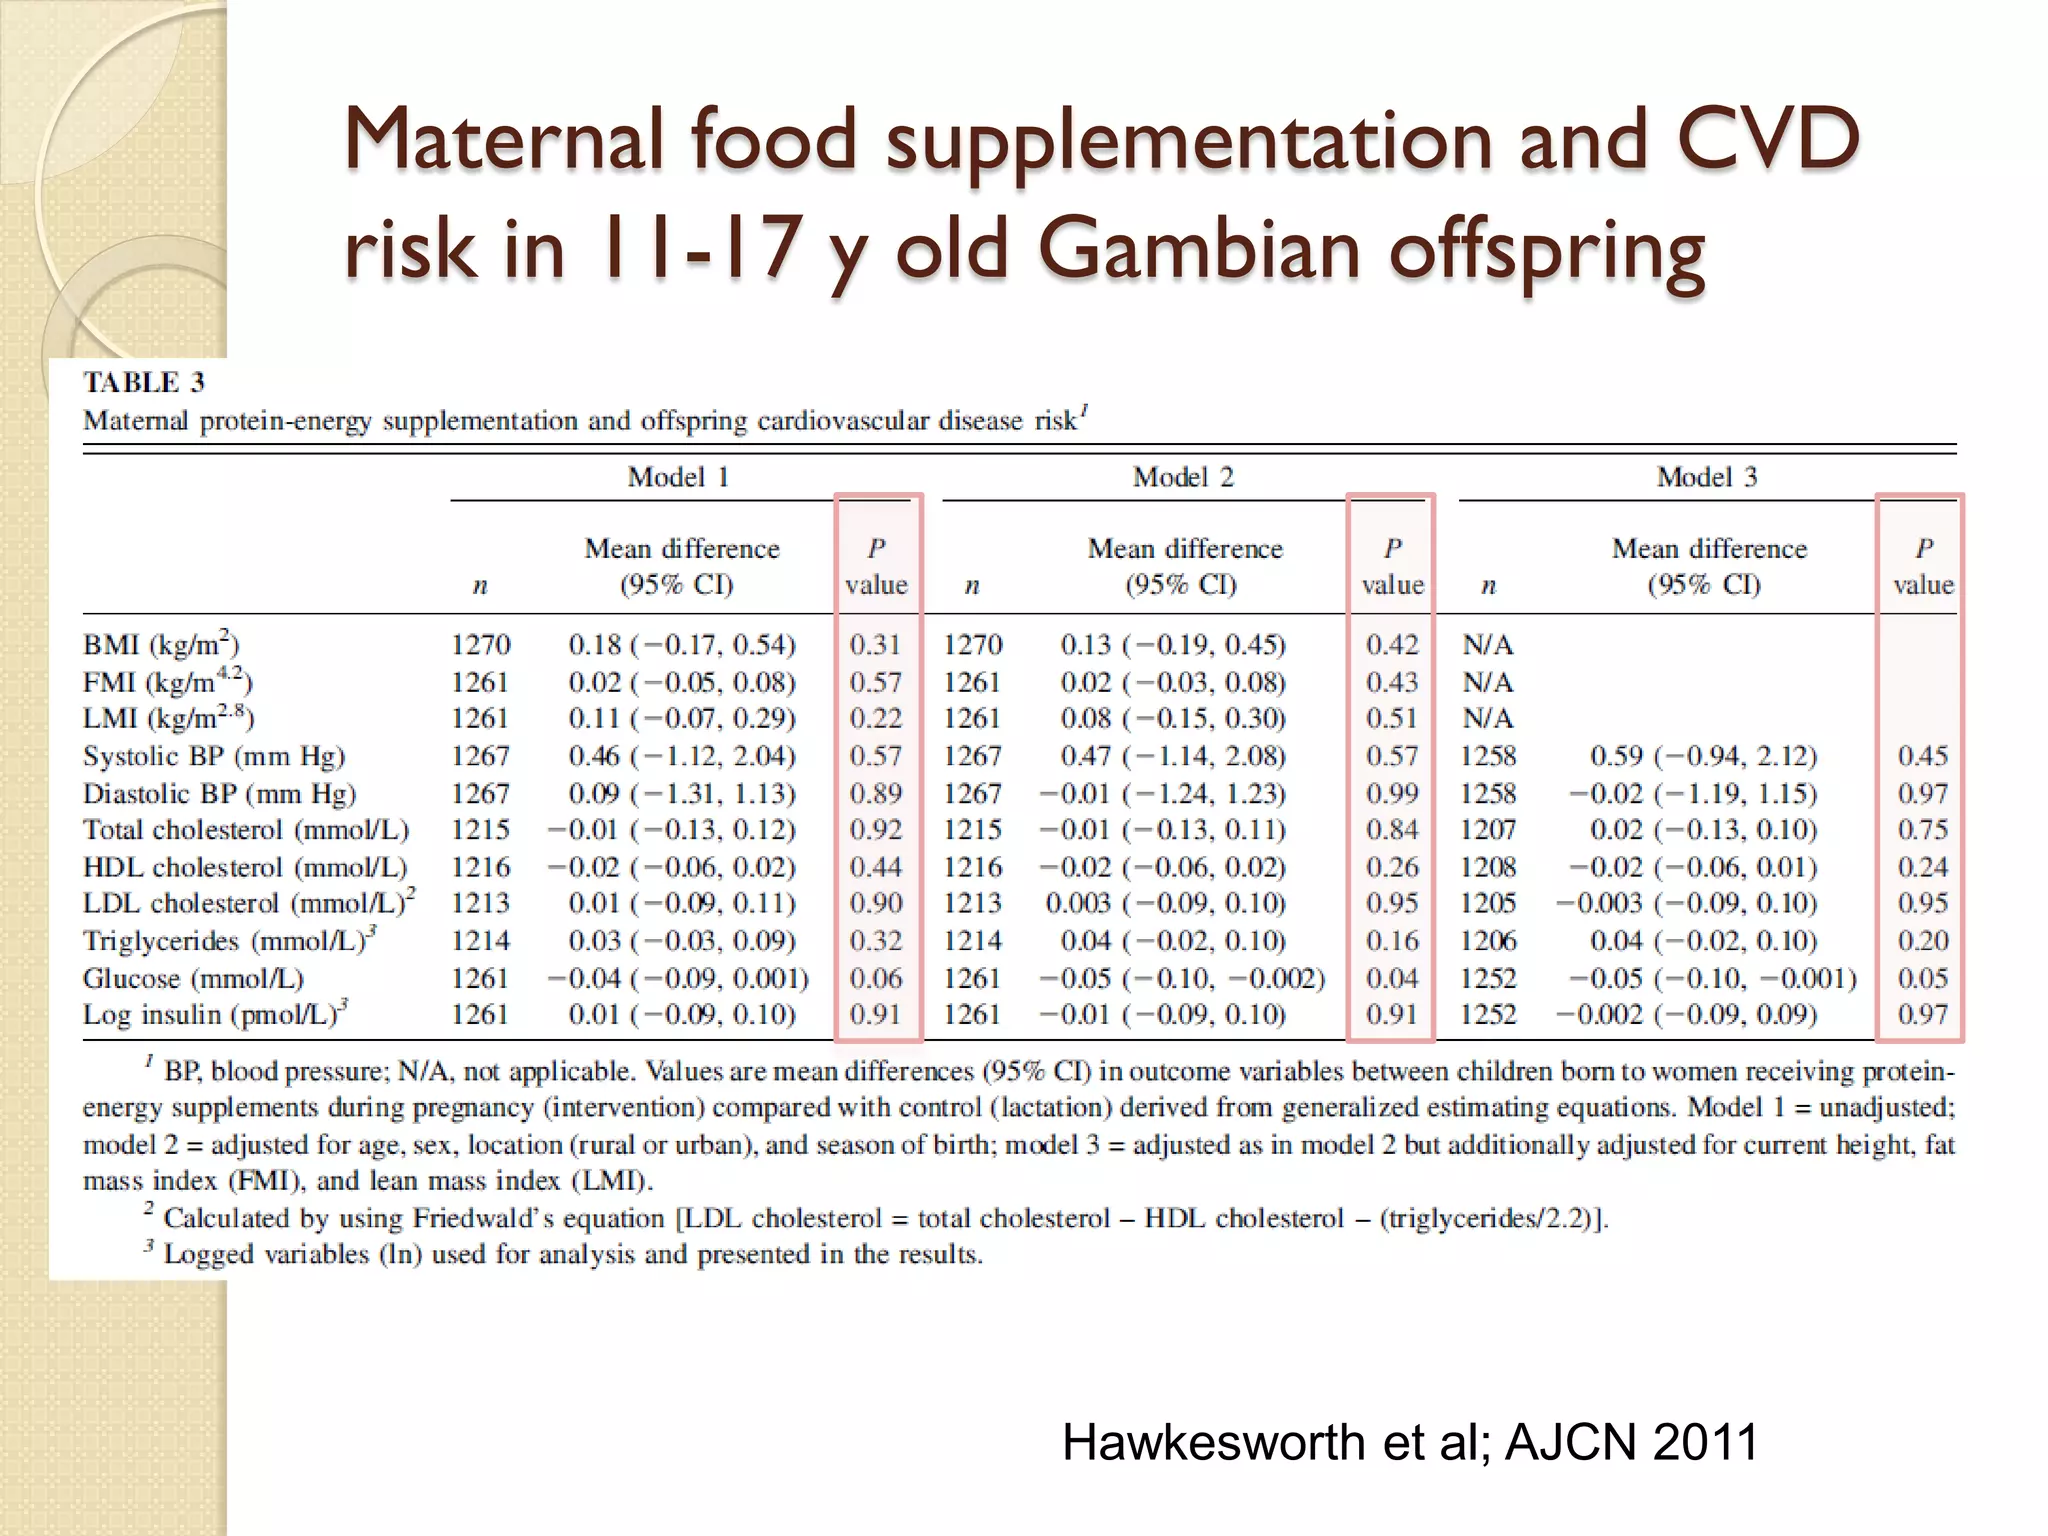
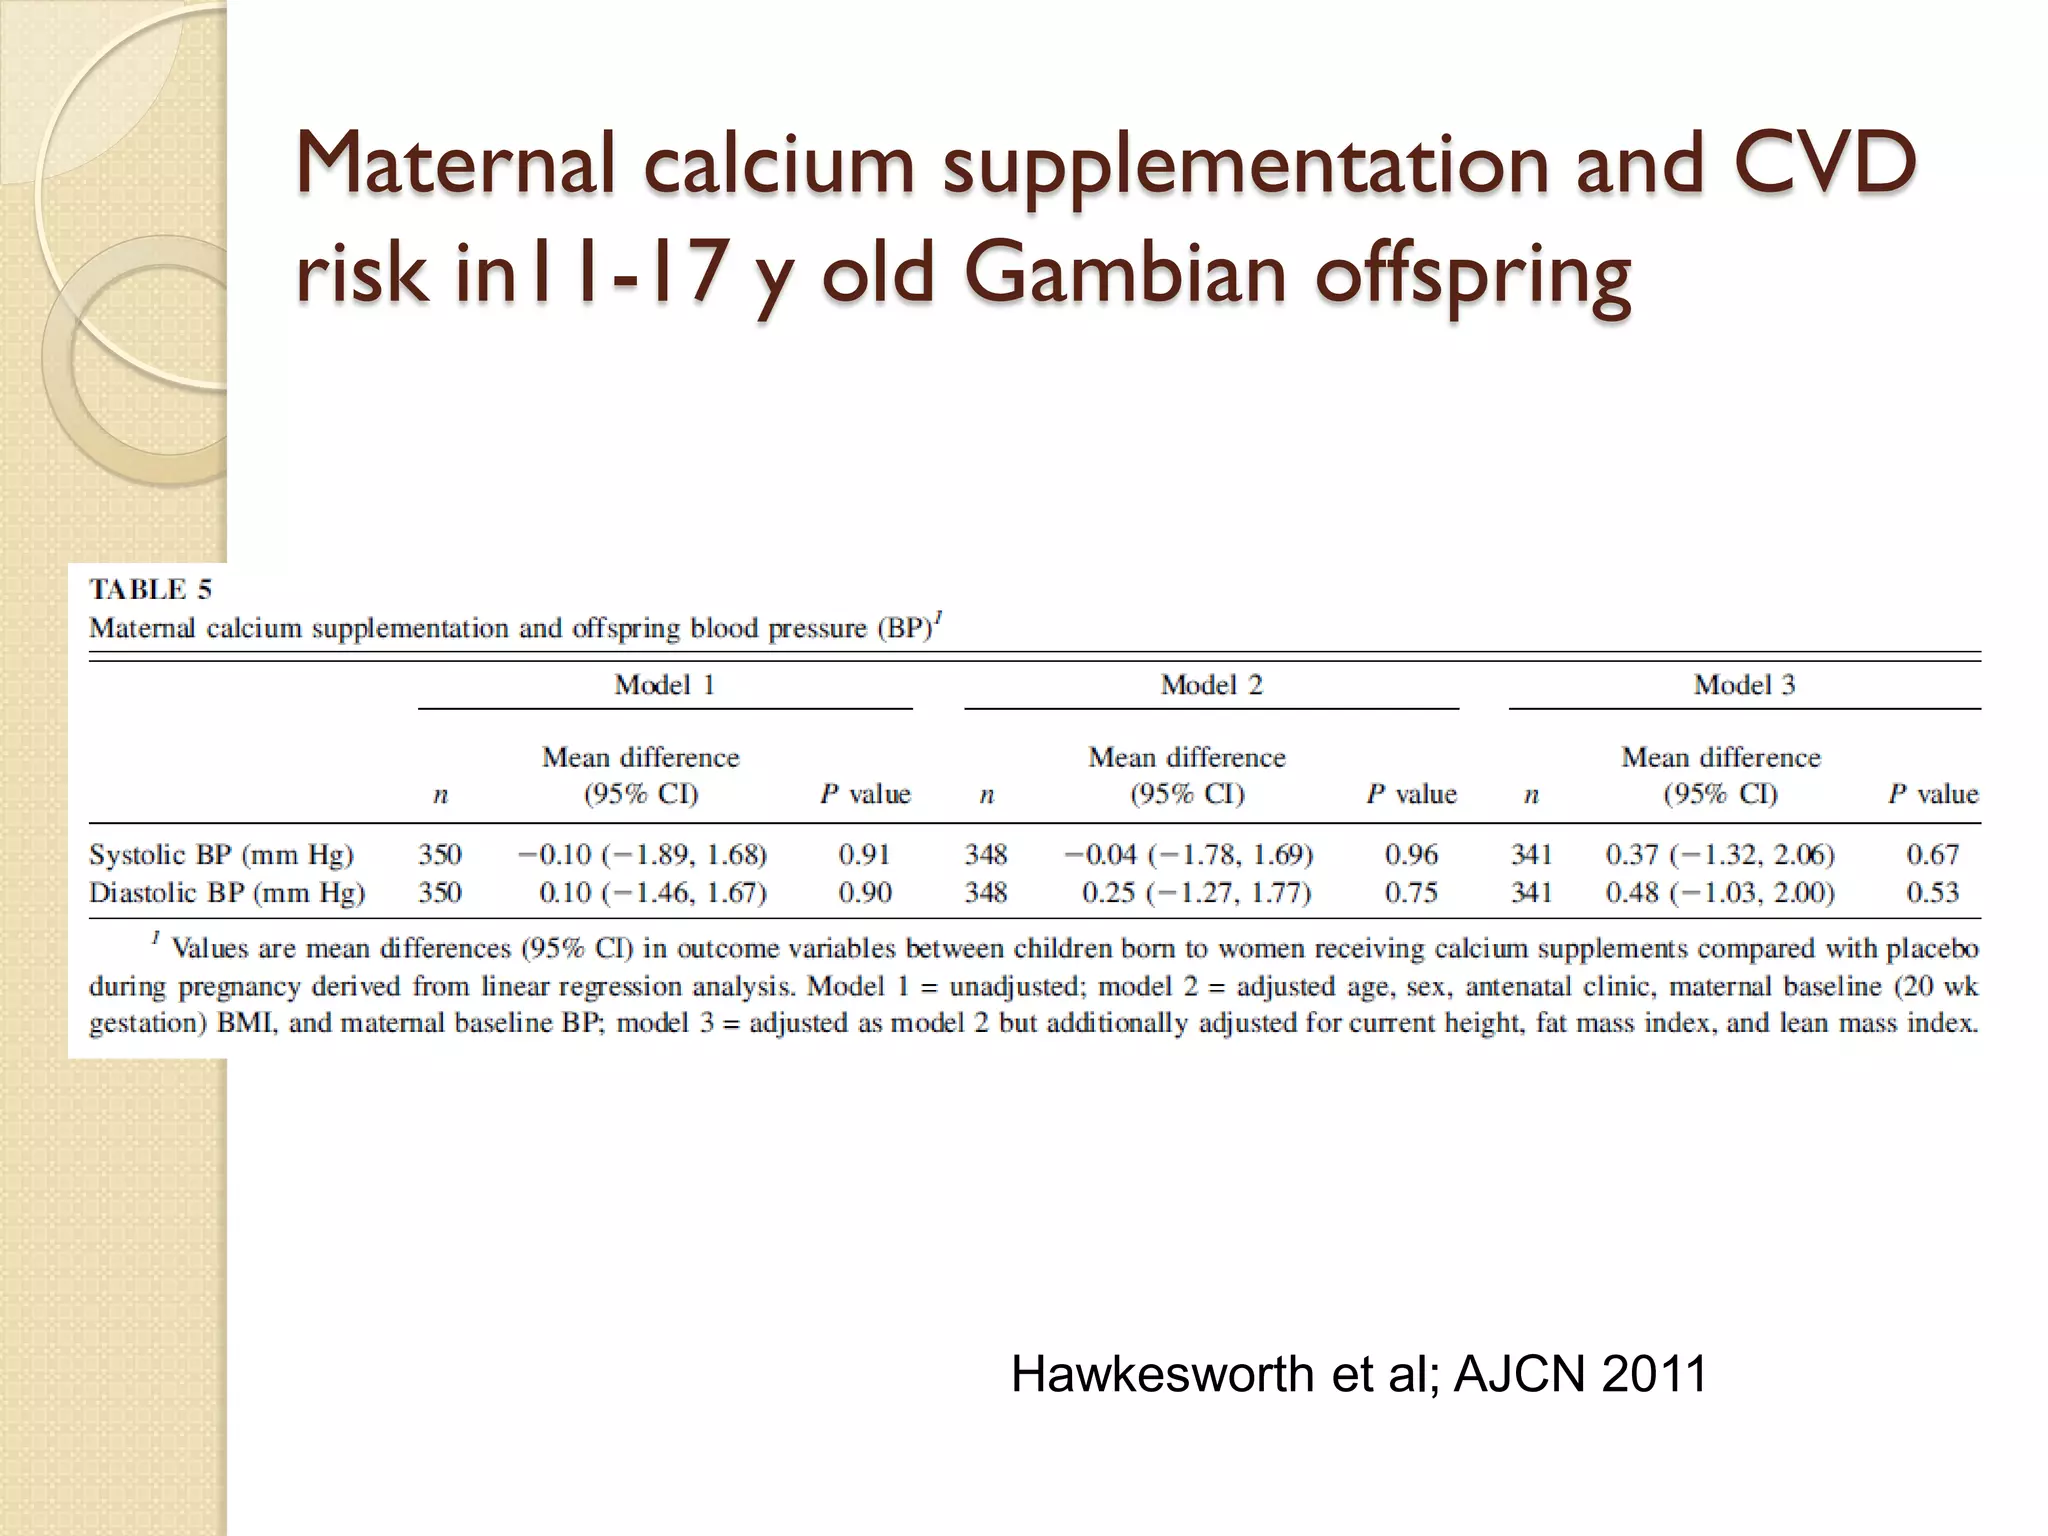
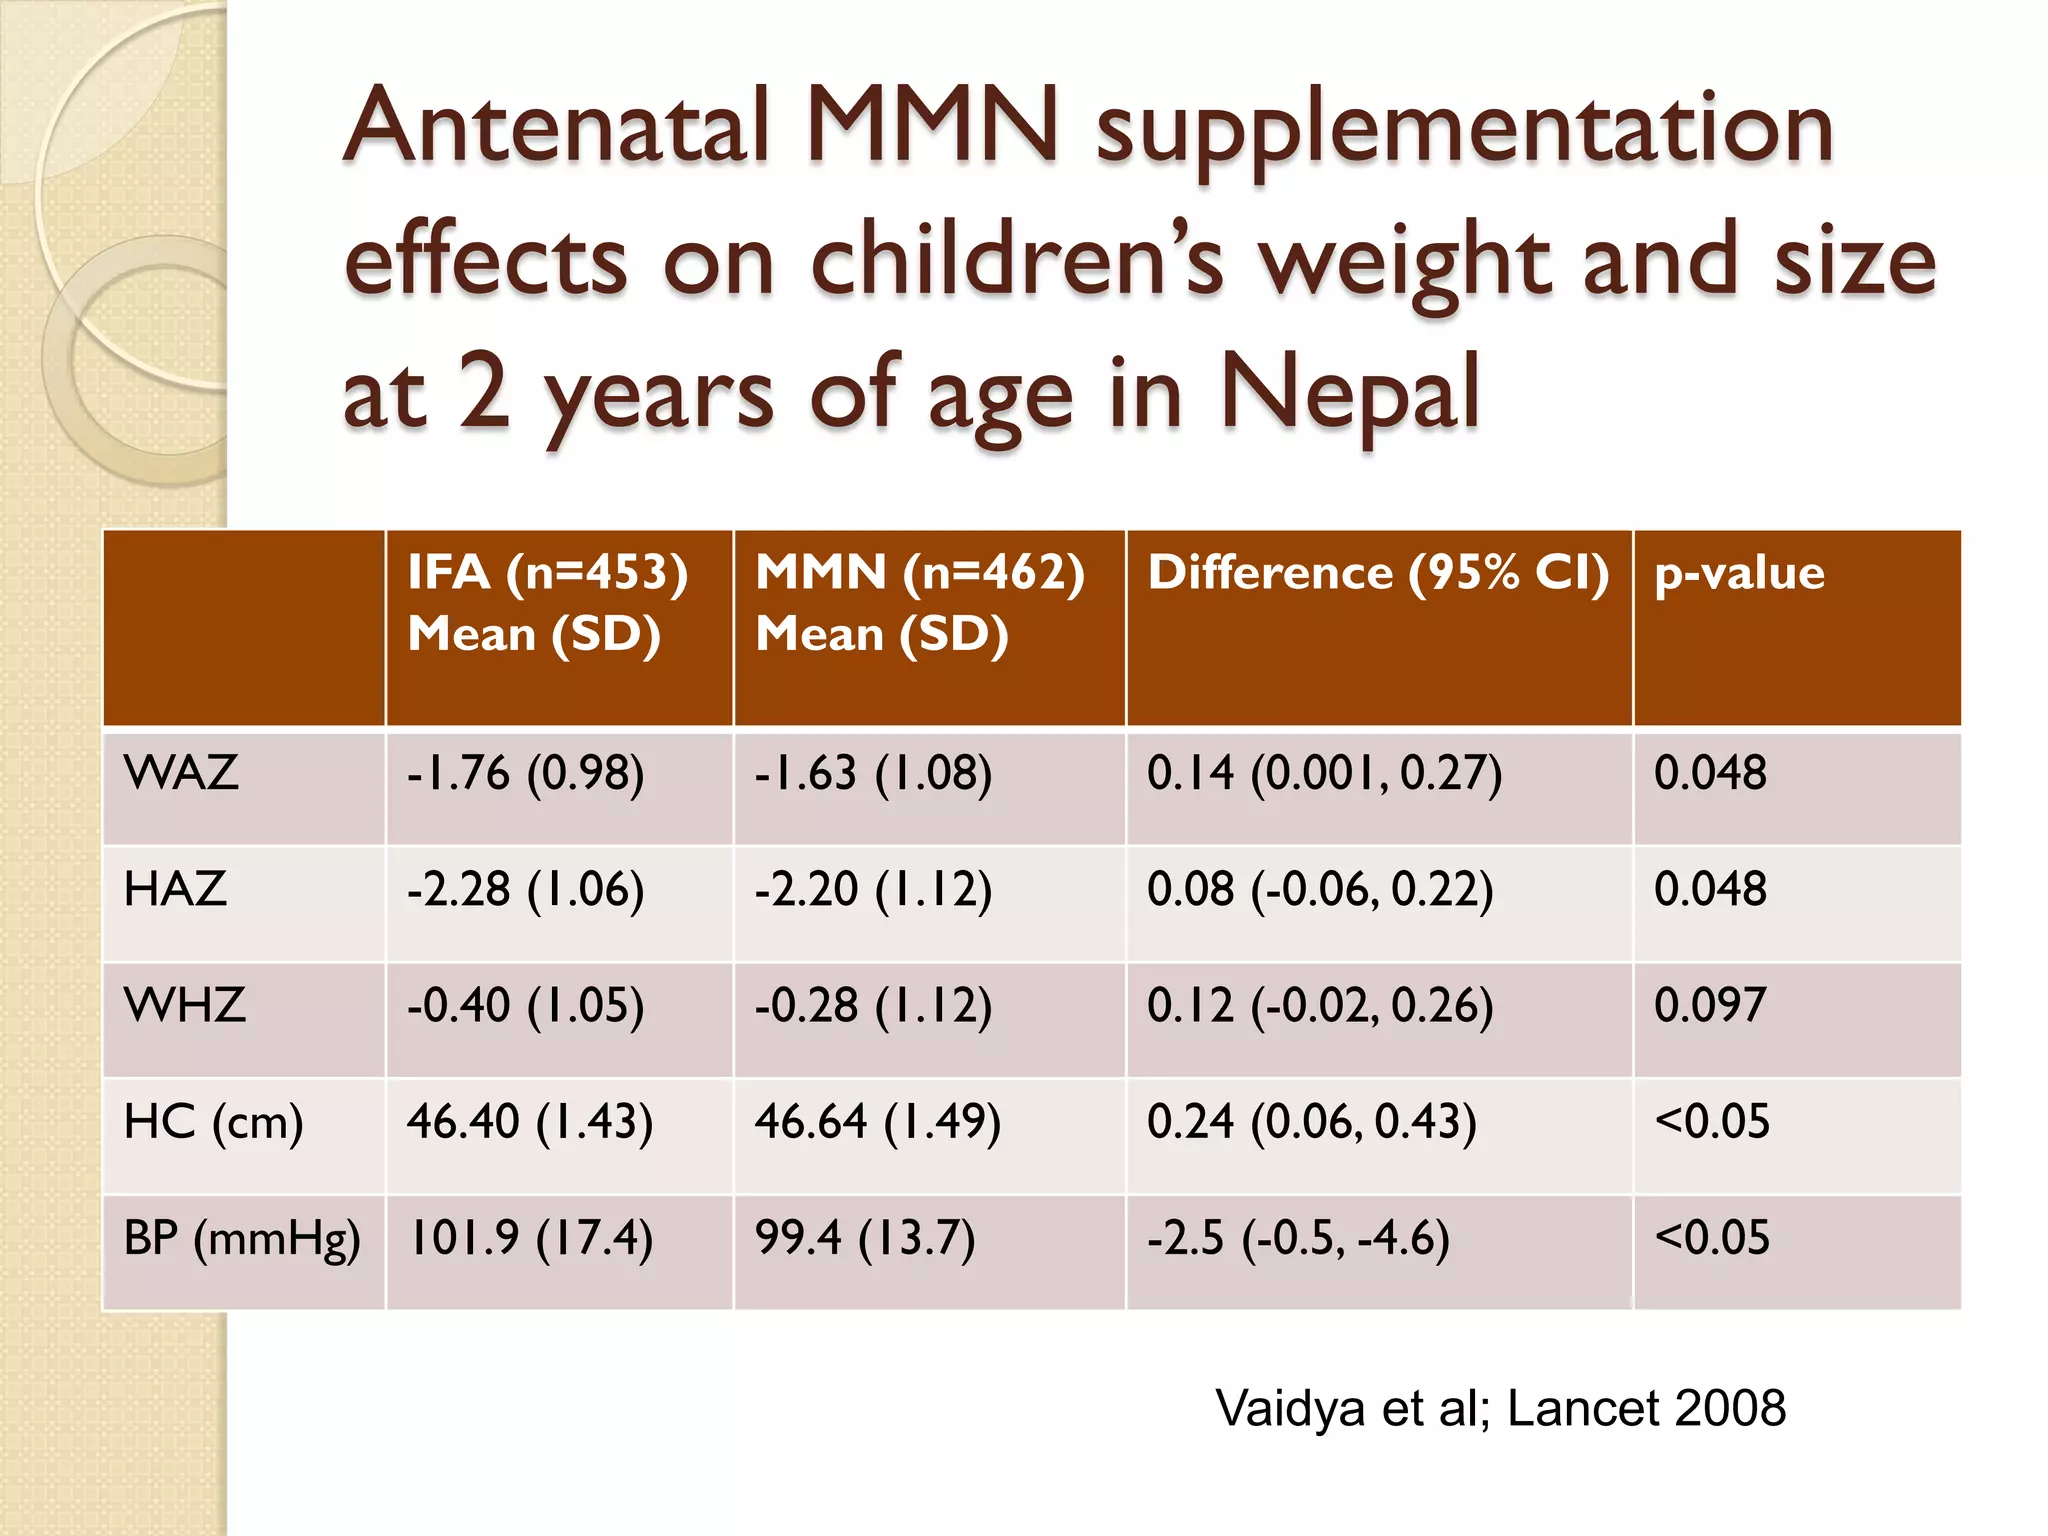
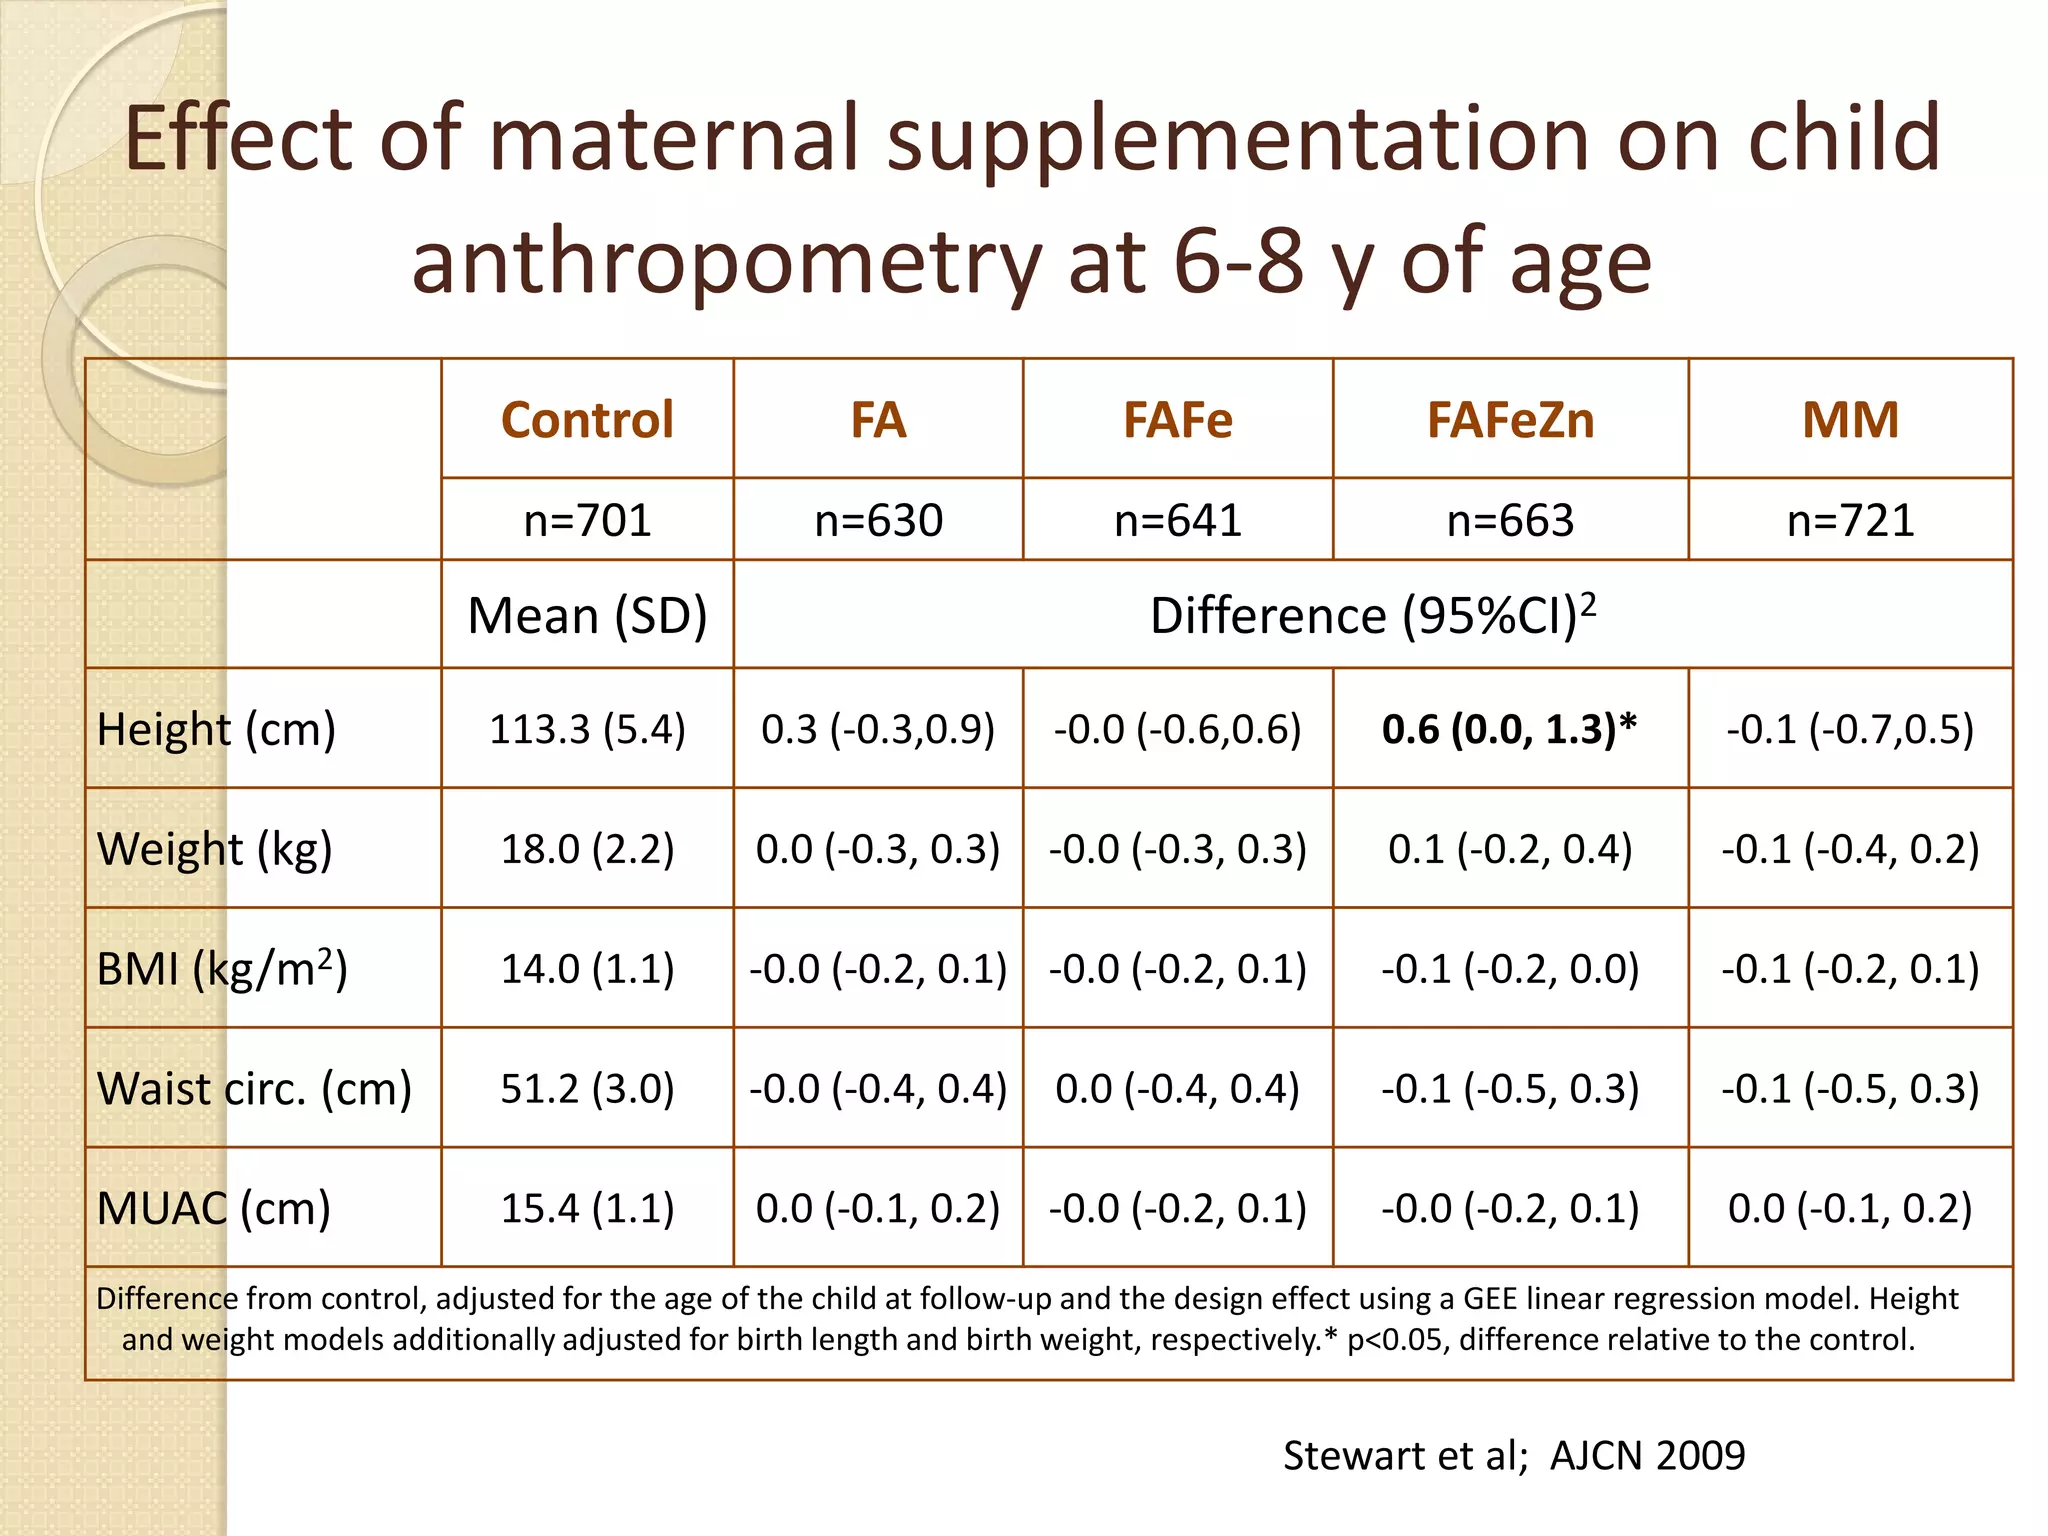
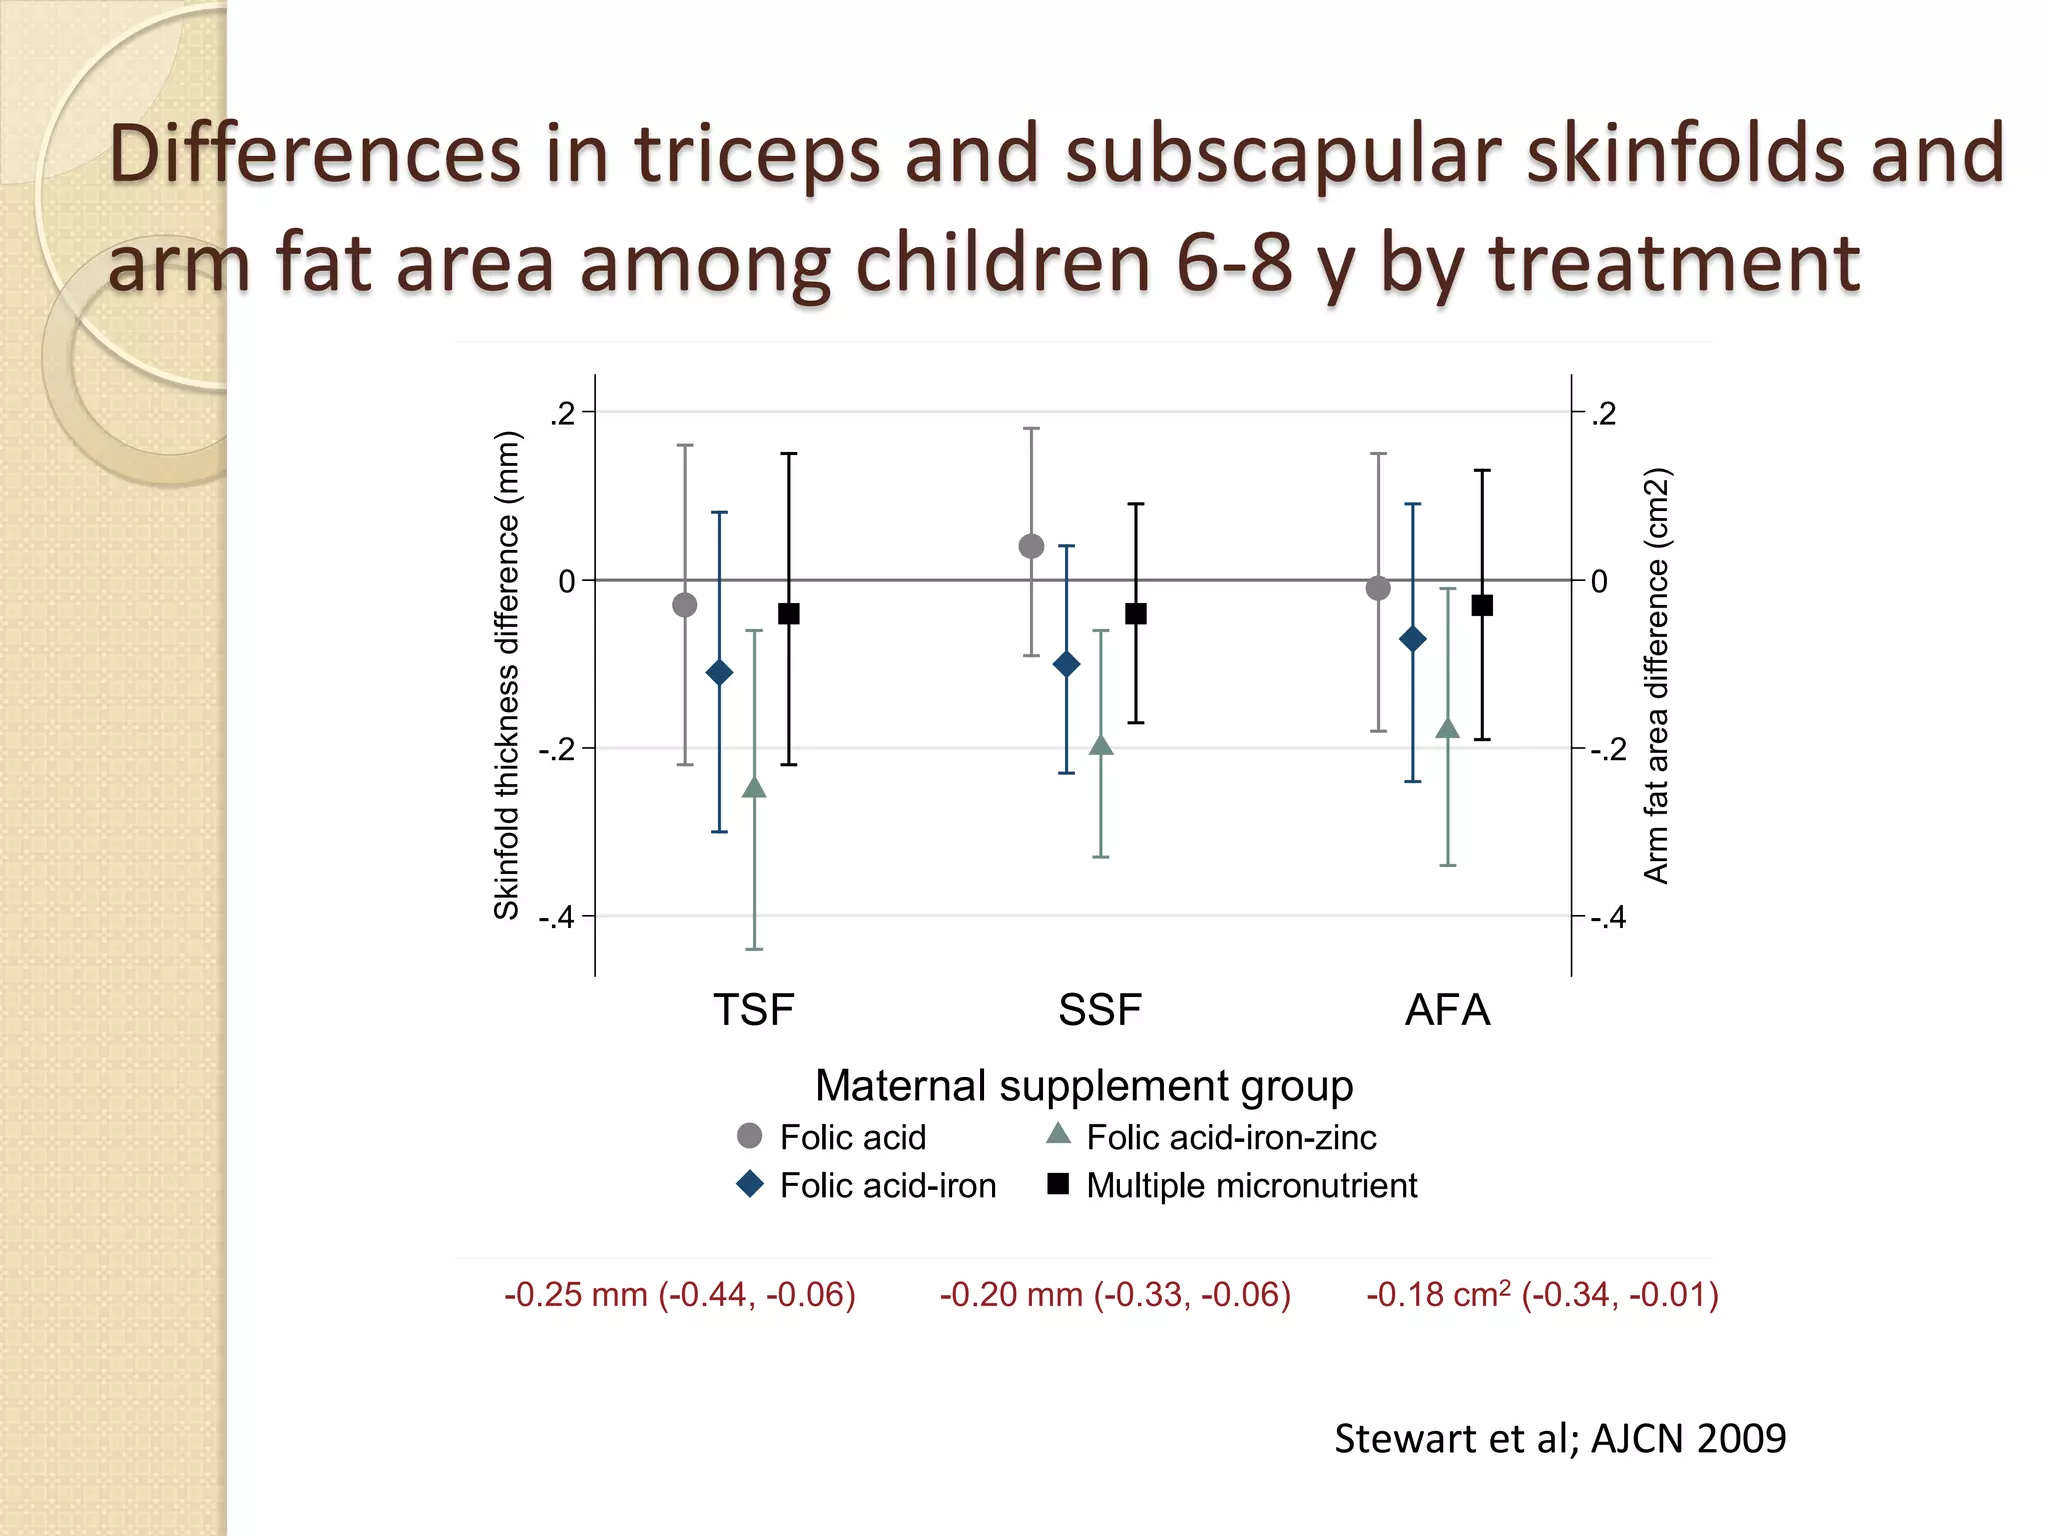
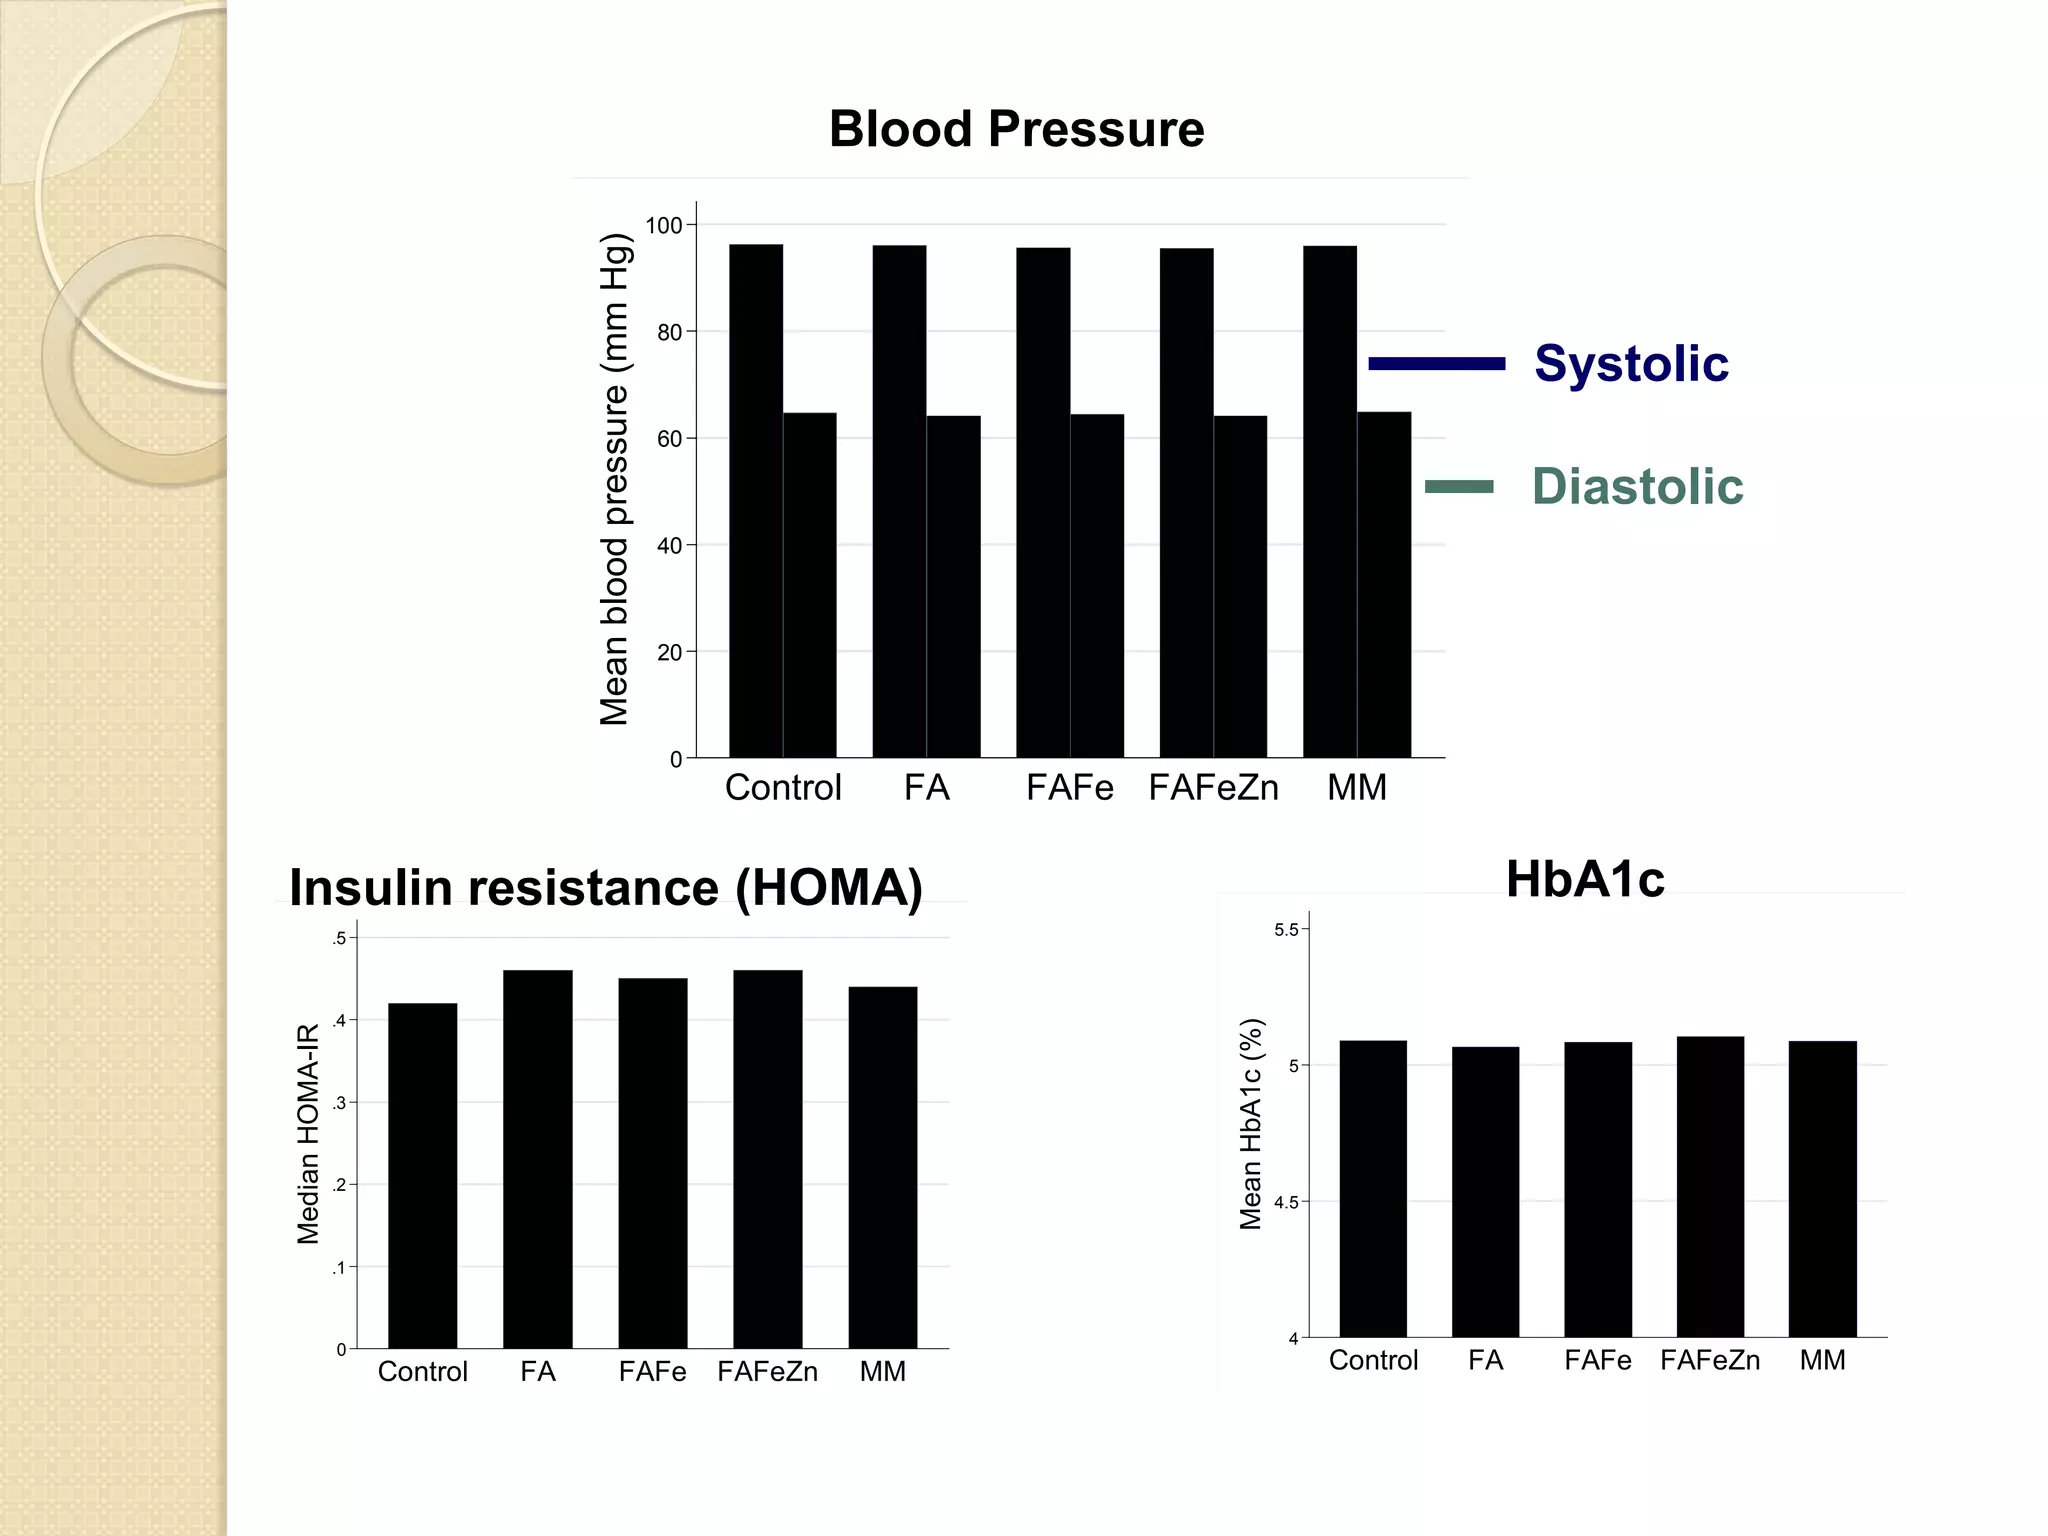
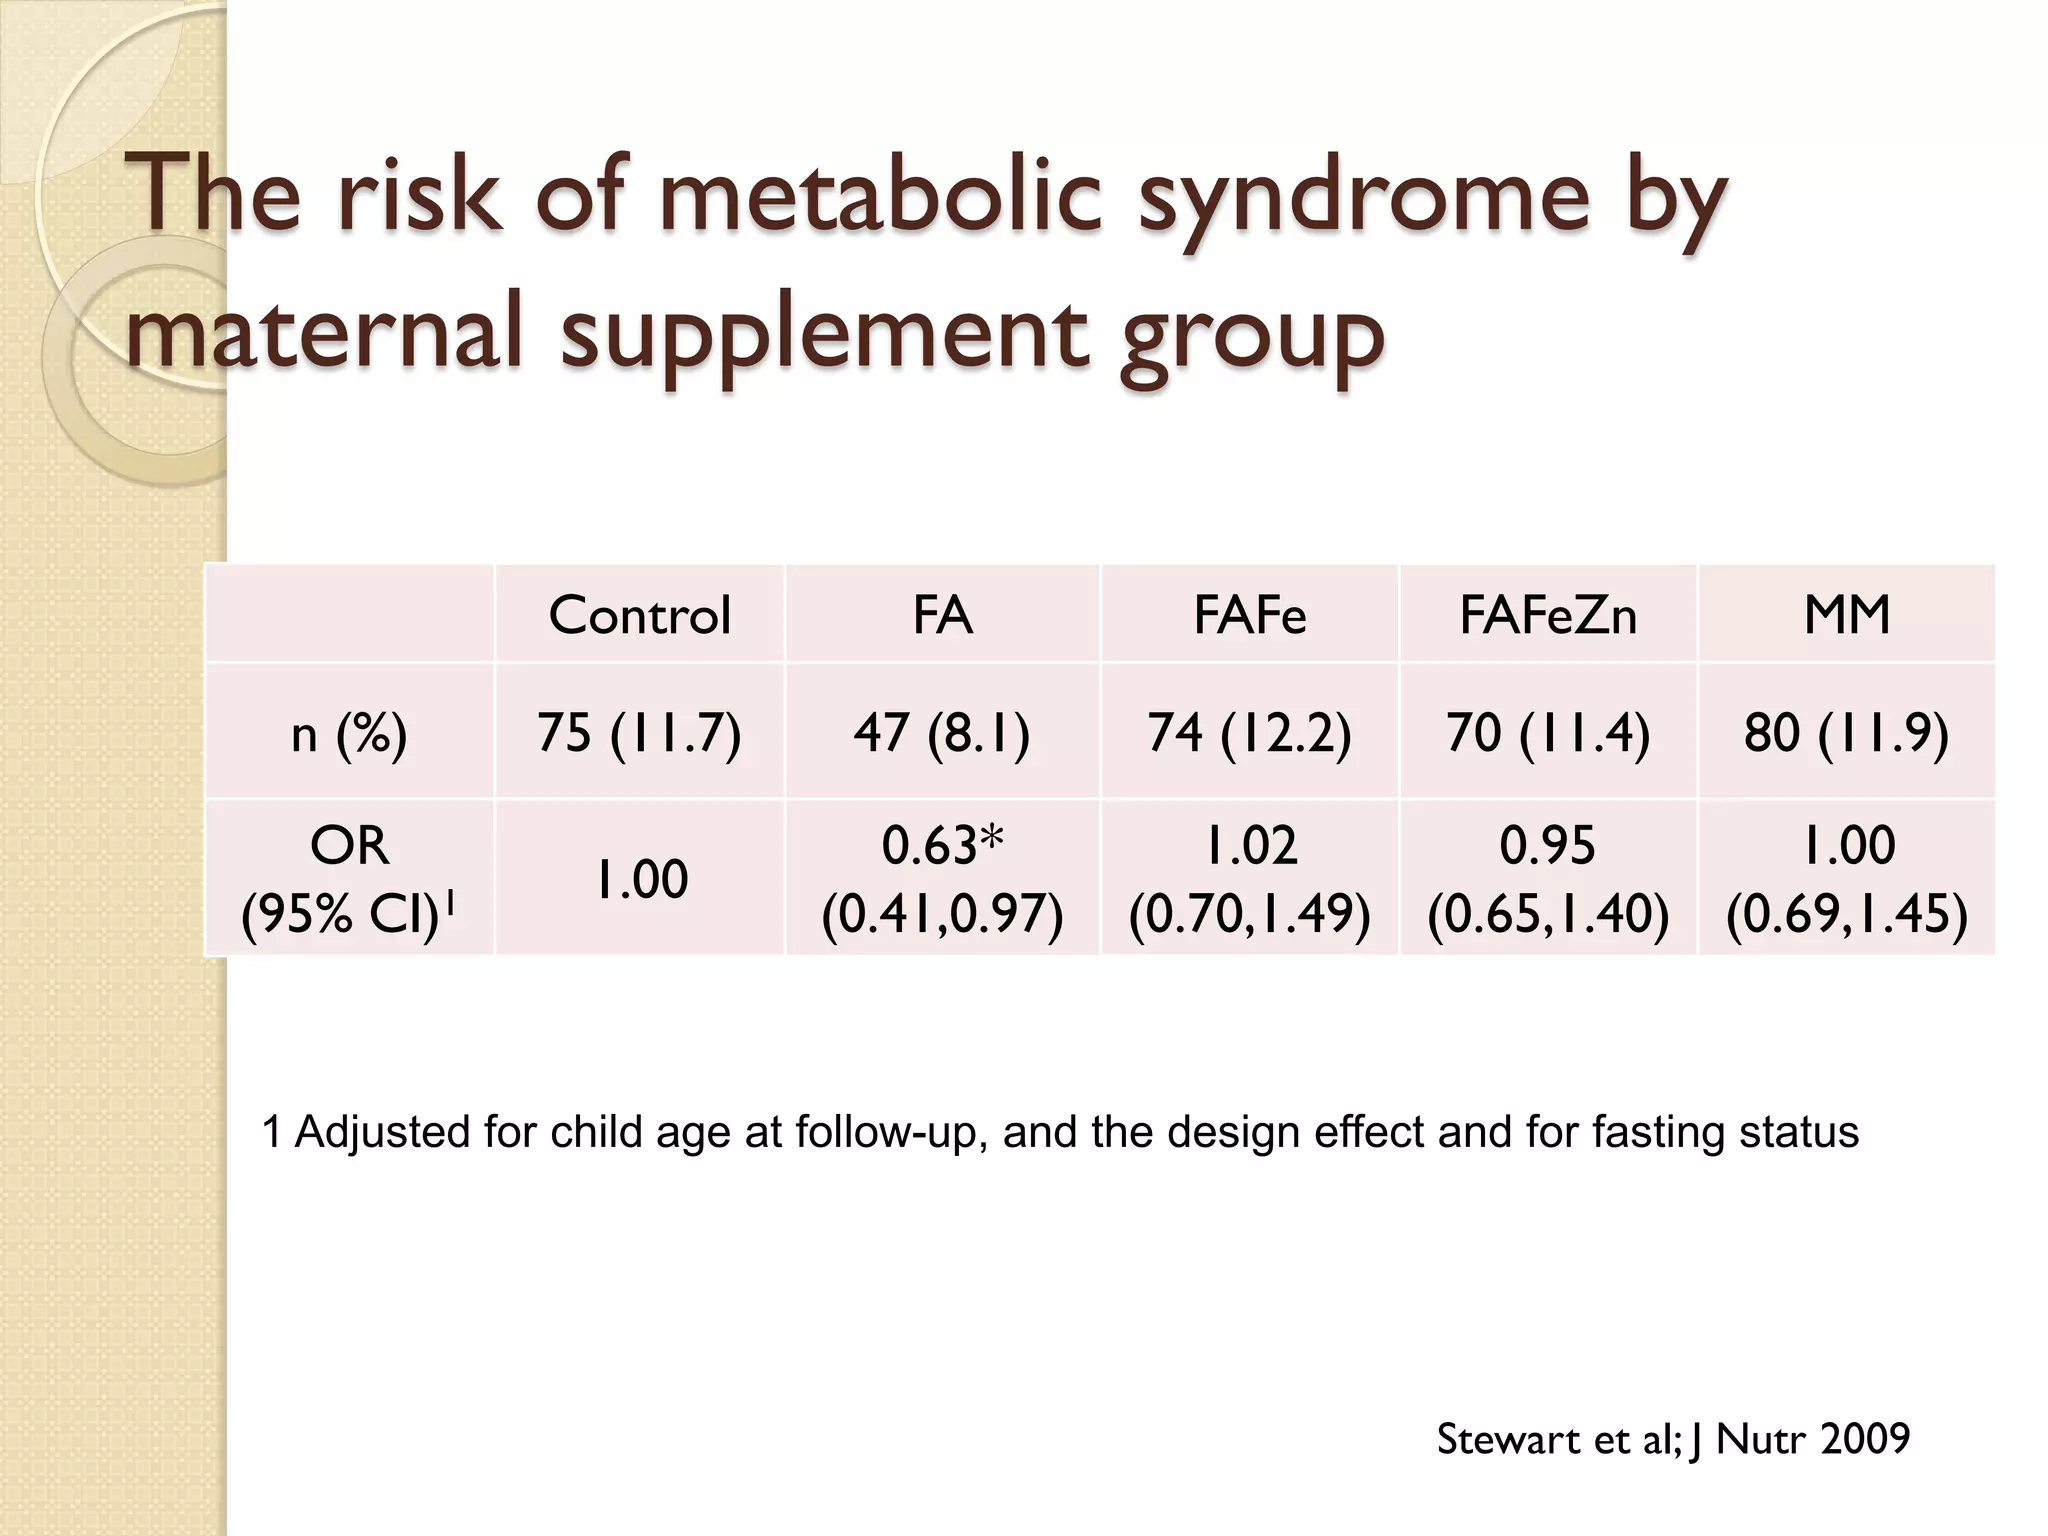
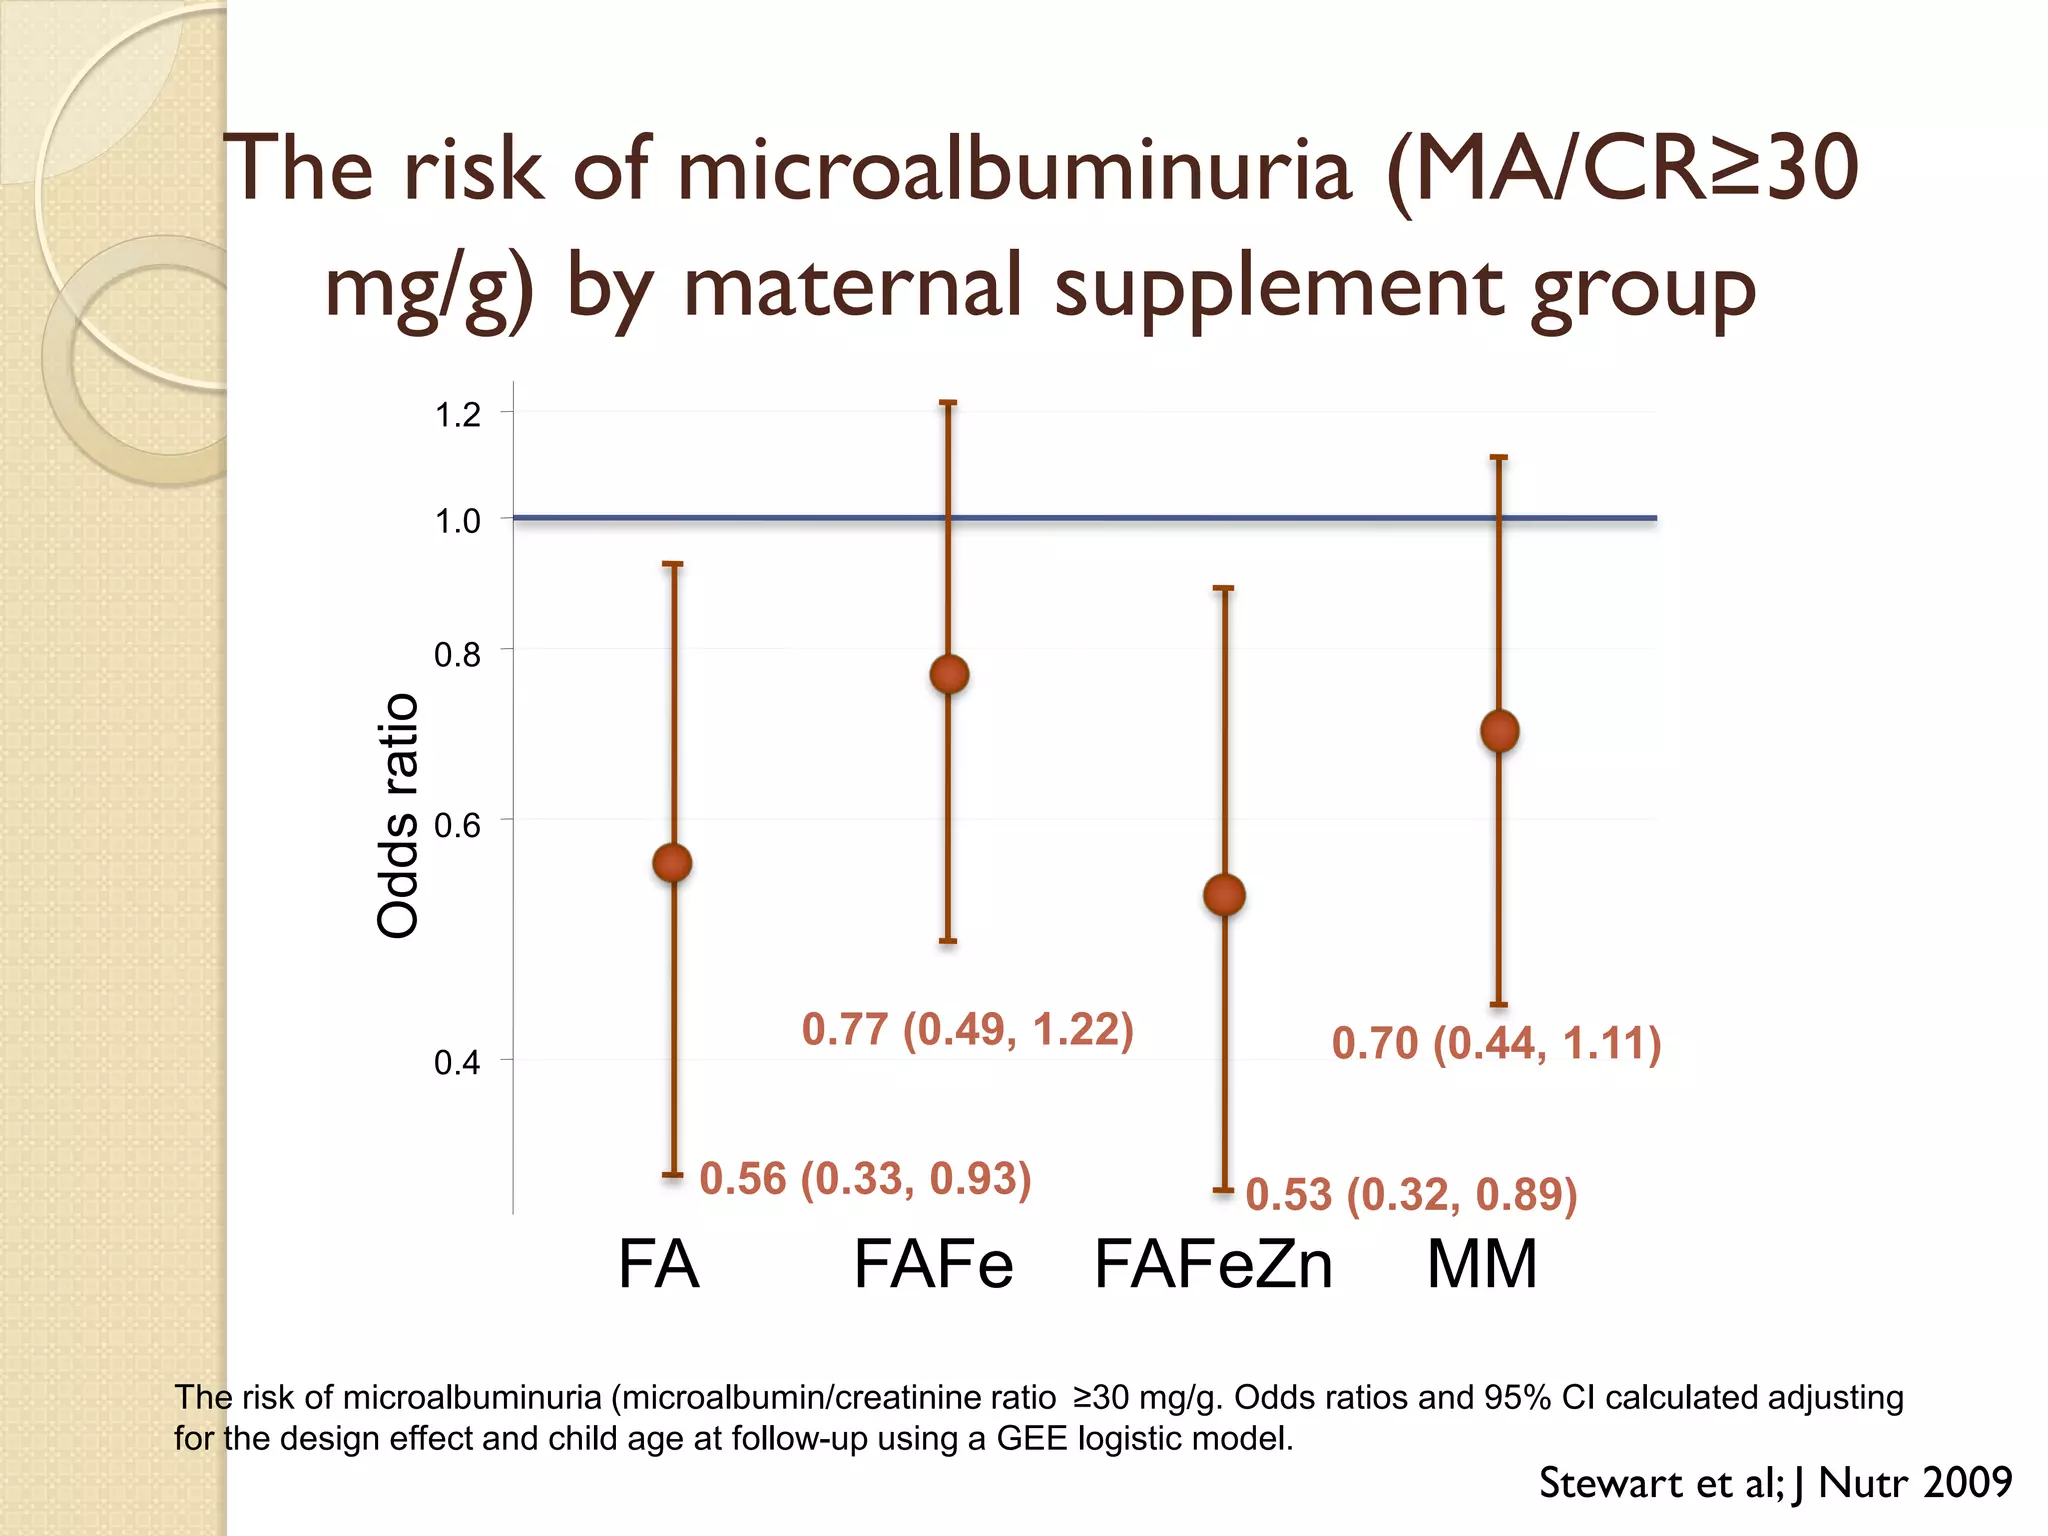
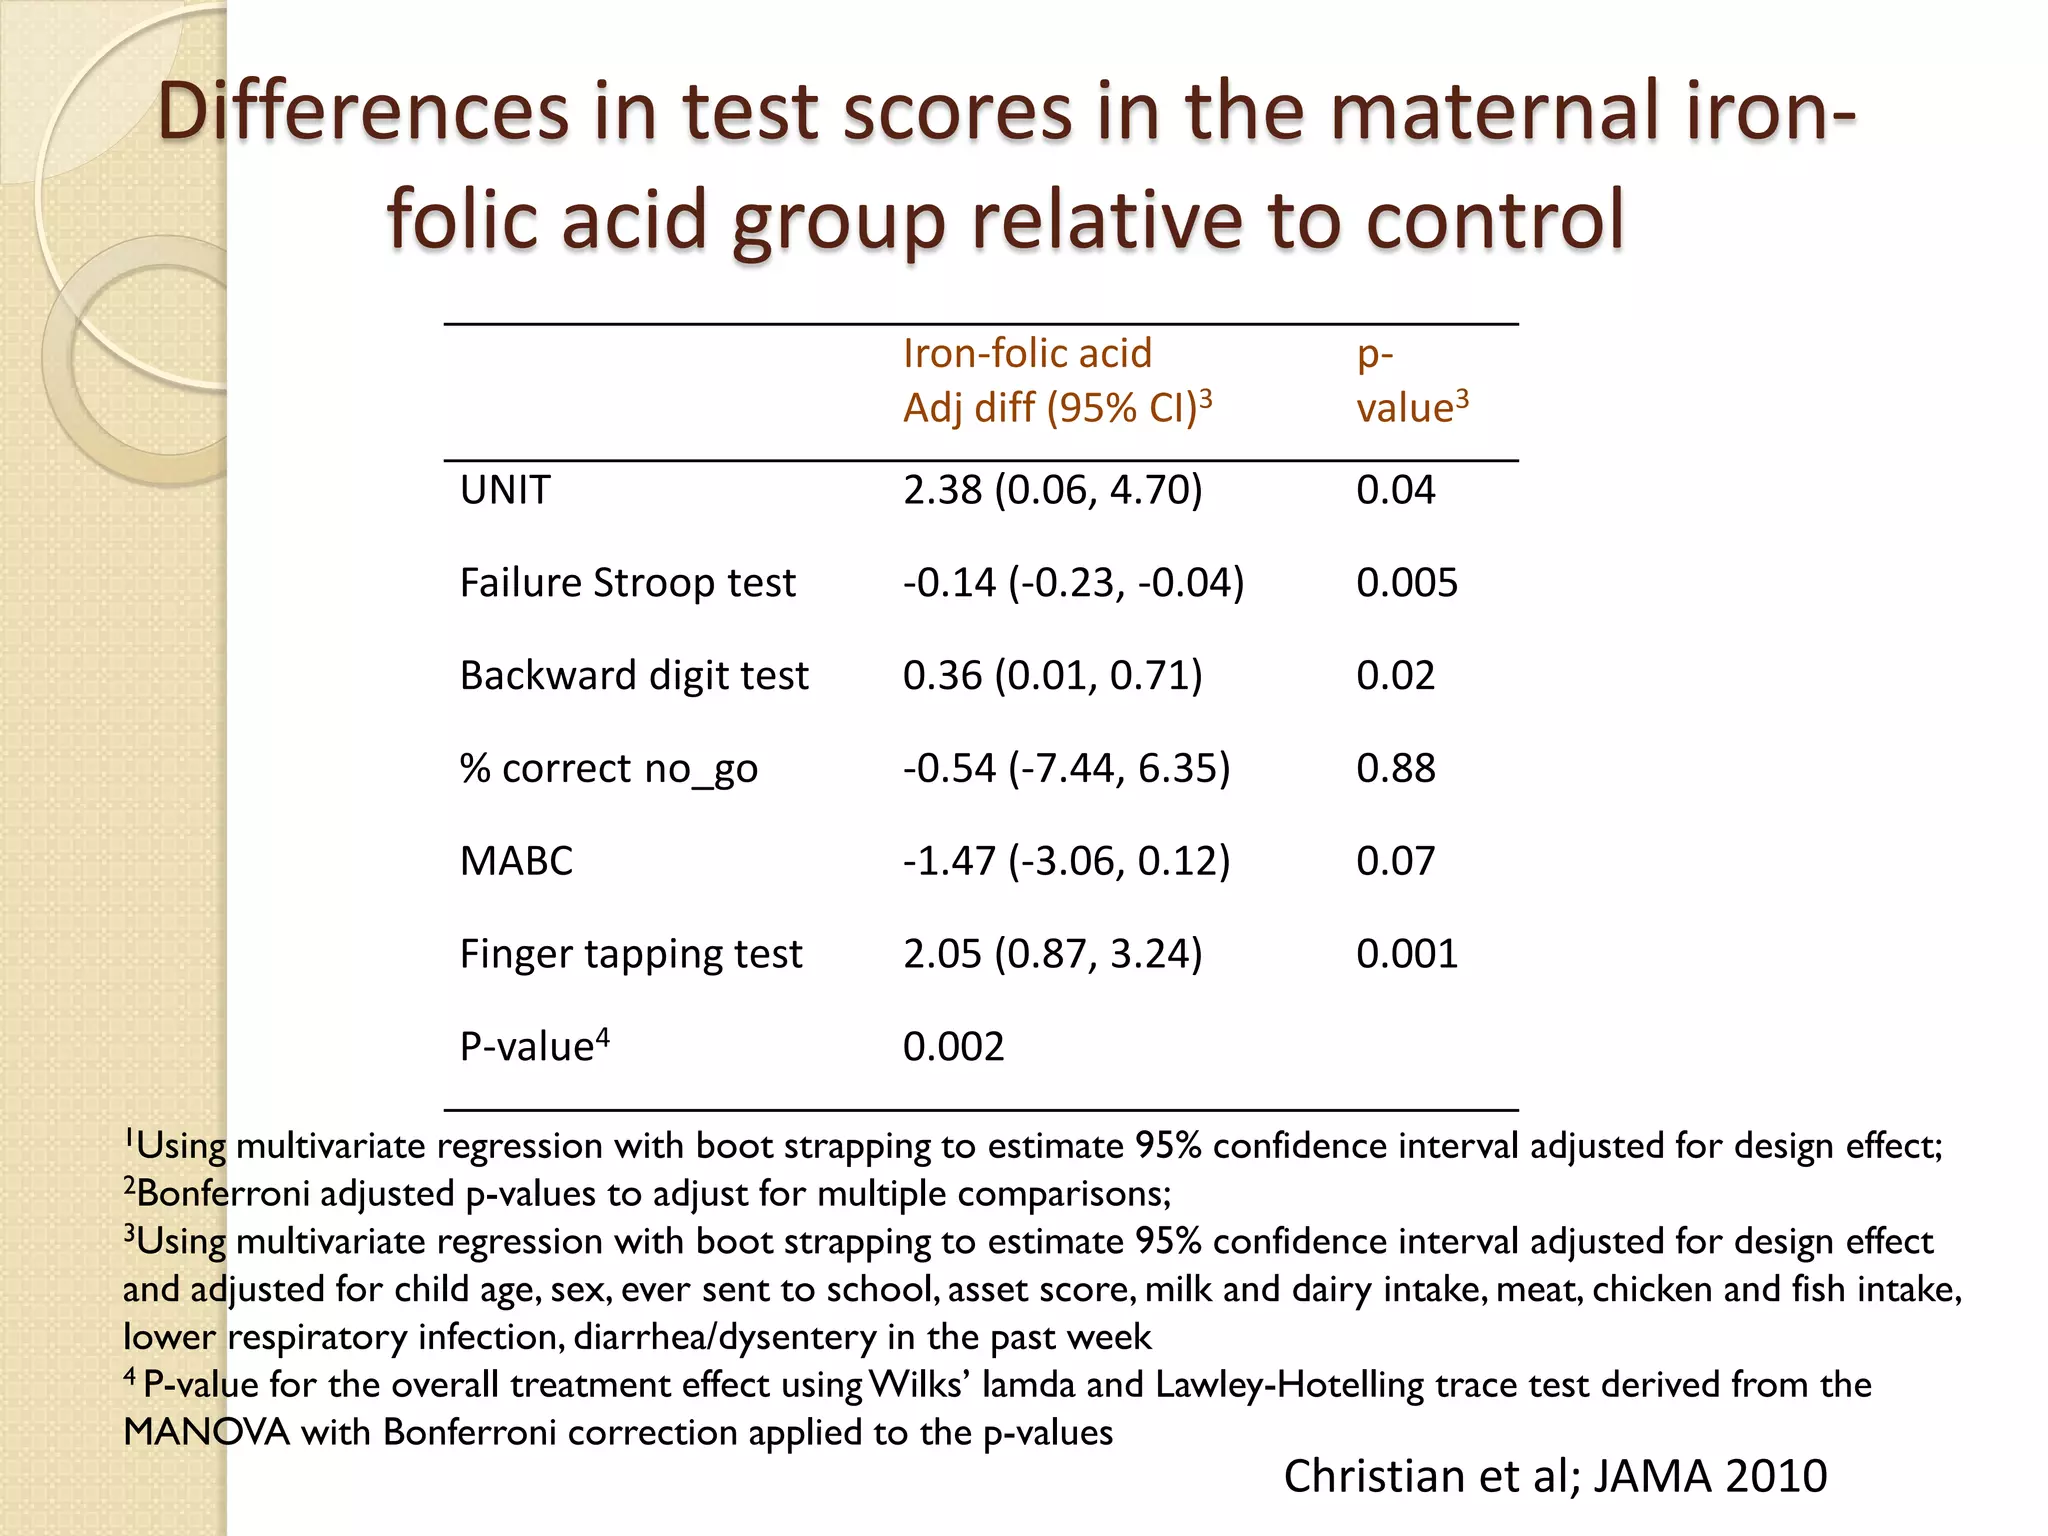
Impact of maternal nutritional
interventions on short and long
term health, survival, and function
Parul Christian, DrPH, MSc
Johns Hopkins Bloomberg School of
Public Health, Baltimore, USA
COREWorkshop Baltimore, Apr 24, 2013
Short-term Outcomes
 Birth outcomes
◦ Birth weight/size; fetal growth
◦ Gestational age
◦ Stillbirth and perinatal mortality
 Neonatal and infant morbidity and mortality
Birth weight, FGR and preterm birth
 Birth weight is a cumulative measure of
intrauterine growth and gestational age
◦ Low birth weight defined as <2500 g
◦ Birth weight is one of the leading factors
influencing subsequent health and survival in low
income countries where 90% of the 250 million
low birth weight babies are born each year
 Underlying causes of LBW are
◦ FGR - Fetal growth restriction (small-for-gestational
age, SGA defined as weight < 10th percentile of
standard for a given GA)
◦ Preterm birth (GA< 37 wk)
4
Systematic literature review &
Meta-analysis
- Included 5 LMIC studies
- 126,176 pregnant women
Apparent dose response
LIMITATIONS
-No indication of etiology of anemia
(iron deficiency, malaria, HIV, etc)
-Timing of anemia in pregnancy
Moderate-Severe Anemia
RR of SGA 1.53 (1.24-1.87)
LBW and preterm among adolescents
Gibbs et al, Pediatr Perinatal Epi 2012
Preg
Non-
preg
Baseline
1y follow-up
(∆)
Baseline
1y follow-up
(∆)
Between group
difference in ∆, p-value
Height (cm) MUAC (cm)
Mean ± SD
149.2 ± 5.4
149.2 ± 5.3
-0.05 ± 0.72
149.4 ± 5.1
149.7 ± 5.0
0.29 ± 0.82a
<0.001
a. Baseline and follow-up measurements being significantly different with p<0.001
using a paired t-test
<0.001
23.4 ± 1.8
22.7 ± 1.8
-0.65 ± 1.11a
23.2 ± 2.0
23.5 ± 2.0
0.28 ± 0.90a
<0.001
BMI (kg/m2)
19.3 ± 1.7
19.0 ± 1.7
-0.35 ± 1.17a
19.0 ± 2.0
19.3 ± 2.0
0.29 ± 0.98a
Rah et al; J Nutr 2008
Influence of early pregnancy on growth and adolescent
nutritional status in rural Bangladesh
Subramanian et al; PlosOne 2011
Height of Nations: Patterns among women in 54 LMIC
Maternal supplementation in
pregnancy to reduce SGA and LBW
 Balanced energy and protein (food) (Imdad &
Bhutta, Pediatr Peri Epi 2012)
◦ 74 g overall increase in birth weight; 100 g in
malnourished women
◦ 44% reduction in SGA
 Iron w/wo folic acid (Imdad & Bhutta, Pediatr Peri Epi
2012)
◦ 20% reduction in LBW
Prevalence of micronutrients deficiencies in
early pregnancy in rural Nepal
61.1
39.8
0.7
11.1
28.3
40.3
31.8
37.4
32.8
13.9
40.2
0
20
40
60
%
(Jiang et al; J Nutr 2005)
Multiple micronutrient
supplementation and birth weight
Ramakrishnan et al; Pediatr Peri Epi 2012
Multiple micronutrient
supplementation and risk of SGA
Ramakrishnan et al; Pediatr Peri Epi 2012
Long-term Outcomes
 Linear and ponderal growth in childhood
 Long term survival
 Cardiometabolic health
◦ Metabolic syndrome
 Cognition and motor function
Developmental Origins of Health
and Disease - DOHaD
 Previously known as the “Barker’s” or
“Early/Fetal Origins” Hypothesis
 Early life nutritional and environmental factors
may impact later life disease risk
 Most of the focus has been on the association
between size at birth and the risk of
cardiovascular disease and type 2 diabetes in
adulthood
Risk of CHD by birth weight
Gluckman and Hanson; 2005
Odds ratios for impaired glucose
tolerance or Type II diabetes among
64 yr old men in Hertfordshire
(adjusted for adult BMI)
Odds ratios for metabolic syndrome
among men in Hertfordshire
(adjusted for adult BMI)
Hales & Barker, 2001
DOHaD Concepts
 Thrifty Genotype (Neel, 1962)
 Thrifty Phenotype (Hales & Barker, 1992)
 Developmental plasticity
 Programming or Developmental Induction (Nathanielsz
1999)
 Predictive adaptive response (Gluckman & Hanson, 2005)
 Not just “fetal” but postnatal environment is
important
 Birth weight is an inadequate marker of prenatal
etiologic pathways
Hales & Barker, 2001
“The Thrifty Phenotype”
Match-Mismatch theory of metabolic disease
Gluckman et al, Am J Hum Biol, 2007
Long term Consequences
- Growth and body composition
- Child survival
- Child cardiometabolic risk
Maternal food supplementation and CVD
risk in 11-17 y old Gambian offspring
Hawkesworth et al; AJCN 2011
Maternal calcium supplementation and CVD
risk in11-17 y old Gambian offspring
Hawkesworth et al; AJCN 2011
Antenatal MMN supplementation
effects on children’s weight and size
at 2 years of age in Nepal
IFA (n=453)
Mean (SD)
MMN (n=462)
Mean (SD)
Difference (95% CI) p-value
WAZ -1.76 (0.98) -1.63 (1.08) 0.14 (0.001, 0.27) 0.048
HAZ -2.28 (1.06) -2.20 (1.12) 0.08 (-0.06, 0.22) 0.048
WHZ -0.40 (1.05) -0.28 (1.12) 0.12 (-0.02, 0.26) 0.097
HC (cm) 46.40 (1.43) 46.64 (1.49) 0.24 (0.06, 0.43) <0.05
BP (mmHg) 101.9 (17.4) 99.4 (13.7) -2.5 (-0.5, -4.6) <0.05
Vaidya et al; Lancet 2008
Nepal Study and Interventions(1999-2001)
 A double-masked, controlled, cluster randomized
trial of antenatal and postnatal micronutrient
supplementation to examine impact on birth
outcomes and infant survival
 5 supplement groups:
◦ C Vitamin A (Control)
◦ FA VA + Folic acid
◦ FAFe Folic Acid and Iron
◦ FAFeZn Folic acid, Iron and Zinc
◦ MM Multiple micronutrient
 A cross-sectional follow-up was conducted in
2006-2008 to examine growth, survival, and
biomarkers of cardiometabolic risk in the
offspring at 6-8 y of age
Christian et al;AJE 2009
Impact of antenatal micronutrient supplementation
on child survival through 7 y of age: Nepal
Anthropometry of children at
birth and at follow-up
Measure Birth 6-8 y old
Mean (SD)
Weight (kg) 2.64 (0.42) 18.05 (2.33)
Length / height (cm) 47.37 (2.26) 113.49 (5.50)
Weight for age z-score -1.52 (1.04) -2.09 (0.89)
Length for age z-score -1.19 (1.11) -1.90 (0.88)
Weight for length z-score -1.01 (1.11) --
BMI for age z-score -1.49 (1.11) -1.22 (0.86)
*Z-scores calculated using WHO growth standard for children <5 y (WHO 2006) and school-aged
children (de Onis 2007)
Effect of maternal supplementation on child
anthropometry at 6-8 y of age
Control FA FAFe FAFeZn MM
n=701 n=630 n=641 n=663 n=721
Mean (SD) Difference (95%CI)2
Height (cm) 113.3 (5.4) 0.3 (-0.3,0.9) -0.0 (-0.6,0.6) 0.6 (0.0, 1.3)* -0.1 (-0.7,0.5)
Weight (kg) 18.0 (2.2) 0.0 (-0.3, 0.3) -0.0 (-0.3, 0.3) 0.1 (-0.2, 0.4) -0.1 (-0.4, 0.2)
BMI (kg/m2) 14.0 (1.1) -0.0 (-0.2, 0.1) -0.0 (-0.2, 0.1) -0.1 (-0.2, 0.0) -0.1 (-0.2, 0.1)
Waist circ. (cm) 51.2 (3.0) -0.0 (-0.4, 0.4) 0.0 (-0.4, 0.4) -0.1 (-0.5, 0.3) -0.1 (-0.5, 0.3)
MUAC (cm) 15.4 (1.1) 0.0 (-0.1, 0.2) -0.0 (-0.2, 0.1) -0.0 (-0.2, 0.1) 0.0 (-0.1, 0.2)
Difference from control, adjusted for the age of the child at follow-up and the design effect using a GEE linear regression model. Height
and weight models additionally adjusted for birth length and birth weight, respectively.* p<0.05, difference relative to the control.
Stewart et al; AJCN 2009
Differences in triceps and subscapular skinfolds and
arm fat area among children 6-8 y by treatment
-.4
-.2
0
.2
Armfatareadifference(cm2)
-.4
-.2
0
.2
Skinfoldthicknessdifference(mm)
TSF SSF AFA.
Folic acid
Folic acid-iron
Folic acid-iron-zinc
Multiple micronutrient
Maternal supplement group
-0.25 mm (-0.44, -0.06) -0.20 mm (-0.33, -0.06) -0.18 cm2 (-0.34, -0.01)
Stewart et al; AJCN 2009
0
20
40
60
80
100
Meanbloodpressure(mmHg)
Control FA FAFe FAFeZn MM
4
4.5
5
5.5
MeanHbA1c(%)
Control FA FAFe FAFeZn MM0
.1
.2
.3
.4
.5
MedianHOMA-IR
Control FA FAFe FAFeZn MM
HbA1c
Blood Pressure
Insulin resistance (HOMA)
▬▬ Systolic
▬ Diastolic
The risk of metabolic syndrome by
maternal supplement group
Control FA FAFe FAFeZn MM
n (%) 75 (11.7) 47 (8.1) 74 (12.2) 70 (11.4) 80 (11.9)
OR
(95% CI)1 1.00
0.63*
(0.41,0.97)
1.02
(0.70,1.49)
0.95
(0.65,1.40)
1.00
(0.69,1.45)
1 Adjusted for child age at follow-up, and the design effect and for fasting status
Stewart et al; J Nutr 2009
1.2
0.4
0.6
0.8
1.0
Oddsratio
FA FAFe FAFeZn MM
The risk of microalbuminuria (MA/CR≥30
mg/g) by maternal supplement group
The risk of microalbuminuria (microalbumin/creatinine ratio ≥30 mg/g. Odds ratios and 95% CI calculated adjusting
for the design effect and child age at follow-up using a GEE logistic model.
0.56 (0.33, 0.93)
0.77 (0.49, 1.22)
0.53 (0.32, 0.89)
0.70 (0.44, 1.11)
Stewart et al; J Nutr 2009
Long term Consequences
- Child cognition and motor
function
1Using multivariate regression with boot strapping to estimate 95% confidence interval adjusted for design effect;
2Bonferroni adjusted p-values to adjust for multiple comparisons;
3Using multivariate regression with boot strapping to estimate 95% confidence interval adjusted for design effect
and adjusted for child age, sex, ever sent to school, asset score, milk and dairy intake, meat, chicken and fish intake,
lower respiratory infection, diarrhea/dysentery in the past week
4 P-value for the overall treatment effect usingWilks’ lamda and Lawley-Hotelling trace test derived from the
MANOVA with Bonferroni correction applied to the p-values
Differences in test scores in the maternal iron-
folic acid group relative to control
Iron-folic acid
Adj diff (95% CI)3
p-
value3
UNIT 2.38 (0.06, 4.70) 0.04
Failure Stroop test -0.14 (-0.23, -0.04) 0.005
Backward digit test 0.36 (0.01, 0.71) 0.02
% correct no_go -0.54 (-7.44, 6.35) 0.88
MABC -1.47 (-3.06, 0.12) 0.07
Finger tapping test 2.05 (0.87, 3.24) 0.001
P-value4 0.002
Christian et al; JAMA 2010
Discussion
 Nutritional interventions during pregnancy such as
food and micronutrient supplementation have been
shown to impact fetal growth although evidence for an
effect on gestational duration is limited
 Evidence of benefit of preconceptional and early
pregnancy interventions is limited – future research is
urgently needed
 The need for a life-course approach for intervening is
reflected in the emphasis on the first 1000 days, but
should be expanded perhaps to -365 days
Discussion
 In LMICs increasing rates of overweight and
obesity among pregnant women and associated
risks of pregnancy complications and adverse
birth outcomes are of concern
 In countries undergoing rapid nutrition transition,
the impact of nutritional advice and counseling
for appropriate weight gain, activity levels and
other life style factors, and adequate nutrient
intakes during pregnancy need further evaluation
 Long term cohort follow-ups are needed to
evaluate the impact of early life interventions on
long term cognitive function and cardiometabolic
health

Christian cor eworkshop_apr2013_to share

  • 1.
    Impact of maternalnutritional interventions on short and long term health, survival, and function Parul Christian, DrPH, MSc Johns Hopkins Bloomberg School of Public Health, Baltimore, USA COREWorkshop Baltimore, Apr 24, 2013
  • 2.
    Short-term Outcomes  Birthoutcomes ◦ Birth weight/size; fetal growth ◦ Gestational age ◦ Stillbirth and perinatal mortality  Neonatal and infant morbidity and mortality
  • 3.
    Birth weight, FGRand preterm birth  Birth weight is a cumulative measure of intrauterine growth and gestational age ◦ Low birth weight defined as <2500 g ◦ Birth weight is one of the leading factors influencing subsequent health and survival in low income countries where 90% of the 250 million low birth weight babies are born each year  Underlying causes of LBW are ◦ FGR - Fetal growth restriction (small-for-gestational age, SGA defined as weight < 10th percentile of standard for a given GA) ◦ Preterm birth (GA< 37 wk)
  • 4.
    4 Systematic literature review& Meta-analysis - Included 5 LMIC studies - 126,176 pregnant women Apparent dose response LIMITATIONS -No indication of etiology of anemia (iron deficiency, malaria, HIV, etc) -Timing of anemia in pregnancy Moderate-Severe Anemia RR of SGA 1.53 (1.24-1.87)
  • 5.
    LBW and pretermamong adolescents Gibbs et al, Pediatr Perinatal Epi 2012
  • 6.
    Preg Non- preg Baseline 1y follow-up (∆) Baseline 1y follow-up (∆) Betweengroup difference in ∆, p-value Height (cm) MUAC (cm) Mean ± SD 149.2 ± 5.4 149.2 ± 5.3 -0.05 ± 0.72 149.4 ± 5.1 149.7 ± 5.0 0.29 ± 0.82a <0.001 a. Baseline and follow-up measurements being significantly different with p<0.001 using a paired t-test <0.001 23.4 ± 1.8 22.7 ± 1.8 -0.65 ± 1.11a 23.2 ± 2.0 23.5 ± 2.0 0.28 ± 0.90a <0.001 BMI (kg/m2) 19.3 ± 1.7 19.0 ± 1.7 -0.35 ± 1.17a 19.0 ± 2.0 19.3 ± 2.0 0.29 ± 0.98a Rah et al; J Nutr 2008 Influence of early pregnancy on growth and adolescent nutritional status in rural Bangladesh
  • 7.
    Subramanian et al;PlosOne 2011 Height of Nations: Patterns among women in 54 LMIC
  • 8.
    Maternal supplementation in pregnancyto reduce SGA and LBW  Balanced energy and protein (food) (Imdad & Bhutta, Pediatr Peri Epi 2012) ◦ 74 g overall increase in birth weight; 100 g in malnourished women ◦ 44% reduction in SGA  Iron w/wo folic acid (Imdad & Bhutta, Pediatr Peri Epi 2012) ◦ 20% reduction in LBW
  • 9.
    Prevalence of micronutrientsdeficiencies in early pregnancy in rural Nepal 61.1 39.8 0.7 11.1 28.3 40.3 31.8 37.4 32.8 13.9 40.2 0 20 40 60 % (Jiang et al; J Nutr 2005)
  • 10.
    Multiple micronutrient supplementation andbirth weight Ramakrishnan et al; Pediatr Peri Epi 2012
  • 11.
    Multiple micronutrient supplementation andrisk of SGA Ramakrishnan et al; Pediatr Peri Epi 2012
  • 12.
    Long-term Outcomes  Linearand ponderal growth in childhood  Long term survival  Cardiometabolic health ◦ Metabolic syndrome  Cognition and motor function
  • 13.
    Developmental Origins ofHealth and Disease - DOHaD  Previously known as the “Barker’s” or “Early/Fetal Origins” Hypothesis  Early life nutritional and environmental factors may impact later life disease risk  Most of the focus has been on the association between size at birth and the risk of cardiovascular disease and type 2 diabetes in adulthood
  • 14.
    Risk of CHDby birth weight Gluckman and Hanson; 2005
  • 15.
    Odds ratios forimpaired glucose tolerance or Type II diabetes among 64 yr old men in Hertfordshire (adjusted for adult BMI) Odds ratios for metabolic syndrome among men in Hertfordshire (adjusted for adult BMI) Hales & Barker, 2001
  • 16.
    DOHaD Concepts  ThriftyGenotype (Neel, 1962)  Thrifty Phenotype (Hales & Barker, 1992)  Developmental plasticity  Programming or Developmental Induction (Nathanielsz 1999)  Predictive adaptive response (Gluckman & Hanson, 2005)  Not just “fetal” but postnatal environment is important  Birth weight is an inadequate marker of prenatal etiologic pathways
  • 17.
    Hales & Barker,2001 “The Thrifty Phenotype”
  • 18.
    Match-Mismatch theory ofmetabolic disease Gluckman et al, Am J Hum Biol, 2007
  • 19.
    Long term Consequences -Growth and body composition - Child survival - Child cardiometabolic risk
  • 20.
    Maternal food supplementationand CVD risk in 11-17 y old Gambian offspring Hawkesworth et al; AJCN 2011
  • 21.
    Maternal calcium supplementationand CVD risk in11-17 y old Gambian offspring Hawkesworth et al; AJCN 2011
  • 22.
    Antenatal MMN supplementation effectson children’s weight and size at 2 years of age in Nepal IFA (n=453) Mean (SD) MMN (n=462) Mean (SD) Difference (95% CI) p-value WAZ -1.76 (0.98) -1.63 (1.08) 0.14 (0.001, 0.27) 0.048 HAZ -2.28 (1.06) -2.20 (1.12) 0.08 (-0.06, 0.22) 0.048 WHZ -0.40 (1.05) -0.28 (1.12) 0.12 (-0.02, 0.26) 0.097 HC (cm) 46.40 (1.43) 46.64 (1.49) 0.24 (0.06, 0.43) <0.05 BP (mmHg) 101.9 (17.4) 99.4 (13.7) -2.5 (-0.5, -4.6) <0.05 Vaidya et al; Lancet 2008
  • 23.
    Nepal Study andInterventions(1999-2001)  A double-masked, controlled, cluster randomized trial of antenatal and postnatal micronutrient supplementation to examine impact on birth outcomes and infant survival  5 supplement groups: ◦ C Vitamin A (Control) ◦ FA VA + Folic acid ◦ FAFe Folic Acid and Iron ◦ FAFeZn Folic acid, Iron and Zinc ◦ MM Multiple micronutrient  A cross-sectional follow-up was conducted in 2006-2008 to examine growth, survival, and biomarkers of cardiometabolic risk in the offspring at 6-8 y of age
  • 24.
    Christian et al;AJE2009 Impact of antenatal micronutrient supplementation on child survival through 7 y of age: Nepal
  • 25.
    Anthropometry of childrenat birth and at follow-up Measure Birth 6-8 y old Mean (SD) Weight (kg) 2.64 (0.42) 18.05 (2.33) Length / height (cm) 47.37 (2.26) 113.49 (5.50) Weight for age z-score -1.52 (1.04) -2.09 (0.89) Length for age z-score -1.19 (1.11) -1.90 (0.88) Weight for length z-score -1.01 (1.11) -- BMI for age z-score -1.49 (1.11) -1.22 (0.86) *Z-scores calculated using WHO growth standard for children <5 y (WHO 2006) and school-aged children (de Onis 2007)
  • 26.
    Effect of maternalsupplementation on child anthropometry at 6-8 y of age Control FA FAFe FAFeZn MM n=701 n=630 n=641 n=663 n=721 Mean (SD) Difference (95%CI)2 Height (cm) 113.3 (5.4) 0.3 (-0.3,0.9) -0.0 (-0.6,0.6) 0.6 (0.0, 1.3)* -0.1 (-0.7,0.5) Weight (kg) 18.0 (2.2) 0.0 (-0.3, 0.3) -0.0 (-0.3, 0.3) 0.1 (-0.2, 0.4) -0.1 (-0.4, 0.2) BMI (kg/m2) 14.0 (1.1) -0.0 (-0.2, 0.1) -0.0 (-0.2, 0.1) -0.1 (-0.2, 0.0) -0.1 (-0.2, 0.1) Waist circ. (cm) 51.2 (3.0) -0.0 (-0.4, 0.4) 0.0 (-0.4, 0.4) -0.1 (-0.5, 0.3) -0.1 (-0.5, 0.3) MUAC (cm) 15.4 (1.1) 0.0 (-0.1, 0.2) -0.0 (-0.2, 0.1) -0.0 (-0.2, 0.1) 0.0 (-0.1, 0.2) Difference from control, adjusted for the age of the child at follow-up and the design effect using a GEE linear regression model. Height and weight models additionally adjusted for birth length and birth weight, respectively.* p<0.05, difference relative to the control. Stewart et al; AJCN 2009
  • 27.
    Differences in tricepsand subscapular skinfolds and arm fat area among children 6-8 y by treatment -.4 -.2 0 .2 Armfatareadifference(cm2) -.4 -.2 0 .2 Skinfoldthicknessdifference(mm) TSF SSF AFA. Folic acid Folic acid-iron Folic acid-iron-zinc Multiple micronutrient Maternal supplement group -0.25 mm (-0.44, -0.06) -0.20 mm (-0.33, -0.06) -0.18 cm2 (-0.34, -0.01) Stewart et al; AJCN 2009
  • 28.
    0 20 40 60 80 100 Meanbloodpressure(mmHg) Control FA FAFeFAFeZn MM 4 4.5 5 5.5 MeanHbA1c(%) Control FA FAFe FAFeZn MM0 .1 .2 .3 .4 .5 MedianHOMA-IR Control FA FAFe FAFeZn MM HbA1c Blood Pressure Insulin resistance (HOMA) ▬▬ Systolic ▬ Diastolic
  • 29.
    The risk ofmetabolic syndrome by maternal supplement group Control FA FAFe FAFeZn MM n (%) 75 (11.7) 47 (8.1) 74 (12.2) 70 (11.4) 80 (11.9) OR (95% CI)1 1.00 0.63* (0.41,0.97) 1.02 (0.70,1.49) 0.95 (0.65,1.40) 1.00 (0.69,1.45) 1 Adjusted for child age at follow-up, and the design effect and for fasting status Stewart et al; J Nutr 2009
  • 30.
    1.2 0.4 0.6 0.8 1.0 Oddsratio FA FAFe FAFeZnMM The risk of microalbuminuria (MA/CR≥30 mg/g) by maternal supplement group The risk of microalbuminuria (microalbumin/creatinine ratio ≥30 mg/g. Odds ratios and 95% CI calculated adjusting for the design effect and child age at follow-up using a GEE logistic model. 0.56 (0.33, 0.93) 0.77 (0.49, 1.22) 0.53 (0.32, 0.89) 0.70 (0.44, 1.11) Stewart et al; J Nutr 2009
  • 31.
    Long term Consequences -Child cognition and motor function
  • 32.
    1Using multivariate regressionwith boot strapping to estimate 95% confidence interval adjusted for design effect; 2Bonferroni adjusted p-values to adjust for multiple comparisons; 3Using multivariate regression with boot strapping to estimate 95% confidence interval adjusted for design effect and adjusted for child age, sex, ever sent to school, asset score, milk and dairy intake, meat, chicken and fish intake, lower respiratory infection, diarrhea/dysentery in the past week 4 P-value for the overall treatment effect usingWilks’ lamda and Lawley-Hotelling trace test derived from the MANOVA with Bonferroni correction applied to the p-values Differences in test scores in the maternal iron- folic acid group relative to control Iron-folic acid Adj diff (95% CI)3 p- value3 UNIT 2.38 (0.06, 4.70) 0.04 Failure Stroop test -0.14 (-0.23, -0.04) 0.005 Backward digit test 0.36 (0.01, 0.71) 0.02 % correct no_go -0.54 (-7.44, 6.35) 0.88 MABC -1.47 (-3.06, 0.12) 0.07 Finger tapping test 2.05 (0.87, 3.24) 0.001 P-value4 0.002 Christian et al; JAMA 2010
  • 33.
    Discussion  Nutritional interventionsduring pregnancy such as food and micronutrient supplementation have been shown to impact fetal growth although evidence for an effect on gestational duration is limited  Evidence of benefit of preconceptional and early pregnancy interventions is limited – future research is urgently needed  The need for a life-course approach for intervening is reflected in the emphasis on the first 1000 days, but should be expanded perhaps to -365 days
  • 34.
    Discussion  In LMICsincreasing rates of overweight and obesity among pregnant women and associated risks of pregnancy complications and adverse birth outcomes are of concern  In countries undergoing rapid nutrition transition, the impact of nutritional advice and counseling for appropriate weight gain, activity levels and other life style factors, and adequate nutrient intakes during pregnancy need further evaluation  Long term cohort follow-ups are needed to evaluate the impact of early life interventions on long term cognitive function and cardiometabolic health