Download Us blood cancer drug market & pipeline analysis 2015

US pharmaceutical companies have identified opportunities to generate significant revenues from treating blood cancers in the US market. The number of blood cancer cases is rising, and demand exists for improved therapies. As a result, many new drugs have been introduced for treating blood cancers. Several innovative therapies are in clinical trials that could be approved in coming years. Key drug classes for treating blood cancers include chemotherapy drugs, monoclonal antibodies, and tyrosine kinase inhibitors, which have shown better outcomes than chemotherapy alone. The future blood cancer drug market is expected to grow as more innovative therapies enter the market, though developing treatments remains challenging due to the heterogeneity of blood cancers.

Recommended
Recommended
More Related Content
What's hot
What's hot (20)
Similar to Download Us blood cancer drug market & pipeline analysis 2015
Similar to Download Us blood cancer drug market & pipeline analysis 2015 (20)
More from KuicK Research
More from KuicK Research (20)
Recently uploaded
Recently uploaded (20)
Download Us blood cancer drug market & pipeline analysis 2015
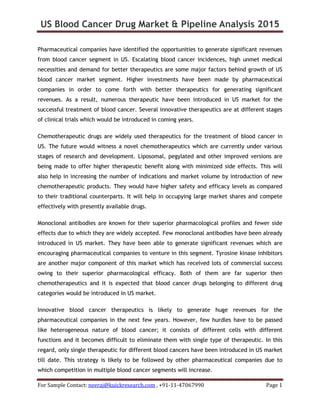
- 1. US Blood Cancer Drug Market & Pipeline Analysis 2015 For Sample Contact: neeraj@kuickresearch.com , +91-11-47067990 Page 1 Pharmaceutical companies have identified the opportunities to generate significant revenues from blood cancer segment in US. Escalating blood cancer incidences, high unmet medical necessities and demand for better therapeutics are some major factors behind growth of US blood cancer market segment. Higher investments have been made by pharmaceutical companies in order to come forth with better therapeutics for generating significant revenues. As a result, numerous therapeutic have been introduced in US market for the successful treatment of blood cancer. Several innovative therapeutics are at different stages of clinical trials which would be introduced in coming years. Chemotherapeutic drugs are widely used therapeutics for the treatment of blood cancer in US. The future would witness a novel chemotherapeutics which are currently under various stages of research and development. Liposomal, pegylated and other improved versions are being made to offer higher therapeutic benefit along with minimized side effects. This will also help in increasing the number of indications and market volume by introduction of new chemotherapeutic products. They would have higher safety and efficacy levels as compared to their traditional counterparts. It will help in occupying large market shares and compete effectively with presently available drugs. Monoclonal antibodies are known for their superior pharmacological profiles and fewer side effects due to which they are widely accepted. Few monoclonal antibodies have been already introduced in US market. They have been able to generate significant revenues which are encouraging pharmaceutical companies to venture in this segment. Tyrosine kinase inhibitors are another major component of this market which has received lots of commercial success owing to their superior pharmacological efficacy. Both of them are far superior then chemotherapeutics and it is expected that blood cancer drugs belonging to different drug categories would be introduced in US market. Innovative blood cancer therapeutics is likely to generate huge revenues for the pharmaceutical companies in the next few years. However, few hurdles have to be passed like heterogeneous nature of blood cancer; it consists of different cells with different functions and it becomes difficult to eliminate them with single type of therapeutic. In this regard, only single therapeutic for different blood cancers have been introduced in US market till date. This strategy is likely to be followed by other pharmaceutical companies due to which competition in multiple blood cancer segments will increase.
- 2. US Blood Cancer Drug Market & Pipeline Analysis 2015 For Sample Contact: neeraj@kuickresearch.com , +91-11-47067990 Page 2 Market introduction of such therapeutics is likely to be widely accepted leading to generation of significant revenues. More blood cancer therapeutics is likely to enter in US market due to which its size will increase. "US Blood Cancer Drug Market & Pipeline Analysis 2015" Report Highlights: • Blood Cancer Incidence & Prevalence • Blood Cancer Drug Market Overview • Blood Cancer Drug Market Dynamics • Leukemia, Lymphoma & Myeloma Drug Clinical Pipeline Insight • Leukemia, Lymphoma & Myeloma Drug Clinical Pipeline: 435 Drugs • Majority Drugs in Phase-I Clinical Trials: 128 Drugs • Marketed Leukemia, Lymphoma & Myeloma Drug Clinical & Patent Analysis • Marketed Leukemia, Lymphoma & Myeloma Drug: 48 Drugs For Report Sample Contact: neeraj@kuickresearch.com
- 3. US Blood Cancer Drug Market & Pipeline Analysis 2015 For Sample Contact: neeraj@kuickresearch.com , +91-11-47067990 Page 3 Table of Contents 1. US Blood Cancer Incidence & Prevalence 1.1 Leukemia: Cancer of White Blood Cells (WBC) 1.1.1 Acute Lymphocytic Leukemia (ALL) 1.1.2 Acute Myeloid Leukemia (AML) 1.1.3 Chronic Lymphocytic Leukemia (CLL) 1.1.4 Chronic Myeloid Leukemia (CML) 1.2 Lymphoma: Cancer of Lymphatic System 1.2.1 Hodgkin Lymphoma 1.2.2 Non-Hodgkin Lymphoma (NHL) 1.3 Myeloma 2. US Blood Cancer Drug Market Overview 2.1 Current Market Scenario 2.2 US Blood Cancer Drug Clinical Pipeline Overview 3. US Blood Cancer Drug Market Dynamics 3.1 Favorable Market Parameters 3.2 Commercialization Challenges 4. US Blood Cancer Drug Market Future Prospects 5. Mechanism of Blood Cancer Therapeutics 6. Leukemia Drug Clinical Pipeline by Company & Phase 6.1 Research till Registered 6.2 Discontinued & Suspended Leukemia Drug Clinical Insight
- 4. US Blood Cancer Drug Market & Pipeline Analysis 2015 For Sample Contact: neeraj@kuickresearch.com , +91-11-47067990 Page 4 7. Marketed Leukemia Drug Clinical Insight 7.1 Alemtuzumab (Campath®) 7.2 Arsenic Trioxide (Trisenox®) 7.3 Bosutinib (Bosulif®) 7.4 Clofarabine 7.5 Crisantaspase (Erwinaze®) 7.6 Dasatinib (Sprycel®) 7.7 Fludarabine (Fludara®) 7.8 Idarubicin (Idamycin®) 7.9 Imatinib (Gleevec®) 7.10 Irinotecan 7.11 Mercaptopurine Oral Suspension (Purixan™) 7.12 Mitoxantrone (Novantrone®) 7.13 Nilotinib (Tasigna®) 7.14 Obinutuzumab (Gazyva®) 7.15 Ofatumumab (Arzerra®) 7.16 Omacetaxine Mepesuccinate (Synribo®) 7.17 Pegaspargase (Oncaspar®) 7.18 Pentostatin (Nipent®) 7.19 Ponatinib (Iclusig®) 7.20 Sargramostim (Leukine®) 7.21 Tretinoin 7.22 Vincristine Liposomal - Spectrum Pharmaceuticals (Marqibo®)
- 5. US Blood Cancer Drug Market & Pipeline Analysis 2015 For Sample Contact: neeraj@kuickresearch.com , +91-11-47067990 Page 5 8. Lymphoma Drug Clinical Pipeline by Company & Phase 8.1 Research till Registered 8.2 Discontinued & Suspended Lymphoma Drug Clinical Insight 9. Marketed Lymphoma Drug Clinical Insight 9.1 Belinostat (Beleodaq®) 9.2 Bexarotene Oral (Targretin®) 9.3 Bexarotene Topical (Targretin®) 9.4 Brentuximab Vedotin (Adcetris®) 9.5 Chlormethine (Valchlor™) 9.6 Denileukin Diftitox (ONTAK®) 9.7 Ibritumomab Tiuxetan (Zevalin®) 9.8 Interferon Alpha-2b (Intron® A) 9.9 Pralatrexate (Folotyn®) 9.10 Romidepsin (Istodax®) 9.11 Vorinostat (Zolinza®) 10. Multiple Myeloma Drug Clinical Pipeline by Company & Phase 10.1 Research till Preregistration 10.2 Discontinued & No Development Reported in Multiple Myeloma Drug Clinical Insight 11. Marketed Multiple Myeloma Drug Clinical Insight 11.1 Carfilzomib (Kyprolis®) 11.2 Doxorubicin Liposomal – ALZA 11.3 Pomalidomide (Pomalyst®) 11.4 Thalidomide (Thalomid®) 11.5 Zoledronic Acid (Zometa®)
- 6. US Blood Cancer Drug Market & Pipeline Analysis 2015 For Sample Contact: neeraj@kuickresearch.com , +91-11-47067990 Page 6 12. Multiple Blood Cancer Drug Clinical Pipeline by Company & Phase 12.1 Research till Preregistration 12.2 Discontinued & Suspended Multiple Blood Cancer Drug Clinical Insight 13. Marketed Multiple Blood Cancer Drug Clinical Insight 13.1 Azacitidine (Vidaza®) 13.2 Bendamustine (Treanda®) 13.3 Bortezomib (Velcade®) 13.4 Cladribine (Leustatin®) 13.5 Decitabine (Dacogen®) 13.6 Ibrutinib (Imbruvica®) 13.7 Idelalisib 13.8 Lenalidomide (Revlimid®) 13.9 Nelarabine (Arranon®) 13.10 Rituximab (Rituxan®) 14. Competitive Landscape 14.1 Actelion Pharmaceuticals 14.2 Amgen 14.3 ARIAD Pharmaceuticals 14.4 Astellas Pharma 14.5 Baxter BioScience 14.6 Bayer HealthCare Pharmaceuticals Inc. 14.7 Biogen Idec 14.8 Bristol-Myers Squibb 14.9 CASI Pharmaceuticals
- 7. US Blood Cancer Drug Market & Pipeline Analysis 2015 For Sample Contact: neeraj@kuickresearch.com , +91-11-47067990 Page 7 14.10 Celera Genomics Group 14.11 Celgene Corporation 14.12 Eisai 14.13 Genmab 14.14 Gilead Sciences 14.15 GlaxoSmithKline 14.16 Hospira 14.17 Johnson & Johnson 14.18 Millennium Pharmaceuticals 14.19 Nova Laboratories 14.20 Novartis 14.21 Onxeo SA 14.22 Onyx Pharmaceuticals 14.23 Otsuka Pharmaceutical 14.24 Pfizer 14.25 Roche 14.26 Scripps Clinic 14.27 Seattle Genetics 14.28 SRI International 14.29 Southern Research Institute 14.30 Tekmira Pharmaceuticals Corporation 14.31 Teva Pharmaceutical Industries 14.32 Yakult Honsha
- 8. US Blood Cancer Drug Market & Pipeline Analysis 2015 For Sample Contact: neeraj@kuickresearch.com , +91-11-47067990 Page 8 List of Figures Figure 1-1: Main Types of Blood Cancer Figure 1-2: Percentage of Leukemia in New Cancer Cases, 2015 Figure 1-3: Percentage of Leukemia in all Cancer Related Deaths, 2015 Figure 1-4: Leukemia Estimated Cases, 2013-2015 Figure 1-5: Leukemia Estimated New Cases in Males, 2013-2015 Figure 1-6: Leukemia Estimated New Cases in Females, 2013-2015 Figure 1-7: Leukemia Estimated Deaths, 2013-2015 Figure 1-8: Leukemia Estimated Deaths in Males, 2013-3015 Figure 1-9: Leukemia Estimated Deaths in Females, 2013-2015 Figure 1-10: Percentage of Acute Lymphocytic Leukemia in Cancer Related Deaths, 2015 Figure 1-11: Percentage of Acute Lymphocytic Leukemia in New Cancer Cases, 2015 Figure 1-12: Acute Lymphocytic Leukemia Estimated New Cases, 2013-2015 Figure 1-13: Acute Lymphocytic Leukemia Estimated New Cases in Males, 2013-2015 Figure 1-14: Acute Lymphocytic Leukemia Estimated New Cases in Female, 2013-2015 Figure 1-15: Acute Lymphocytic Leukemia Estimated Deaths, 2013-2015 Figure 1-16: Acute Lymphocytic Leukemia Estimated Deaths in Males, 2013-2015 Figure 1-17: Acute Lymphocytic Leukemia Estimated Deaths in Females, 2013-2015 Figure 1-18: Acute Myeloid Leukemia Estimated New Cases, 2013-2015 Figure 1-19: Acute Myeloid Leukemia Estimated New Cases in Males, 2013-2015 Figure 1-20: Acute Myeloid Leukemia Estimated New Cases in Females, 2013-2015 Figure 1-21: Percentage of Acute Myeloid Leukemia in New Cancer Cases, 2015 Figure 1-22: Percentage of Acute Myeloid Leukemia in all Cancer Deaths, 2015
- 9. US Blood Cancer Drug Market & Pipeline Analysis 2015 For Sample Contact: neeraj@kuickresearch.com , +91-11-47067990 Page 9 Figure 1-23: Acute Myeloid Leukemia Estimated Deaths, 2013-2015 Figure 1-24: Acute Myeloid Leukemia Estimated Deaths in Male, 2013-2015 Figure 1-25: Acute Myeloid Leukemia Estimated Deaths in Female, 2013-2015 Figure 1-26: Chronic Lymphocytic Leukemia Estimated New Cases, 2013-2015 Figure 1-27: Chronic Lymphocytic Leukemia Estimated New Cases in Males, 2013-2015 Figure 1-28: Chronic Lymphocytic Leukemia Estimated New Cases in Females, 2013-2015 Figure 1-29: Chronic Lymphocytic Leukemia Estimated Deaths, 2013-2015 Figure 1-30: Percentage of Chronic Lymphocytic Leukemia in New Cancer Cases, 2015 Figure 1-31: Percentage of Chronic Lymphocytic Leukemia in all Cancer Related Deaths, 2015 Figure 1-32: Chronic Lymphocytic Leukemia Estimated Deaths in Males, 2013-2015 Figure 1-33: Chronic Lymphocytic Leukemia Estimated Deaths in Females, 2013-2015 Figure 1-34: Percentage of Chronic Myeloid Leukemia in New Cancer Cases, 2015 Figure 1-35: Percentage of Chronic Myeloid Leukemia in all Cancer Related Deaths, 2015 Figure 1-36: Categories of Chronic Myeloid Leukemia (CML) Figure 1-37: Chronic Myeloid Leukemia Estimated New Cases, 2013-2015 Figure 1-38: Estimated New Cases of Chronic Myeloid Leukemia in Males, 2013-2015 Figure 1-39: Estimated New Cases of Chronic Myeloid Leukemia in Females, 2013-2015 Figure 1-40: Estimated Deaths due to Chronic Myeloid Leukemia, 2013-2015 Figure 1-41: Estimated Deaths due to Chronic Myeloid Leukemia in Male, 2013-2015 Figure 1-42: Estimated Deaths due to Chronic Myeloid Leukemia in Female, 2013-2015 Figure 1-43: Types of Lymphoma Figure 1-44: Identification of Different Types of Lymphomas Figure 1-45: Lymphoma Estimated New Cases, 2013-2015 Figure 1-46: Estimated New Cases of Lymphoma in Males, 2013-2015
- 10. US Blood Cancer Drug Market & Pipeline Analysis 2015 For Sample Contact: neeraj@kuickresearch.com , +91-11-47067990 Page 10 Figure 1-47: Estimated New Cases of Lymphoma in Females, 2013-2015 Figure 1-48: Estimated Lymphoma Deaths, 2013-2015 Figure 1-49: Lymphoma Estimated Deaths in Males, 2013-2015 Figure 1-50: Lymphoma Estimated Deaths in Females, 2013-2015 Figure 1-51: Percentage of Hodgkin Lymphoma in New Cancer Cases, 2015 Figure 1-52: Percentage of Hodgkin Lymphoma in all Cancer Related Deaths, 2015 Figure 1-53: Estimated New Cases of Hodgkin Lymphoma, 2013-2015 Figure 1-54: Estimated New Cases of Hodgkin Lymphoma in Male, 2013-2015 Figure 1-55: Estimated New Cases of Hodgkin Lymphoma in Females, 2013-2015 Figure 1-56: Hodgkin Lymphoma Estimated Deaths, 2013-2015 Figure 1-57: Hodgkin Lymphoma Estimated Deaths in Males, 2013-2015 Figure 1-58: Hodgkin Lymphoma Estimated Deaths in Female, 2013-2015 Figure 1-59: Percentage of Non-Hodgkin Lymphoma (NHL) in New Cancer Cases, 2015 Figure 1-60: Percentage of Non-Hodgkin Lymphoma in all Cancer Related Deaths, 2015 Figure 1-61: Non-Hodgkin Lymphoma Estimated New Cases, 2013-2015 Figure 1-62: Non-Hodgkin Lymphoma Estimated New Cases in Male, 2013-2015 Figure 1-63: Non-Hodgkin Lymphoma Estimated New Cases in Female, 2013-2015 Figure 1-64: Non-Hodgkin Lymphoma Estimated Deaths, 2013-2015 Figure 1-65: Non-Hodgkin Lymphoma Estimated Deaths in Males, 2013-2015 Figure 1-66: Non-Hodgkin Lymphoma Estimated Deaths in Females, 2015- 2013 Figure 1-67: Percentage of Myeloma in New Cancer Cases, 2015 Figure 1-68: Myeloma Estimated New Cases, 2013-2015 Figure 1-69: Myeloma Estimated New Cases in Males, 2013-2105 Figure 1-70: Myeloma Estimated New Cases in Females, 2013-2015
- 11. US Blood Cancer Drug Market & Pipeline Analysis 2015 For Sample Contact: neeraj@kuickresearch.com , +91-11-47067990 Page 11 Figure 1-71: Percentage of Myeloma in all Cancer Related Deaths, 2015 Figure 1-72: Myeloma Estimated Deaths, 2013-2015 Figure 1-73: Myeloma Estimated Deaths in Males, 213-2015 Figure 1-74: Myeloma Estimated Deaths in Females, 2013-2015 Figure 2-1: Blood Cancer Drug Pipeline Overview by Phase (%), 2015 Figure 2-2: Blood Cancer Drug Pipeline Overview by Phase (Number), 2015 Figure 2-3: No Development Reported Blood Cancer Drug Pipeline Overview by Phase (%), 2015 Figure 2-4: No Development Reported Blood Cancer Drug Pipeline Overview by Phase (Number), 2015 Figure 2-5: Discontinued Blood Cancer Drug Pipeline Overview by Phase (%), 2015 Figure 2-6: Discontinued Blood Cancer Drug Pipeline Overview by Phase (Number), 2015 Figure 2-7: Suspended Blood Cancer Drug Pipeline Overview by Phase (%), 2015 Figure 2-8: Suspended Blood Cancer Drug Pipeline Overview by Phase (Number), 2015 Figure 2-9: Leukemia Drug Pipeline Overview by Phase (%), 2015 Figure 2-10: Leukemia Drug Pipeline Overview by Phase (Number), 2015 Figure 2-11: No Development Reported Leukemia Drug Pipeline Overview by Phase (%), 2015 Figure 2-12: No Development Reported Leukemia Drug Pipeline Overview by Phase (Number), 2015 Figure 2-13: Discontinued Leukemia Drug Pipeline Overview by Phase (%), 2015 Figure 2-14: Discontinued Leukemia Drug Pipeline Overview by Phase (Number), 2015 Figure 2-15: Suspended Leukemia Drug Pipeline Overview by Phase (%), 2015 Figure 2-16: Suspended Leukemia Drug Pipeline Overview by Phase (Number), 2015 Figure 2-17: Lymphoma Drug Pipeline Overview by Phase (%), 2015 Figure 2-18: Lymphoma Drug Pipeline Overview by Phase (Number), 2015 Figure 2-19: No Development Reported Lymphoma Drug Pipeline Overview by Phase (%), 2015
- 12. US Blood Cancer Drug Market & Pipeline Analysis 2015 For Sample Contact: neeraj@kuickresearch.com , +91-11-47067990 Page 12 Figure 2-20: No Development Reported Lymphoma Drug Pipeline Overview by Phase (Number), 2015 Figure 2-21: Discontinued Lymphoma Drug Pipeline Overview by Phase (%), 2015 Figure 2-22: Discontinued Lymphoma Drug Pipeline Overview by Phase (Number), 2015 Figure 2-23: Suspended Lymphoma Drug Pipeline Overview by Phase (%), 2015 Figure 2-24: Suspended Lymphoma Drug Pipeline Overview by Phase (Number), 2015 Figure 2-25: Multiple Myeloma Drug Pipeline Overview by Phase (%), 2015 Figure 2-26: Multiple Myeloma Drug Pipeline Overview by Phase (Number), 2015 Figure 2-27: No Development Reported Multiple Myeloma Drug Pipeline Overview by Phase (%), 2015 Figure 2-28: No Development Reported Multiple Myeloma Drug Pipeline Overview by Phase (Number), 2015 Figure 2-29: Discontinued Multiple Myeloma Drug Pipeline Overview by Phase (%), 2015 Figure 2-30: Discontinued Multiple Myeloma Drug Pipeline Overview by Phase (Number), 2015 Figure 2-31: Multiple Blood Cancer Drug Pipeline Overview by Phase (%), 2015 Figure 2-32: Multiple Blood Cancer Drug Pipeline Overview by Phase (Number), 2015 Figure 2-33: No Development Reported Multiple Blood Cancer Drug Pipeline Overview by Phase (%), 2015 Figure 2-34: No Development Reported Multiple Blood Cancer Drug Pipeline Overview by Phase (Number), 2015 Figure 2-35: Discontinued Multiple Blood Cancer Drug Pipeline Overview by Phase (%), 2015 Figure 2-36: Discontinued Multiple Blood Cancer Drug Pipeline Overview by Phase (Number), 2015 Figure 2-37: Suspended Multiple Blood Cancer Drug Pipeline Overview by Phase (%), 2015 Figure 2-38: Suspended Multiple Blood Cancer Drug Pipeline Overview by Phase (Number), 2015 Figure 3-1: US Blood Cancer Drug Market Favorable Parameters Figure 3-2: US Blood Cancer Drug Market Commercialization Challenges
- 13. US Blood Cancer Drug Market & Pipeline Analysis 2015 For Sample Contact: neeraj@kuickresearch.com , +91-11-47067990 Page 13 Figure 5-1: Mechanism of Idelalisib Figure 5-2: Mechanism of Imatinib Figure 5-3: Mechanism of Rituximab Figure 5-4: Mechanism of Doxorubicin Figure 5-5: Mechanism of Carfilzomib Figure 14-1: Actelion Pharmaceuticals Clinical Pipeline Figure 14-2: Amgen Clinical Pipeline Figure 14-3: ARIAD Clinical Pipeline Figure 14-4: Casi Pharmaceutical Clinical Pipeline Figure 14-5: Celgene Clinical Pipeline Figure 14-6: Gilead Sciences Clinical Pipeline Figure 14-7: GalaxoSmithKline Clinical Pipeline Figure 14-8: Millennium Pharmaceuticals Clinical Pipeline Figure 14-9: Novartis Clinical Pipeline Figure 14-10: Onxeo SA Clinical Pipeline Figure 14-11: Roche Clinical Pipeline Figure 14-12: Tekmira Clinical Pipeline For Report Sample Contact: neeraj@kuickresearch.com
- 14. US Blood Cancer Drug Market & Pipeline Analysis 2015 For Sample Contact: neeraj@kuickresearch.com , +91-11-47067990 Page 14