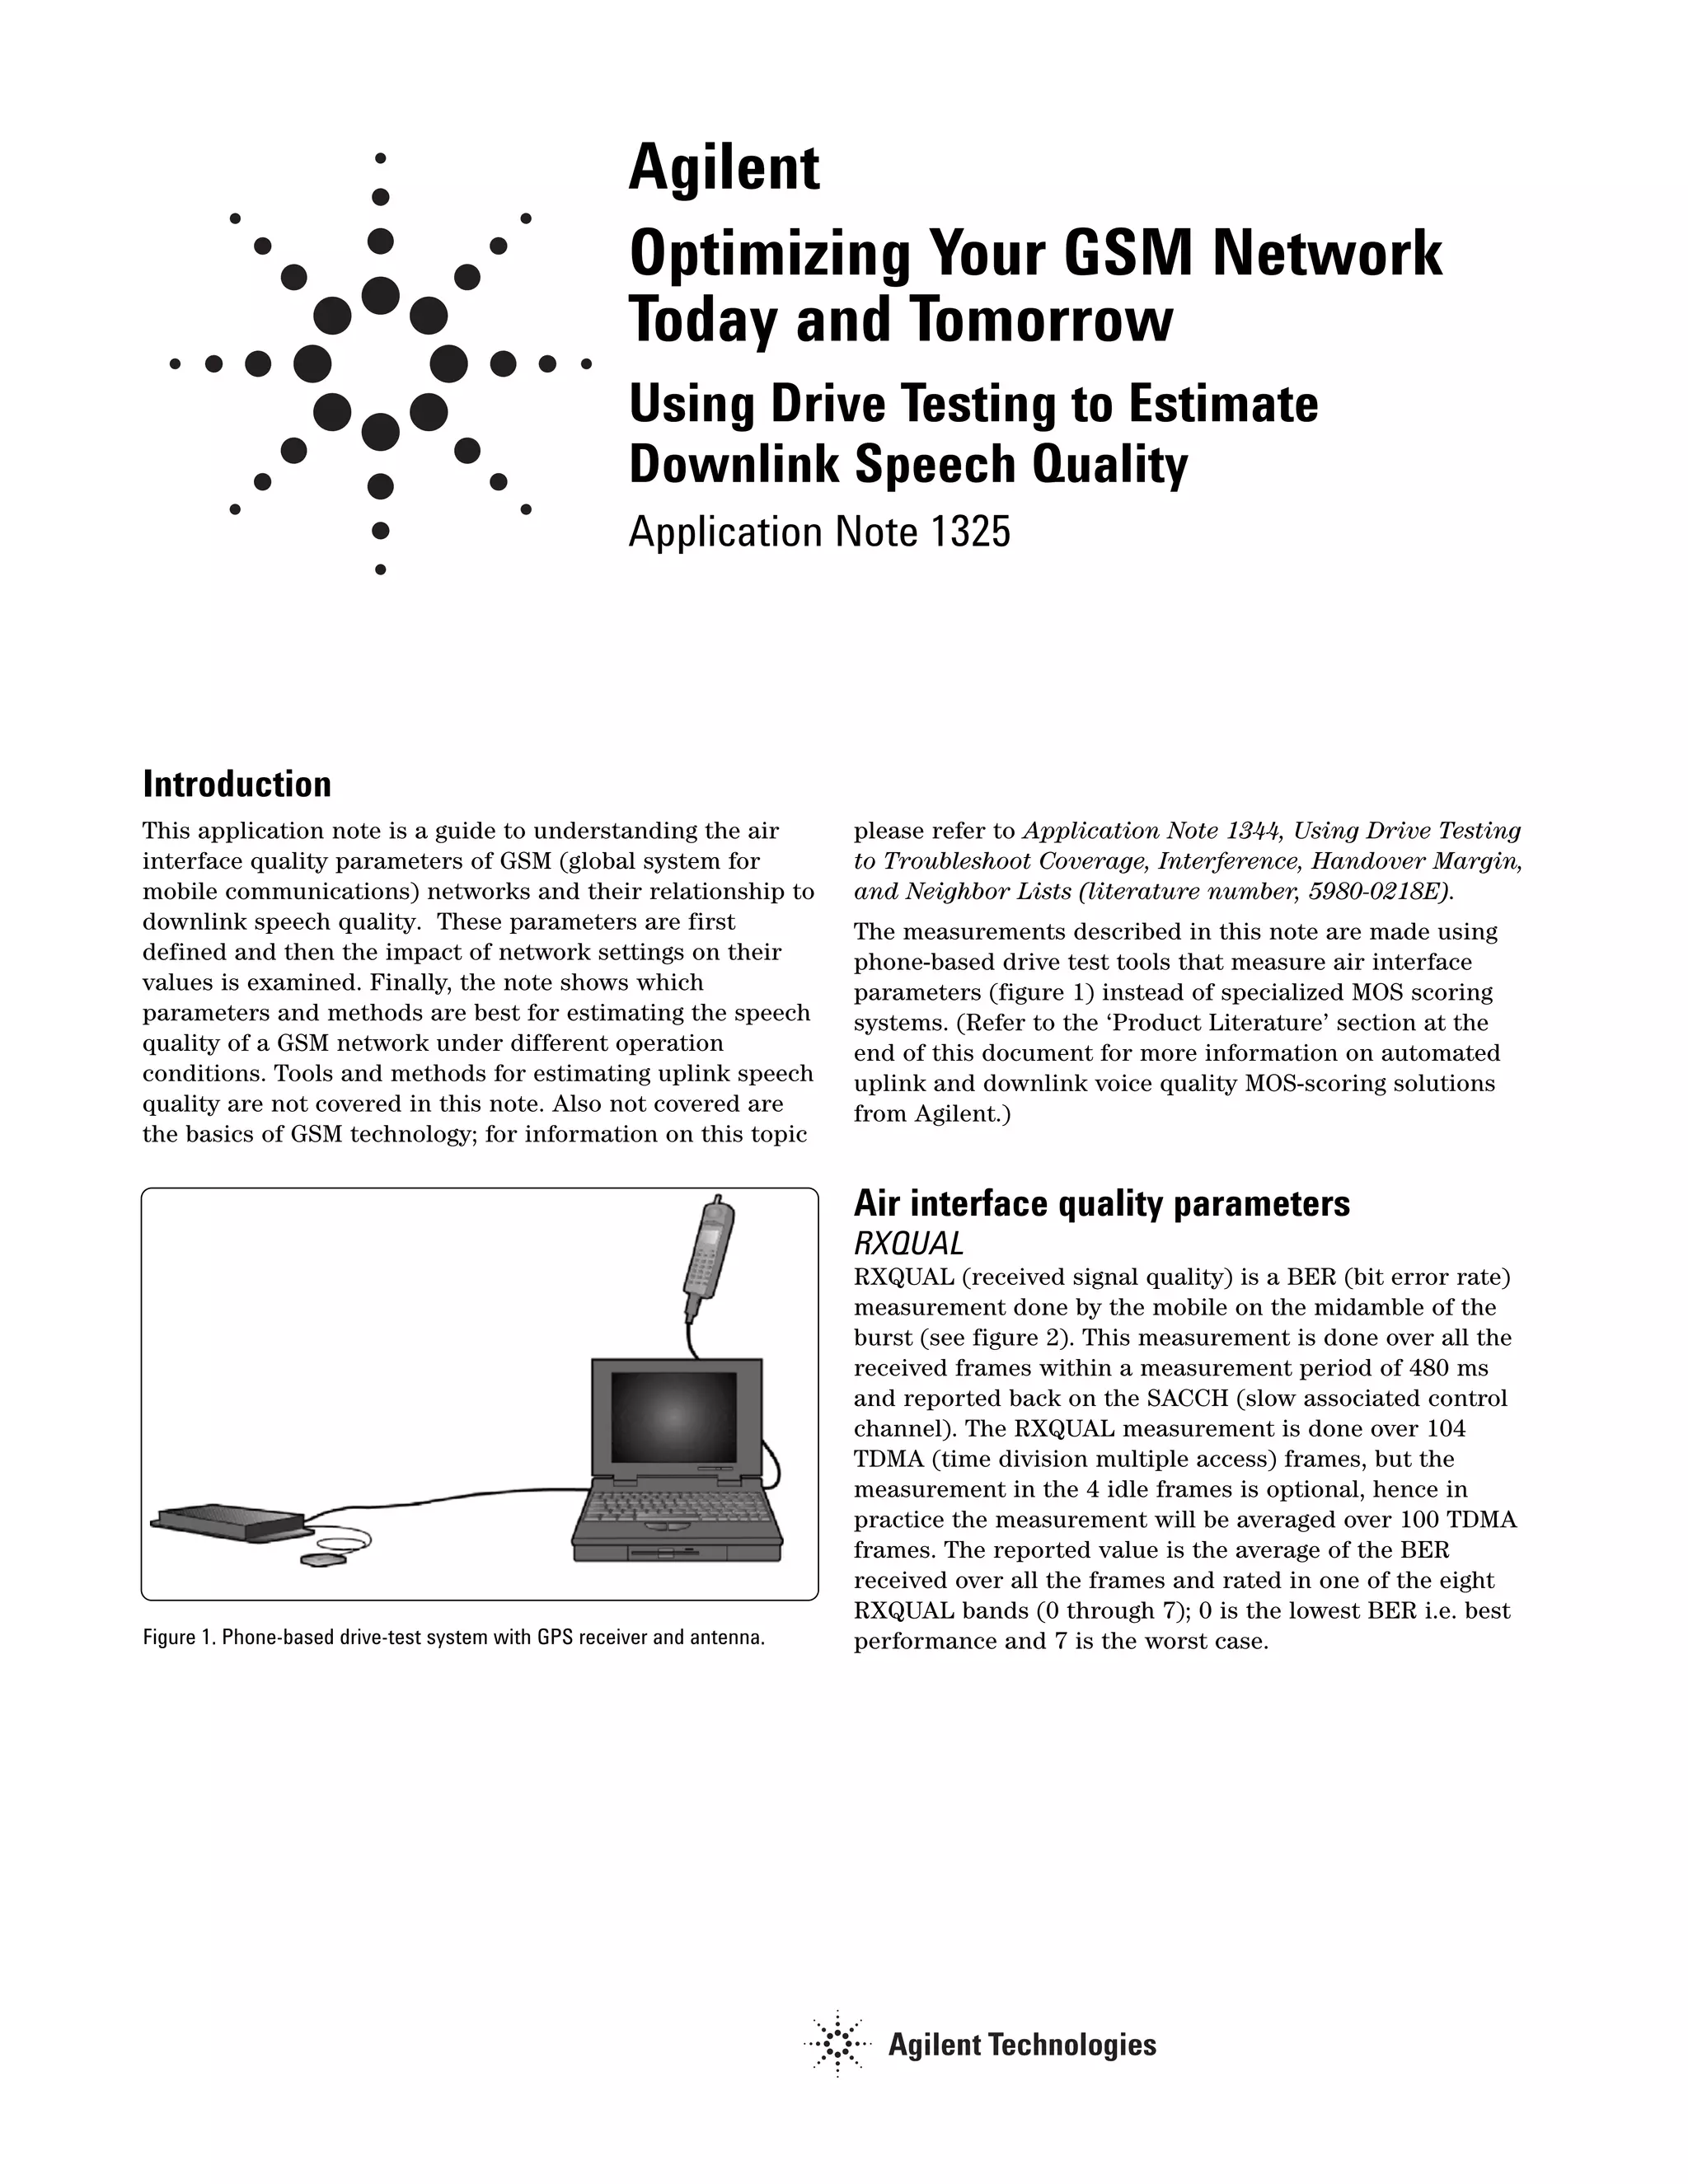
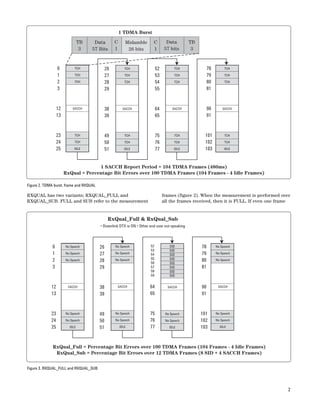
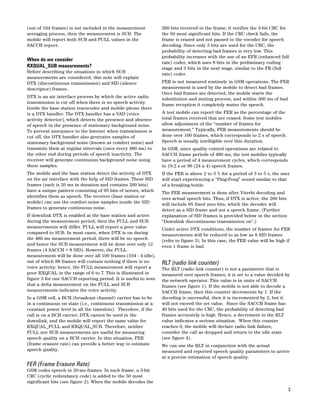
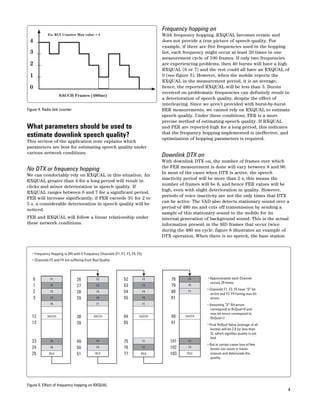
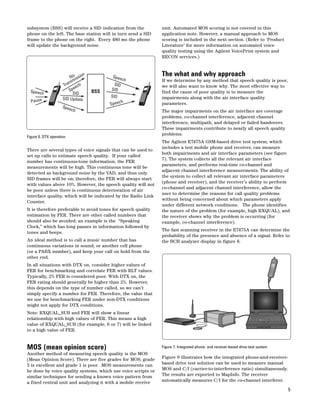
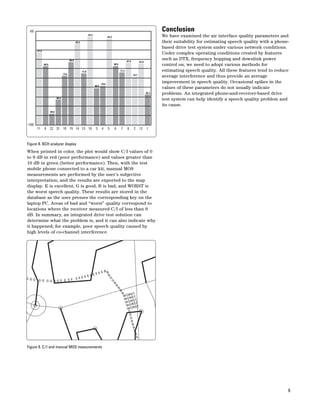
Agilent 
Optimizing Your GSM Network 
Today and Tomorrow 
Using Drive Testing to Estimate 
Downlink Speech Quality 
Application Note 1325 
Introduction 
This application note is a guide to understanding the air 
interface quality parameters of GSM (global system for 
mobile communications) networks and their relationship to 
downlink speech quality. These parameters are first 
defined and then the impact of network settings on their 
values is examined. Finally, the note shows which 
parameters and methods are best for estimating the speech 
quality of a GSM network under different operation 
conditions. Tools and methods for estimating uplink speech 
quality are not covered in this note. Also not covered are 
the basics of GSM technology; for information on this topic 
please refer to Application Note 1344, Using Drive Testing 
to Troubleshoot Coverage, Interference, Handover Margin, 
and Neighbor Lists (literature number, 5980-0218E). 
The measurements described in this note are made using 
phone-based drive test tools that measure air interface 
parameters (figure 1) instead of specialized MOS scoring 
systems. (Refer to the ‘Product Literature’ section at the 
end of this document for more information on automated 
uplink and downlink voice quality MOS-scoring solutions 
from Agilent.) 
Air interface quality parameters 
RXQUAL 
RXQUAL (received signal quality) is a BER (bit error rate) 
measurement done by the mobile on the midamble of the 
burst (see figure 2). This measurement is done over all the 
received frames within a measurement period of 480 ms 
and reported back on the SACCH (slow associated control 
channel). The RXQUAL measurement is done over 104 
TDMA (time division multiple access) frames, but the 
measurement in the 4 idle frames is optional, hence in 
practice the measurement will be averaged over 100 TDMA 
frames. The reported value is the average of the BER 
received over all the frames and rated in one of the eight 
RXQUAL bands (0 through 7); 0 is the lowest BER i.e. best 
performance and 7 is the worst case. 
Figure 1. Phone-based drive-test system with GPS receiver and antenna.
2 
1 SACCH Report Period = 104 TDMA Frames (480ms) 
RxQual = Percentage Bit Errors over 100 TDMA Frames (104 Frames - 4 Idle Frames) 
Figure 2. TDMA burst, frame and RXQUAL 
RXQUAL has two variants; RXQUAL_FULL and 
RXQUAL_SUB. FULL and SUB refer to the measurement 
frames (figure 2). When the measurement is performed over 
all the frames received, then it is FULL. If even one frame 
0 
1 
2 
3 
12 
13 
23 
24 
25 
26 
27 
28 
29 
38 
39 
49 
50 
51 
52 
53 
54 
55 
64 
65 
75 
76 
77 
78 
79 
80 
81 
90 
91 
101 
102 
103 
1 TDMA Burst 
Midamble 
26 bits 
TB 
3 
Data 
57 Bits 
C 
1 
C 
1 
Data 
57 bits 
TB 
3 
TCH 
TCH 
TCH 
SACCH 
TCH 
TCH 
IDLE 
TCH 
TCH 
TCH 
SACCH 
TCH 
TCH 
IDLE 
TCH 
TCH 
TCH 
SACCH 
TCH 
TCH 
IDLE 
TCH 
TCH 
TCH 
SACCH 
TCH 
TCH 
IDLE 
0 
1 
2 
3 
12 
13 
23 
24 
25 
• Downlink DTX is ON • Other end user not speaking 
26 
27 
28 
29 
38 
39 
49 
50 
51 
RxQual_Full & RxQual_Sub 
52 
53 
54 
55 
56 
57 
58 
59 
64 
65 
75 
76 
77 
78 
79 
80 
81 
90 
91 
101 
102 
103 
No Speech 
No Speech 
No Speech 
SACCH 
No Speech 
No Speech 
IDLE 
No Speech 
No Speech 
No Speech 
SACCH 
No Speech 
No Speech 
IDLE 
SID 
SID 
SID 
SID 
SID 
SID 
SID 
SID 
SACCH 
No Speech 
No Speech 
IDLE 
No Speech 
No Speech 
No Speech 
SACCH 
No Speech 
No Speech 
IDLE 
RxQual_Full = Percentage Bit Errors over 100 TDMA Frames (104 Frames - 4 Idle Frames) 
RxQual_Sub = Percentage Bit Errors over 12 TDMA Frames (8 SID + 4 SACCH Frames) 
Figure 3. RXQUAL_FULL and RXQUAL_SUB
3 
(out of 104 frames) is not included in the measurement 
averaging process, then the measurement is SUB. The 
mobile will report both SUB and FULL values in the 
SACCH report. 
When do we consider 
RXQUAL_SUB measurements? 
Before describing the situations in which SUB 
measurements are considered, this note will explain 
DTX (discontinuous transmission) and SID (silence 
descriptor) frames. 
DTX is an air interface process by which the active radio 
transmission is cut off when there is no speech activity. 
Inside the base station transcoder and mobile phone there 
is a DTX handler. The DTX handler has a VAD (voice 
activity detector), which detects the presence and absence 
of speech in the presence of stationary background noise. 
To prevent annoyance to the listener when transmission is 
cut off, the DTX handler also generates samples of 
stationary background noise (known as comfort noise) and 
transmits them at regular intervals (once every 480 ms) to 
the other end during periods of speech inactivity. The 
receiver will generate continuous background noise using 
these samples. 
The mobile and the base station detect the activity of DTX 
on the air interface with the help of SID frames. These SID 
frames (each is 20 ms in duration and contains 260 bits) 
have a unique pattern consisting of 95 bits of zeroes, which 
identifies them as speech. The receiver (base station or 
mobile) can use the comfort noise samples inside the SID 
frames to generate continuous noise. 
If downlink DTX is enabled at the base station and active 
during the measurement period, then the FULL and SUB 
measurements will differ. FULL will report a poor value 
compared to SUB. In most cases, when DTX is on during 
the 480 ms measurement period, there will be no speech 
and hence the SUB measurement will be done over only 12 
frames (4 SACCH + 8 SID). However, the FULL 
measurement will be done over all 100 frames (104 - 4 idle), 
out of which 88 frames will contain nothing if there is no 
voice activity; hence, the FULL measurement will report a 
poor RXQUAL in the range of 6 to 7. This is illustrated in 
figure 3 for one SACCH reporting period. It is useful to note 
that a delta measurement on the FULL and SUB 
measurements indicates the voice activity. 
In a GSM cell, a BCH (broadcast channel) carrier has to be 
in a continuous on state (i.e., continuous transmission at a 
constant power level in all the timeslots). Therefore, if the 
call is on a BCH carrier, DTX cannot be used in the 
downlink, and the mobile will report the same value for 
RXQUAL_FULL and RXQUAL_SUB. Therefore, neither 
FULL nor SUB measurements are useful for measuring 
speech quality on a BCH carrier. In this situation, FER 
(frame erasure rate) can provide a better way to estimate 
speech quality. 
FER (Frame Erasure Rate) 
GSM codes speech in 20-ms frames. In each frame, a 3-bit 
CRC (cyclic redundancy code) is added to the 50 most 
significant bits (see figure 2). When the mobile decodes the 
260 bits received in the frame, it verifies the 3-bit CRC for 
the 50 most significant bits. If the CRC check fails, the 
frame is erased and not passed to the vocoder for speech 
decoding. Since only 3 bits are used for the CRC, the 
probability of detecting bad frames is very low. This 
probability increases with the use of an EFR (enhanced full 
rate) coder, which uses 8 bits in the preliminary coding 
stage and 3 bits in the next stage, similar to the FR (full 
rate) coder. 
FER is not measured routinely in GSM operations. The FER 
measurement is used by the mobile to detect bad frames. 
Once bad frames are detected, the mobile starts the 
substitution and muting process, and within 300 ms of bad 
frame reception it completely mutes the speech. 
A test mobile can report the FER as the percentage of the 
total frames received that are erased. Some test mobiles 
allow adjustment of the “number of frames for 
measurement.” Typically, FER measurements should be 
done over 100 frames, which corresponds to 2 s of speech. 
Speech is usually intelligible over this duration. 
In GSM, since quality control operations are related to 
SACCH frame periods of 480 ms, the test mobiles typically 
have a period of 4 measurement cycles, which corresponds 
to 19.2 s or 96 (24 x 4) speech frames. 
If the FER is above 2 to 3 % for a period of 3 to 5 s, the user 
will start experiencing a “Ping-Pong” sound similar to that 
of a breaking bottle. 
The FER measurement is done after Viterbi decoding and 
over actual speech bits. Thus, if DTX is active, the 260 bits 
will include 95 fixed zero bits, which the decoder will 
detect as a SID frame and not a speech frame. (Further 
explanation of SID frames is provided below in the section 
“Downlink discontinuous transmission on”.) 
Under active DTX conditions, the number of frames for FER 
measurements will be reduced to as low as 8 SID frames 
(refer to figure 3). In this case, the FER value will be high if 
even 1 frame is bad. 
RLT (radio link counter) 
The RLT (radio link counter) is not a parameter that is 
measured over speech frames; it is set to a value decided by 
the network operator. This value is in units of SACCH 
frames (see figure 1). If the mobile is not able to decode a 
SACCH frame, then this counter decrements by 1. If the 
decoding is successful, then it is incremented by 2, but it 
will not exceed the set value. Since the SACCH frame has 
40 bits used for the CRC, the probability of detecting bad 
frames accurately is high. Hence, a decrement in the RLT 
value indicates a serious situation. When this counter 
reaches 0, the mobile will declare radio link failure, 
consider the call as dropped and return to the idle state 
(see figure 4). 
We can use the RLT in conjunction with the actual 
measured and reported speech quality parameters to arrive 
at a precise estimation of speech quality.
4 
Figure 4. Radio link counter 
What parameters should be used to 
estimate downlink speech quality? 
This section of the application note explains which 
parameters are best for estimating speech quality under 
various network conditions. 
No DTX or frequency hopping 
We can comfortably rely on RXQUAL in this situation. An 
RXQUAL greater than 4 for a long period will result in 
clicks and minor deterioration in speech quality. If 
RXQUAL ranges between 6 and 7 for a significant period, 
FER will increase significantly; if FER exceeds 3% for 2 to 
5 s, a considerable deterioration in speech quality will be 
noticed. 
FER and RXQUAL will follow a linear relationship under 
these network conditions. 
Frequency hopping on 
With frequency hopping, RXQUAL becomes erratic and 
does not provide a true picture of speech quality. For 
example, if there are five frequencies used in the hopping 
list, each frequency might occur at least 20 times in one 
measurement cycle of 100 frames. If only two frequencies 
are experiencing problems, then 40 bursts will have a high 
RXQUAL (6 or 7) and the rest could all have an RXQUAL of 
0 (see figure 5). However, when the mobile reports the 
RXQUAL in the measurement period, it is an average; 
hence, the reported RXQUAL will be less than 3. Bursts 
received on problematic frequencies can definitely result in 
a deterioration of speech quality, despite the effect of 
interleaving. Since we aren’t provided with burst-by-burst 
BER measurements, we cannot rely on RXQUAL to estimate 
speech quality. Under these conditions, FER is a more 
precise method of estimating speech quality. If RXQUAL 
and FER are reported high for a long period, this indicates 
that the frequency hopping implemented is ineffective, and 
optimization of hopping parameters is required. 
Downlink DTX on 
With downlink DTX on, the number of frames over which 
the FER measurement is done will vary between 8 and 96. 
In most of the cases when DTX is active, the speech 
inactivity period will be more than 2 s; this means the 
number of frames will be 8, and hence FER values will be 
high, even with slight deterioration in quality. However, 
periods of voice inactivity are not the only times that DTX 
can be active. The VAD also detects stationary sound over a 
period of 480 ms and cuts off transmission by sending a 
sample of this stationary sound to the mobile for its 
internal generation of background sound. This is the actual 
information present in the SID frames that occur twice 
during the 480 ms cycle. figure 6 illustrates an example of 
DTX operation. When there is no speech, the base station 
• Approximately each Channel 
occurs 20 times. 
• Channels F1, F3, F5 have "0" bit 
errors and F2, F4 having max bit 
errors. 
• Assuming "0" Bit errors 
correspond to RxQual=0 and 
max bit errors correspond to 
RxQual=7. 
• Final RxQual Value (average of all 
bursts) will be 2.8 (or less than 
3), which signifies quality is not 
bad. 
• But in certain cases loss of few 
bursts can result in frame 
erasure and deteriorate the 
quality. 
• Frequency Hopping is ON with 5 Frequency Channels (F1, F2, F3, F4, F5) 
• Channels F2 and F4 are suffering from Bad Quality 
0 
1 
2 
3 
12 
13 
23 
24 
25 
26 
27 
28 
29 
38 
39 
49 
50 
51 
78 
79 
80 
81 
90 
91 
101 
102 
103 
F1 
F2 
F3 
F4 
F5 
SACCH 
F4 
F5 
IDLE 
F2 
F3 
F4 
F5 
F1 
SACCH 
F4 
F5 
IDLE 
52 
53 
54 
55 
64 
65 
75 
76 
77 
F2 
F3 
F4 
F5 
F1 
SACCH 
F1 
F2 
IDLE 
F4 
F5 
F1 
SACCH 
F2 
F3 
IDLE 
Figure 5. Effect of frequency hopping on RXQUAL
5 
subsystem (BSS) will receive a SID indication from the 
phone on the left. The base station will in turn send a SID 
frame to the phone on the right. Every 480 ms the phone 
will update the background noise. 
No 
Transmission 
Pause SpeechSID 
SID Update 
Figure 6. DTX operation 
There are several types of voice signals that can be used to 
set up calls to estimate speech quality. If your called 
number has continuous-tone information, the FER 
measurements will be high. This continuous tone will be 
detected as background noise by the VAD, and thus only 
SID frames will be on; therefore, the FER will always start 
with values above 10%. However, the speech quality will not 
be poor unless there is continuous deterioration of air 
interface quality, which will be indicated by the Radio Link 
Counter. 
It is therefore preferable to avoid tones for speech quality 
estimation by FER. There are other called numbers that 
should also be avoided; an example is the “Speaking 
Clock,” which has long pauses in information followed by 
tones and beeps. 
An ideal method is to call a music number that has 
continuous variations in sound, or another cell phone 
(or a PABX number), and keep your call on hold from the 
other end. 
In all situations with DTX on, consider higher values of 
FER for benchmarking and correlate FER with RLT values. 
Typically, 2% FER is considered poor. With DTX on, the 
FER rating should generally be higher than 2%. However, 
this depends on the type of number called, so we can’t 
simply specify a number for FER. Therefore, the value that 
we use for benchmarking FER under non-DTX conditions 
might not apply for DTX conditions. 
Note: RXQUAL_SUB and FER will show a linear 
relationship with high values of FER. This means a high 
value of RXQUAL_SUB (for example, 6 or 7) will be linked 
to a high value of FER. 
MOS (mean opinion score) 
Another method of measuring speech quality is the MOS 
(Mean Opinion Score). There are five grades for MOS; grade 
5 is excellent and grade 1 is poor. MOS measurements can 
be done by voice quality systems, which use voice scripts or 
similar techniques for sending a known voice pattern from 
a fixed central unit and analyzing it with a mobile receive 
unit. Automated MOS scoring is not covered in this 
application note. However, a manual approach to MOS 
scoring is included in the next section. (Refer to ‘Product 
Literature’ for more information on automated voice 
quality testing using the Agilent VoicePrint system and 
RECON services.) 
The what and why approach 
If we determine by any method that speech quality is poor, 
we will also want to know why. The most effective way to 
find the cause of poor quality is to measure the 
impairments along with the air interface quality 
parameters. 
The major impairments on the air interface are coverage 
problems, co-channel interference, adjacent channel 
interference, multipath, and delayed or failed handovers. 
These impairments contribute to nearly all speech quality 
problems. 
The Agilent E7475A GSM-based drive test system, which 
includes a test mobile phone and receiver, can measure 
both impairments and air interface parameters (see figure 
7). The system collects all the relevant air interface 
parameters, and performs real-time co-channel and 
adjacent channel interference measurements. The ability of 
the system to collect all relevant air interface parameters 
(phone and receiver), and the receiver’s ability to perform 
co-channel and adjacent channel interference, allow the 
user to determine the reasons for call quality problems 
without being concerned about which parameters apply 
under different network conditions. The phone identifies 
the nature of the problem (for example, high RXQUAL), and 
the receiver shows why the problem is occurring (for 
example, co-channel interference). 
The fast scanning receiver in the E7475A can determine the 
probability of the presence and absence of a signal. Refer to 
the BCH analyzer display in figure 8. 
Figure 7. Integrated phone- and receiver-based drive-test system 
Figure 9 illustrates how the integrated phone-and-receiver-based 
drive test solution can be used to measure manual 
MOS and C/I (carrier-to-interference ratio) simultaneously. 
The results are exported to MapInfo. The receiver 
automatically measures C/I for the co-channel interferer. 
BSS SID 
SID 
Speech 
Speech 
SID 
Speech 
Speech
6 
Figure 8. BCH analyzer display 
When printed in color, the plot would show C/I values of 0 
to 9 dB in red (poor performance) and values greater than 
10 dB in green (better performance). Then, with the test 
mobile phone connected to a car kit, manual MOS 
measurements are performed by the user’s subjective 
interpretation, and the results are exported to the map 
display. E is excellent, G is good, B is bad, and WORST is 
the worst speech quality. These results are stored in the 
database as the user presses the corresponding key on the 
laptop PC. Areas of bad and “worst” quality correspond to 
locations where the receiver measured C/I of less than 9 
dB. In summary, an integrated drive test solution can 
determine what the problem is, and it can also indicate why 
it happened; for example, poor speech quality caused by 
high levels of co-channel interference. 
Figure 9. C/I and manual MOS measurements 
Conclusion 
We have examined the air interface quality parameters and 
their suitability for estimating speech quality with a phone-based 
drive test system under various network conditions. 
Under complex operating conditions created by features 
such as DTX, frequency hopping and downlink power 
control on, we need to adopt various methods for 
estimating speech quality. All these features tend to reduce 
average interference and thus provide an average 
improvement in speech quality. Occasional spikes in the 
values of these parameters do not usually indicate 
problems. An integrated phone-and-receiver-based drive 
test system can help identify a speech quality problem and 
its cause. 
G G G G G G G G G E E E E E E E E E E E E E E BB 
B 
G 
G 
B 
B 
B 
B 
B 
WORST 
WORST 
WORST 
WORST 
WORST 
G 
G 
G 
B 
B 
B 
B 
B 
E 
-61.0 
-68.9 
-94.6 
-85.9 
-73.5 
-66.8 
-56.5 
-71.8 
-53.2 
-80.4 
-79.6 
-54.3 
-68.5 
-71.3 
-67.4 
-74.7 
-67.6 
-83.2 
-50 
-100 
11 9 22 31 16 15 14 13 10 3 4 5 6 7 8 2 12 1
7 
Acronyms 
DTX discontinous transmission 
EFR enhanced full rate 
FER frame erasure rate 
FR full rate 
GSM global system for mobile communications 
MOS mean opinion score 
PABX private automatic branch eXchange 
RLT radio link counter 
RXQUAL receive quality 
RXQUAL_FULL receive quality over full 104 TDMA frames 
RXQUAL_SUB receive quality over subset of 104 TDMA frames 
SACCH slow associated control channel 
SID silence descriptor 
TDMA time division multiple access 
VAD voice activity detector 
Product literature 
1. GSM Drive-Test System Technical Specifications, Agilent literature number 5968-5564E 
2. GSM Drive-Test System Configuration Guide, Agilent literature number 5968-5563E 
3. GSM Drive-Test brochure, Agilent literature number 5968-5562E 
4. Indoor Wireless Measurement System Product Overview, Agilent literature number 5968-8691E 
5. GSM Application Note 1344: Using Drive-Testing to Troubleshoot Coverage, Interference, Handover Margin and 
Neighbor Lists, Agilent literature number 5980-0218E 
6. Product Overview: Agilent Portable VoicePrint System, Agilent Literature Number 5988-0248EN 
7. Product Overview: Agilent RECON Wireless Market Reports, Agilent Literature Number 5988-0250EN
8 
Agilent Technologies’ Test and Measurement 
Support, Services, and Assistance 
Agilent Technologies aims to maximize the value you receive, while 
minimizing your risk and problems. We strive to ensure that you get 
the test and measurement capabilities you paid for and obtain the 
support you need. Our extensive support resources and services can 
help you choose the right Agilent products for your applications and 
apply them successfully. Every instrument and system we sell has a 
global warranty. Support is available for at least five years beyond 
the production life of the product. Two concepts underlay Agilent's 
overall support policy: “Our Promise” and “Your Advantage.” 
Our Promise 
Our Promise means your Agilent test and measurement equipment 
will meet its advertised performance and functionality. When you are 
choosing new equipment, we will help you with product information, 
including realistic performance specifications and practical 
recommendations from experienced test engineers. When you use 
Agilent equipment, we can verify that it works properly, help with 
product operation, and provide basic measurement assistance for 
the use of specified capabilities, at no extra cost upon request. Many 
self-help tools are available. 
Your Advantage 
Your Advantage means that Agilent offers a wide range of additional 
expert test and measurement services, which you can purchase 
according to your unique technical and business needs. Solve 
problems efficiently and gain a competitive edge by contacting us for 
calibration, extra-cost upgrades, out-of-warranty repairs, and on-site 
education and training, as well as design, system integration, project 
management, and other professional services. Experienced Agilent 
engineers and technicians worldwide can help you maximize your 
productivity, optimize the return on investment of your Agilent 
instruments and systems, and obtain dependable measurement 
accuracy for the life of those products. 
By internet, phone, or fax, get assistance with all your test & 
measurement needs 
Online assistance: 
www.agilent.com/find/assist 
Phone or Fax 
United States: 
(tel) 1 800 452 4844 
Canada: 
(tel) 1 877 894 4414 
(fax) (905) 282-6495 
China: 
(tel) 800-810-0189 
(fax) 1-0800-650-0121 
Europe: 
(tel) (31 20) 547 2323 
(fax) (31 20) 547 2390 
Japan: 
(tel) (81) 426 56 7832 
(fax) (81) 426 56 7840 
Korea: 
(tel) (82-2) 2004-5004 
(fax) (82-2) 2004-5115 
Latin America: 
(tel) (305) 269 7500 
(fax) (305) 269 7599 
Taiwan: 
(tel) 080-004-7866 
(fax) (886-2) 2545-6723 
Other Asia Pacific Countries: 
(tel) (65) 375-8100 
(fax) (65) 836-0252 
Email: tm_asia@agilent.com 
Product specifications and descriptions in this document subject to 
change without notice. 
Copyright © 2001 Agilent Technologies 
Printed in USA July 1, 2001 
5980-2828EN

Downlink speech quality

  • 1.
    Agilent Optimizing YourGSM Network Today and Tomorrow Using Drive Testing to Estimate Downlink Speech Quality Application Note 1325 Introduction This application note is a guide to understanding the air interface quality parameters of GSM (global system for mobile communications) networks and their relationship to downlink speech quality. These parameters are first defined and then the impact of network settings on their values is examined. Finally, the note shows which parameters and methods are best for estimating the speech quality of a GSM network under different operation conditions. Tools and methods for estimating uplink speech quality are not covered in this note. Also not covered are the basics of GSM technology; for information on this topic please refer to Application Note 1344, Using Drive Testing to Troubleshoot Coverage, Interference, Handover Margin, and Neighbor Lists (literature number, 5980-0218E). The measurements described in this note are made using phone-based drive test tools that measure air interface parameters (figure 1) instead of specialized MOS scoring systems. (Refer to the ‘Product Literature’ section at the end of this document for more information on automated uplink and downlink voice quality MOS-scoring solutions from Agilent.) Air interface quality parameters RXQUAL RXQUAL (received signal quality) is a BER (bit error rate) measurement done by the mobile on the midamble of the burst (see figure 2). This measurement is done over all the received frames within a measurement period of 480 ms and reported back on the SACCH (slow associated control channel). The RXQUAL measurement is done over 104 TDMA (time division multiple access) frames, but the measurement in the 4 idle frames is optional, hence in practice the measurement will be averaged over 100 TDMA frames. The reported value is the average of the BER received over all the frames and rated in one of the eight RXQUAL bands (0 through 7); 0 is the lowest BER i.e. best performance and 7 is the worst case. Figure 1. Phone-based drive-test system with GPS receiver and antenna.
  • 2.
    2 1 SACCHReport Period = 104 TDMA Frames (480ms) RxQual = Percentage Bit Errors over 100 TDMA Frames (104 Frames - 4 Idle Frames) Figure 2. TDMA burst, frame and RXQUAL RXQUAL has two variants; RXQUAL_FULL and RXQUAL_SUB. FULL and SUB refer to the measurement frames (figure 2). When the measurement is performed over all the frames received, then it is FULL. If even one frame 0 1 2 3 12 13 23 24 25 26 27 28 29 38 39 49 50 51 52 53 54 55 64 65 75 76 77 78 79 80 81 90 91 101 102 103 1 TDMA Burst Midamble 26 bits TB 3 Data 57 Bits C 1 C 1 Data 57 bits TB 3 TCH TCH TCH SACCH TCH TCH IDLE TCH TCH TCH SACCH TCH TCH IDLE TCH TCH TCH SACCH TCH TCH IDLE TCH TCH TCH SACCH TCH TCH IDLE 0 1 2 3 12 13 23 24 25 • Downlink DTX is ON • Other end user not speaking 26 27 28 29 38 39 49 50 51 RxQual_Full & RxQual_Sub 52 53 54 55 56 57 58 59 64 65 75 76 77 78 79 80 81 90 91 101 102 103 No Speech No Speech No Speech SACCH No Speech No Speech IDLE No Speech No Speech No Speech SACCH No Speech No Speech IDLE SID SID SID SID SID SID SID SID SACCH No Speech No Speech IDLE No Speech No Speech No Speech SACCH No Speech No Speech IDLE RxQual_Full = Percentage Bit Errors over 100 TDMA Frames (104 Frames - 4 Idle Frames) RxQual_Sub = Percentage Bit Errors over 12 TDMA Frames (8 SID + 4 SACCH Frames) Figure 3. RXQUAL_FULL and RXQUAL_SUB
  • 3.
    3 (out of104 frames) is not included in the measurement averaging process, then the measurement is SUB. The mobile will report both SUB and FULL values in the SACCH report. When do we consider RXQUAL_SUB measurements? Before describing the situations in which SUB measurements are considered, this note will explain DTX (discontinuous transmission) and SID (silence descriptor) frames. DTX is an air interface process by which the active radio transmission is cut off when there is no speech activity. Inside the base station transcoder and mobile phone there is a DTX handler. The DTX handler has a VAD (voice activity detector), which detects the presence and absence of speech in the presence of stationary background noise. To prevent annoyance to the listener when transmission is cut off, the DTX handler also generates samples of stationary background noise (known as comfort noise) and transmits them at regular intervals (once every 480 ms) to the other end during periods of speech inactivity. The receiver will generate continuous background noise using these samples. The mobile and the base station detect the activity of DTX on the air interface with the help of SID frames. These SID frames (each is 20 ms in duration and contains 260 bits) have a unique pattern consisting of 95 bits of zeroes, which identifies them as speech. The receiver (base station or mobile) can use the comfort noise samples inside the SID frames to generate continuous noise. If downlink DTX is enabled at the base station and active during the measurement period, then the FULL and SUB measurements will differ. FULL will report a poor value compared to SUB. In most cases, when DTX is on during the 480 ms measurement period, there will be no speech and hence the SUB measurement will be done over only 12 frames (4 SACCH + 8 SID). However, the FULL measurement will be done over all 100 frames (104 - 4 idle), out of which 88 frames will contain nothing if there is no voice activity; hence, the FULL measurement will report a poor RXQUAL in the range of 6 to 7. This is illustrated in figure 3 for one SACCH reporting period. It is useful to note that a delta measurement on the FULL and SUB measurements indicates the voice activity. In a GSM cell, a BCH (broadcast channel) carrier has to be in a continuous on state (i.e., continuous transmission at a constant power level in all the timeslots). Therefore, if the call is on a BCH carrier, DTX cannot be used in the downlink, and the mobile will report the same value for RXQUAL_FULL and RXQUAL_SUB. Therefore, neither FULL nor SUB measurements are useful for measuring speech quality on a BCH carrier. In this situation, FER (frame erasure rate) can provide a better way to estimate speech quality. FER (Frame Erasure Rate) GSM codes speech in 20-ms frames. In each frame, a 3-bit CRC (cyclic redundancy code) is added to the 50 most significant bits (see figure 2). When the mobile decodes the 260 bits received in the frame, it verifies the 3-bit CRC for the 50 most significant bits. If the CRC check fails, the frame is erased and not passed to the vocoder for speech decoding. Since only 3 bits are used for the CRC, the probability of detecting bad frames is very low. This probability increases with the use of an EFR (enhanced full rate) coder, which uses 8 bits in the preliminary coding stage and 3 bits in the next stage, similar to the FR (full rate) coder. FER is not measured routinely in GSM operations. The FER measurement is used by the mobile to detect bad frames. Once bad frames are detected, the mobile starts the substitution and muting process, and within 300 ms of bad frame reception it completely mutes the speech. A test mobile can report the FER as the percentage of the total frames received that are erased. Some test mobiles allow adjustment of the “number of frames for measurement.” Typically, FER measurements should be done over 100 frames, which corresponds to 2 s of speech. Speech is usually intelligible over this duration. In GSM, since quality control operations are related to SACCH frame periods of 480 ms, the test mobiles typically have a period of 4 measurement cycles, which corresponds to 19.2 s or 96 (24 x 4) speech frames. If the FER is above 2 to 3 % for a period of 3 to 5 s, the user will start experiencing a “Ping-Pong” sound similar to that of a breaking bottle. The FER measurement is done after Viterbi decoding and over actual speech bits. Thus, if DTX is active, the 260 bits will include 95 fixed zero bits, which the decoder will detect as a SID frame and not a speech frame. (Further explanation of SID frames is provided below in the section “Downlink discontinuous transmission on”.) Under active DTX conditions, the number of frames for FER measurements will be reduced to as low as 8 SID frames (refer to figure 3). In this case, the FER value will be high if even 1 frame is bad. RLT (radio link counter) The RLT (radio link counter) is not a parameter that is measured over speech frames; it is set to a value decided by the network operator. This value is in units of SACCH frames (see figure 1). If the mobile is not able to decode a SACCH frame, then this counter decrements by 1. If the decoding is successful, then it is incremented by 2, but it will not exceed the set value. Since the SACCH frame has 40 bits used for the CRC, the probability of detecting bad frames accurately is high. Hence, a decrement in the RLT value indicates a serious situation. When this counter reaches 0, the mobile will declare radio link failure, consider the call as dropped and return to the idle state (see figure 4). We can use the RLT in conjunction with the actual measured and reported speech quality parameters to arrive at a precise estimation of speech quality.
  • 4.
    4 Figure 4.Radio link counter What parameters should be used to estimate downlink speech quality? This section of the application note explains which parameters are best for estimating speech quality under various network conditions. No DTX or frequency hopping We can comfortably rely on RXQUAL in this situation. An RXQUAL greater than 4 for a long period will result in clicks and minor deterioration in speech quality. If RXQUAL ranges between 6 and 7 for a significant period, FER will increase significantly; if FER exceeds 3% for 2 to 5 s, a considerable deterioration in speech quality will be noticed. FER and RXQUAL will follow a linear relationship under these network conditions. Frequency hopping on With frequency hopping, RXQUAL becomes erratic and does not provide a true picture of speech quality. For example, if there are five frequencies used in the hopping list, each frequency might occur at least 20 times in one measurement cycle of 100 frames. If only two frequencies are experiencing problems, then 40 bursts will have a high RXQUAL (6 or 7) and the rest could all have an RXQUAL of 0 (see figure 5). However, when the mobile reports the RXQUAL in the measurement period, it is an average; hence, the reported RXQUAL will be less than 3. Bursts received on problematic frequencies can definitely result in a deterioration of speech quality, despite the effect of interleaving. Since we aren’t provided with burst-by-burst BER measurements, we cannot rely on RXQUAL to estimate speech quality. Under these conditions, FER is a more precise method of estimating speech quality. If RXQUAL and FER are reported high for a long period, this indicates that the frequency hopping implemented is ineffective, and optimization of hopping parameters is required. Downlink DTX on With downlink DTX on, the number of frames over which the FER measurement is done will vary between 8 and 96. In most of the cases when DTX is active, the speech inactivity period will be more than 2 s; this means the number of frames will be 8, and hence FER values will be high, even with slight deterioration in quality. However, periods of voice inactivity are not the only times that DTX can be active. The VAD also detects stationary sound over a period of 480 ms and cuts off transmission by sending a sample of this stationary sound to the mobile for its internal generation of background sound. This is the actual information present in the SID frames that occur twice during the 480 ms cycle. figure 6 illustrates an example of DTX operation. When there is no speech, the base station • Approximately each Channel occurs 20 times. • Channels F1, F3, F5 have "0" bit errors and F2, F4 having max bit errors. • Assuming "0" Bit errors correspond to RxQual=0 and max bit errors correspond to RxQual=7. • Final RxQual Value (average of all bursts) will be 2.8 (or less than 3), which signifies quality is not bad. • But in certain cases loss of few bursts can result in frame erasure and deteriorate the quality. • Frequency Hopping is ON with 5 Frequency Channels (F1, F2, F3, F4, F5) • Channels F2 and F4 are suffering from Bad Quality 0 1 2 3 12 13 23 24 25 26 27 28 29 38 39 49 50 51 78 79 80 81 90 91 101 102 103 F1 F2 F3 F4 F5 SACCH F4 F5 IDLE F2 F3 F4 F5 F1 SACCH F4 F5 IDLE 52 53 54 55 64 65 75 76 77 F2 F3 F4 F5 F1 SACCH F1 F2 IDLE F4 F5 F1 SACCH F2 F3 IDLE Figure 5. Effect of frequency hopping on RXQUAL
  • 5.
    5 subsystem (BSS)will receive a SID indication from the phone on the left. The base station will in turn send a SID frame to the phone on the right. Every 480 ms the phone will update the background noise. No Transmission Pause SpeechSID SID Update Figure 6. DTX operation There are several types of voice signals that can be used to set up calls to estimate speech quality. If your called number has continuous-tone information, the FER measurements will be high. This continuous tone will be detected as background noise by the VAD, and thus only SID frames will be on; therefore, the FER will always start with values above 10%. However, the speech quality will not be poor unless there is continuous deterioration of air interface quality, which will be indicated by the Radio Link Counter. It is therefore preferable to avoid tones for speech quality estimation by FER. There are other called numbers that should also be avoided; an example is the “Speaking Clock,” which has long pauses in information followed by tones and beeps. An ideal method is to call a music number that has continuous variations in sound, or another cell phone (or a PABX number), and keep your call on hold from the other end. In all situations with DTX on, consider higher values of FER for benchmarking and correlate FER with RLT values. Typically, 2% FER is considered poor. With DTX on, the FER rating should generally be higher than 2%. However, this depends on the type of number called, so we can’t simply specify a number for FER. Therefore, the value that we use for benchmarking FER under non-DTX conditions might not apply for DTX conditions. Note: RXQUAL_SUB and FER will show a linear relationship with high values of FER. This means a high value of RXQUAL_SUB (for example, 6 or 7) will be linked to a high value of FER. MOS (mean opinion score) Another method of measuring speech quality is the MOS (Mean Opinion Score). There are five grades for MOS; grade 5 is excellent and grade 1 is poor. MOS measurements can be done by voice quality systems, which use voice scripts or similar techniques for sending a known voice pattern from a fixed central unit and analyzing it with a mobile receive unit. Automated MOS scoring is not covered in this application note. However, a manual approach to MOS scoring is included in the next section. (Refer to ‘Product Literature’ for more information on automated voice quality testing using the Agilent VoicePrint system and RECON services.) The what and why approach If we determine by any method that speech quality is poor, we will also want to know why. The most effective way to find the cause of poor quality is to measure the impairments along with the air interface quality parameters. The major impairments on the air interface are coverage problems, co-channel interference, adjacent channel interference, multipath, and delayed or failed handovers. These impairments contribute to nearly all speech quality problems. The Agilent E7475A GSM-based drive test system, which includes a test mobile phone and receiver, can measure both impairments and air interface parameters (see figure 7). The system collects all the relevant air interface parameters, and performs real-time co-channel and adjacent channel interference measurements. The ability of the system to collect all relevant air interface parameters (phone and receiver), and the receiver’s ability to perform co-channel and adjacent channel interference, allow the user to determine the reasons for call quality problems without being concerned about which parameters apply under different network conditions. The phone identifies the nature of the problem (for example, high RXQUAL), and the receiver shows why the problem is occurring (for example, co-channel interference). The fast scanning receiver in the E7475A can determine the probability of the presence and absence of a signal. Refer to the BCH analyzer display in figure 8. Figure 7. Integrated phone- and receiver-based drive-test system Figure 9 illustrates how the integrated phone-and-receiver-based drive test solution can be used to measure manual MOS and C/I (carrier-to-interference ratio) simultaneously. The results are exported to MapInfo. The receiver automatically measures C/I for the co-channel interferer. BSS SID SID Speech Speech SID Speech Speech
  • 6.
    6 Figure 8.BCH analyzer display When printed in color, the plot would show C/I values of 0 to 9 dB in red (poor performance) and values greater than 10 dB in green (better performance). Then, with the test mobile phone connected to a car kit, manual MOS measurements are performed by the user’s subjective interpretation, and the results are exported to the map display. E is excellent, G is good, B is bad, and WORST is the worst speech quality. These results are stored in the database as the user presses the corresponding key on the laptop PC. Areas of bad and “worst” quality correspond to locations where the receiver measured C/I of less than 9 dB. In summary, an integrated drive test solution can determine what the problem is, and it can also indicate why it happened; for example, poor speech quality caused by high levels of co-channel interference. Figure 9. C/I and manual MOS measurements Conclusion We have examined the air interface quality parameters and their suitability for estimating speech quality with a phone-based drive test system under various network conditions. Under complex operating conditions created by features such as DTX, frequency hopping and downlink power control on, we need to adopt various methods for estimating speech quality. All these features tend to reduce average interference and thus provide an average improvement in speech quality. Occasional spikes in the values of these parameters do not usually indicate problems. An integrated phone-and-receiver-based drive test system can help identify a speech quality problem and its cause. G G G G G G G G G E E E E E E E E E E E E E E BB B G G B B B B B WORST WORST WORST WORST WORST G G G B B B B B E -61.0 -68.9 -94.6 -85.9 -73.5 -66.8 -56.5 -71.8 -53.2 -80.4 -79.6 -54.3 -68.5 -71.3 -67.4 -74.7 -67.6 -83.2 -50 -100 11 9 22 31 16 15 14 13 10 3 4 5 6 7 8 2 12 1
  • 7.
    7 Acronyms DTXdiscontinous transmission EFR enhanced full rate FER frame erasure rate FR full rate GSM global system for mobile communications MOS mean opinion score PABX private automatic branch eXchange RLT radio link counter RXQUAL receive quality RXQUAL_FULL receive quality over full 104 TDMA frames RXQUAL_SUB receive quality over subset of 104 TDMA frames SACCH slow associated control channel SID silence descriptor TDMA time division multiple access VAD voice activity detector Product literature 1. GSM Drive-Test System Technical Specifications, Agilent literature number 5968-5564E 2. GSM Drive-Test System Configuration Guide, Agilent literature number 5968-5563E 3. GSM Drive-Test brochure, Agilent literature number 5968-5562E 4. Indoor Wireless Measurement System Product Overview, Agilent literature number 5968-8691E 5. GSM Application Note 1344: Using Drive-Testing to Troubleshoot Coverage, Interference, Handover Margin and Neighbor Lists, Agilent literature number 5980-0218E 6. Product Overview: Agilent Portable VoicePrint System, Agilent Literature Number 5988-0248EN 7. Product Overview: Agilent RECON Wireless Market Reports, Agilent Literature Number 5988-0250EN
  • 8.
    8 Agilent Technologies’Test and Measurement Support, Services, and Assistance Agilent Technologies aims to maximize the value you receive, while minimizing your risk and problems. We strive to ensure that you get the test and measurement capabilities you paid for and obtain the support you need. Our extensive support resources and services can help you choose the right Agilent products for your applications and apply them successfully. Every instrument and system we sell has a global warranty. Support is available for at least five years beyond the production life of the product. Two concepts underlay Agilent's overall support policy: “Our Promise” and “Your Advantage.” Our Promise Our Promise means your Agilent test and measurement equipment will meet its advertised performance and functionality. When you are choosing new equipment, we will help you with product information, including realistic performance specifications and practical recommendations from experienced test engineers. When you use Agilent equipment, we can verify that it works properly, help with product operation, and provide basic measurement assistance for the use of specified capabilities, at no extra cost upon request. Many self-help tools are available. Your Advantage Your Advantage means that Agilent offers a wide range of additional expert test and measurement services, which you can purchase according to your unique technical and business needs. Solve problems efficiently and gain a competitive edge by contacting us for calibration, extra-cost upgrades, out-of-warranty repairs, and on-site education and training, as well as design, system integration, project management, and other professional services. Experienced Agilent engineers and technicians worldwide can help you maximize your productivity, optimize the return on investment of your Agilent instruments and systems, and obtain dependable measurement accuracy for the life of those products. By internet, phone, or fax, get assistance with all your test & measurement needs Online assistance: www.agilent.com/find/assist Phone or Fax United States: (tel) 1 800 452 4844 Canada: (tel) 1 877 894 4414 (fax) (905) 282-6495 China: (tel) 800-810-0189 (fax) 1-0800-650-0121 Europe: (tel) (31 20) 547 2323 (fax) (31 20) 547 2390 Japan: (tel) (81) 426 56 7832 (fax) (81) 426 56 7840 Korea: (tel) (82-2) 2004-5004 (fax) (82-2) 2004-5115 Latin America: (tel) (305) 269 7500 (fax) (305) 269 7599 Taiwan: (tel) 080-004-7866 (fax) (886-2) 2545-6723 Other Asia Pacific Countries: (tel) (65) 375-8100 (fax) (65) 836-0252 Email: tm_asia@agilent.com Product specifications and descriptions in this document subject to change without notice. Copyright © 2001 Agilent Technologies Printed in USA July 1, 2001 5980-2828EN