Download to read offline
![International Journal of Applied Engineering Research ISSN 0973-4562 Volume 11, Number 8 (2016) pp 6058-6062
© Research India Publications. http://www.ripublication.com
6058
Performance Analysis of Wireless Mobile Network
Oboyerulu E. Agboje
Department of Electrical and Information Engineering, Covenant University, Ota
Augustus E. Ibhaze*
Department of Electrical and Information Engineering, Covenant University, Ota
Olabode B. Idowu-Bismark
Department of Electrical and Information Engineering, Covenant University, Ota
Abstract
Improved quality of service and excellent signal coverage is the
hallmark of any installed wireless mobile infrastructure. As
technology evolve, the need to rely on seamless mobile services
become crucial. For this reason, this paper investigates the
performance of a wireless mobile network cluster of 27 base
stations using call quality and drive test approach while
proposing continual system optimization as the network system
becomes more robust. The Key Performance Indicators (KPIs)
were compared before and after base station tuning and results
showed that the optimization approach resulted in better
performance.
Keywords: Received signal, signal quality, speech quality
index, call attempt, call success rate
INTRODUCTION
The evolutional trend in wireless mobile architecture has
metamorphosed over the years so as to cater for the increasing
demand of the world’s growing population.
Telecommunication vendors and mobile operators in an
attempt to improve the quality of service have over time
deployed pilot equipment, commissioned and decommissioned
them on the basis of performance check. While the Key
Performance Indicators (KPIs) of individual
telecommunication infrastructure is benchmarked with
customers demand, the impact of the terrain and mobile
network congestion rate are also considered to be contributory
to the overall performance. Now that global linkages has come
to rely on an efficient wireless mobile network, the need to
improve the quality of service is necessitated by improved
planning, equipment tuning or swapping in order to attain the
expected grade of service.
COVERAGE OPTIMIZATION
Wireless mobile network is implemented to ensure optimal
network performance in terms of coverage efficiency, quality
of service and ultimately subscriber’s satisfaction. As
technological trend in mobile network evolution transcends, the
need to ensure efficient voice and data services becomes
paramount. While packet switched services are improved to
reduce latency, delay, improve quality of service; speed of
transmission and data rates are also engaged as technology
switches from UMTS to HSPA, HSPA+, LTE and e-LTE. In as
much as we rely on improved data services relative to evolved
technologies, the need for the improvement of an
heterogeneous architecture is not far-fetched. The need
therefore arises for vertical handoff between different
technologies as well as horizontal handoff between similar
technologies. Since lower frequency technologies are
optimized for coverage, their optimality for voice services
considering their larger coverage area demands improved
performance, which follows directly from an efficient network
optimization process. The core objective of mobile network
tuning which is a norm in network planning is to provide
efficient radio coverage to as many subscribers as possible [1].
The delimiting factor to ascertain good coverage is set to a
typical value of about -95dBm signal strength [2, 3], below
which the signal strength will require tuning. While improved
signal strength does not necessitate improved signal quality, [4]
clearly represented the need for system upgrade and
optimization as a means to improving quality of service.
Despite the implementation of 3G systems with respect to its
power efficiency, it is greatly limited by its smaller size of
coverage [5]. In order to optimally manage the coverage bound
between GSM technology, 3G and LTE systems, 2G systems
can be optimized for voice services while emerging
technologies for data services attributed to their high data rates.
This does not in any way undermine the voice capability of
emerging technologies but merely explicates optimum usage of
the entire network with respect to coverage area. The signal
quality of the mobile network is greatly impacted by the level
of interference control within the cluster of interest. As part of
the optimization process for signal quality, overshooting sites
are down tilted and power controlled to minimize their impact
on the site of interest. Power control guarantees efficient
operation of the mobile network in the management of quality
of service and interference control [6]. This interference control
strategy is directly followed by varying the antenna tilt angle of
the site of interest while adjusting the transmit power. This is
carefully executed in order not to distort the coverage design.
PERFORMANCE ANALYSIS
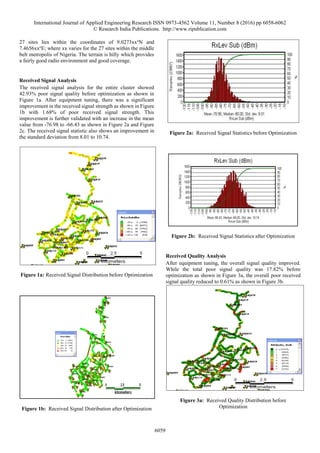
The performance analysis of twenty-seven (27) base stations
was carried out using TEMS investigation setup. The cluster of](https://image.slidesharecdn.com/performanceanalysisofwirelessmobilenetwork-161223003300/85/Performance-analysis-of-wireless-mobile-network-1-320.jpg)
![International Journal of Applied Engineering Research ISSN 0973-4562 Volume 11, Number 8 (2016) pp 6058-6062
© Research India Publications. http://www.ripublication.com
6061
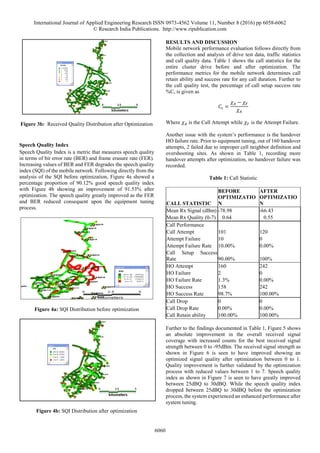
Figure 5: Received signal strength before and after
optimization
Figure 6: Received signal quality before and after
optimization
Figure 7: Speech quality index before and after optimization
CONCLUSION
The performance of existing base stations has been investigated
and optimized. Results showed that the optimization process
improves the received signal strength, signal quality and speech
quality index. The handover success rate is also greatly
improved thereby enhancing call connectivity capability in the
network. As the subscriber’s demand for any mobile network
increases, periodic optimization can be carried out to maintain
the quality of the existing network. In as much as human
interactions such as erection of new buildings and mobility
within the coverage zone will always alter the network
performance, system tuning will remain an approach to
retaining system stability.
REFERENCES
[1] R. K. Rawnsley, and S. Hurley, “Towards automatic
cell planning,” Proceedings of the 11th IEEE
International Symposium on Personal, Indoor, and
Mobile Radio Communications, Sept. 2000, pp. 1583-
1588.
[2] U S Rahman, M. A. Matin, and M R Rahman, “A
Practical Approach of Planning and Optimization for
Efficient Usage of GSM Network,” International
Journal of Communications (IJC) Volume 1 Issue 1,
December 2012, pp. 1-6
[3] Joseph Isabona, “Maximising Coverage and Capacity
with QOS Guarantee in GSM Network by Means of
Cell Cluster Optimization,” International Journal of
Advanced Research in Physical Science (IJARPS)
Volume 1, Issue 6, October 2014, PP 44-55.
[4] Sireesha B.V., Varadarajan S., Vivek and Naresh,
“Increasing of Call Success Rate in GSM Service Area
Using RF Optimization,” International Journal of
Engineering Research and Applications (IJERA) ISSN:
2248-9622 www.ijera.com Vol. 1, Issue 4, pp.1479-
1485.
[5] Malcolm W. Oliphant's, “The mobile phone meets the
Internet”, IEEE Spectrum, Vol. 8, 1999, pp. 20-28.
[6] M.Xiao, Ness B.Shroff and Edwin K.P.Chong,
“Autility based power control scheme in wireless
system,” IEEE/ACM Transactions On Networking,
Vol. 11, No. 2, 2003.
-120 -100 -80 -60 -40 -20 0
0
2000
4000
6000
8000
10000
12000
RECIVED SIGNAL STRENGTH (dBm)
PROPRTIONOFSIGNALSTRENGTH(COUNT)
COMPARISON OF RECEIVED SIGNAL STRENGTH BEFORE AND AFTER OPTIMIZATION
RX SIGNAL BEFORE OPT
RX SIGNAL AFTER OPT
0 1 2 3 4 5 6 7
0
0.5
1
1.5
2
2.5
3
3.5
4
x 10
5
RECEIVED SIGNAL QUALITY
PROPORTIONOFSIGNALQUALITY
COMPARISON OF RECEIVED SIGNAL QUALITY BEFORE AND AFTER OPTIMIZATION
RX QUALITY BEFORE OPT
RX QUALITY AFTER OPT
0 5 10 15 20 25 30
0
0.2
0.4
0.6
0.8
1
1.2
1.4
1.6
1.8
2
x 10
4
SPEECH QUALITY INDEX (dBQ)
PROPORTIONOFSPEECHQUALITYINDEX
COMPARISON OF SQI BEFORE AND AFTER OPTIMIZATION
SQI BEFORE OPT
SQI AFTER OPT](https://image.slidesharecdn.com/performanceanalysisofwirelessmobilenetwork-161223003300/85/Performance-analysis-of-wireless-mobile-network-4-320.jpg)

The paper analyzes the performance of a wireless mobile network with 27 base stations, focusing on call quality and drive test methodologies to enhance network optimization. Results indicate significant improvements in signal strength, quality, and speech quality index after equipment tuning, leading to a 100% call setup success rate and elimination of handover failures. It emphasizes the importance of periodic optimization to maintain quality amidst evolving technology and increasing subscriber demands.


