Downloaded 26 times


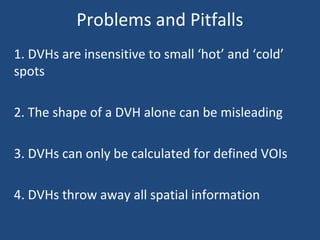
![Intro
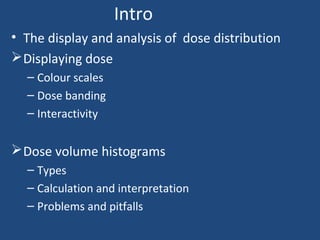
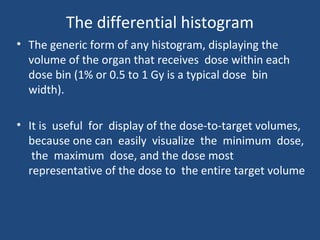
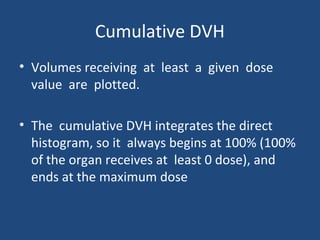
• To form a DVH for any 3D object, one looks at the dose value
for each voxel in the object and forms a histogram,
counting the number of voxels that receive each different
dose level
• Because the volume of each voxel is known, the volume of the
organ receiving each dose level is known.
• Both the volume (vertical) and dose (horizontal) axes can be
displayed in absolute terms (as cubic centimeters [cc] or
Gray [Gy]) or in relative terms (% volume or % dose),
depending on how the planner wants to analyze the results.](https://image.slidesharecdn.com/z2y97cgctqsbwjiirxym-signature-eaf12d6eca54dc17cb0f861df5438b7d6558073f64c8818c45af2f13932cdafa-poli-180401072641/85/Dose-volume-histogram-8-320.jpg)
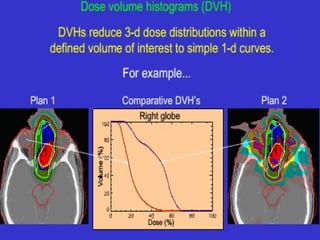
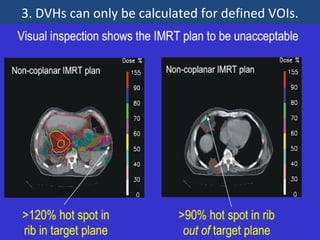
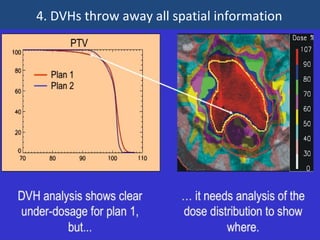
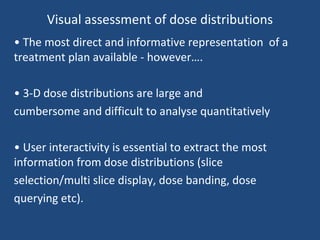
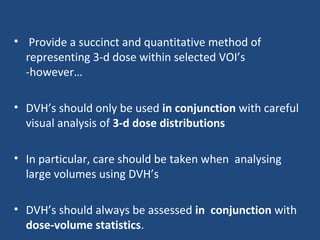


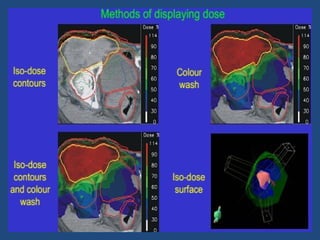
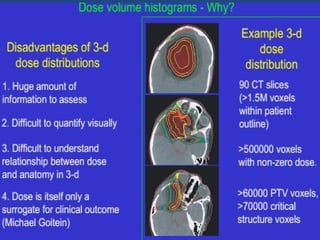
This document discusses dose-volume histograms (DVHs) which are used to analyze and compare radiation dose distributions in radiotherapy treatment planning. It describes how DVHs are generated by counting the number of voxels receiving different dose levels. DVHs can be displayed cumulatively or differentially and show the volume of structures receiving particular doses. The document outlines some limitations of DVHs including their insensitivity to small hot or cold spots and lack of spatial information. It emphasizes that DVHs should be used along with visual analysis of dose distributions and dose-volume statistics when evaluating treatment plans.


![Chapter 39 role of radiotherapy in benign diseases.pptx [read only]](https://cdn.slidesharecdn.com/ss_thumbnails/chapter39roleofradiotherapyinbenigndiseases-191105205437-thumbnail.jpg?width=640&height=640&fit=bounds)


![PERI-PROSTHETIC FRACTURE NAIL-PLATE CONSTRUCT [NPC].pptx](https://cdn.slidesharecdn.com/ss_thumbnails/drarunkumardrmohamedashrafperiprostheticfrasturenail-plateconstructnpc-260209164459-7e9d15a1-thumbnail.jpg?width=640&height=640&fit=bounds)


![CTEV [ clubfoot] DR ARUN LAL ,DR MOHAMED ASHRAF travancore medical college k...](https://cdn.slidesharecdn.com/ss_thumbnails/ctevclubfootdrarunlaldrmohamedashraftravancoremedicalcollegekollamkeralaindia-260208063247-18fc466c-thumbnail.jpg?width=640&height=640&fit=bounds)


