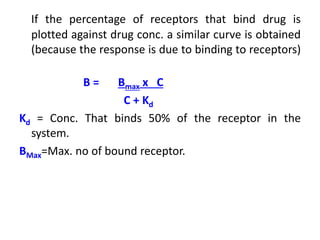
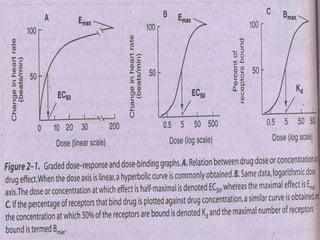
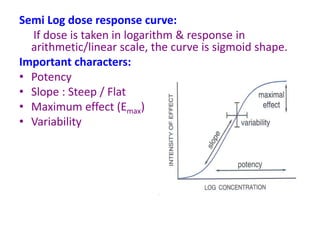
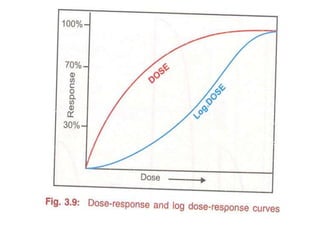
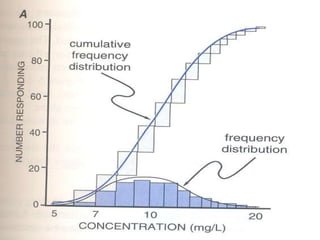
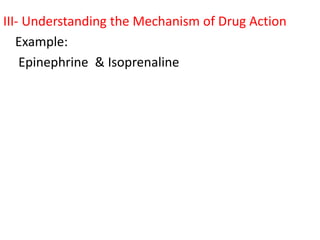
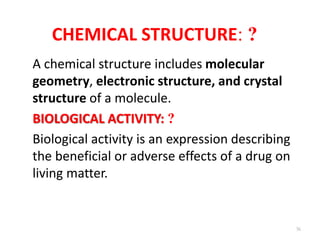
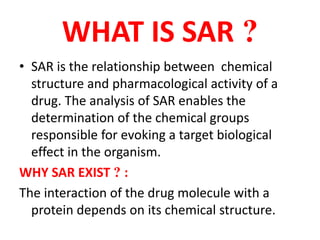
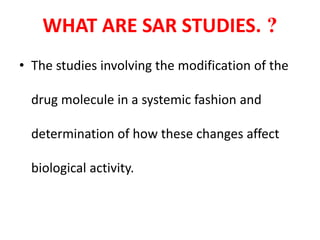
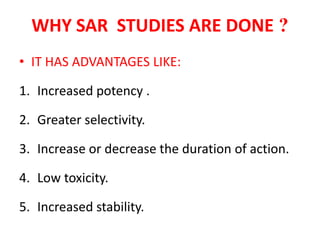
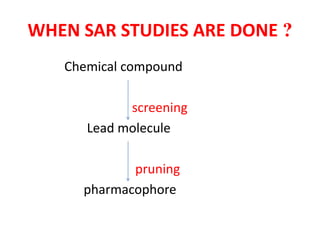
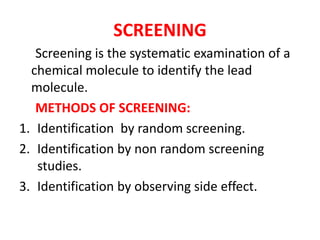
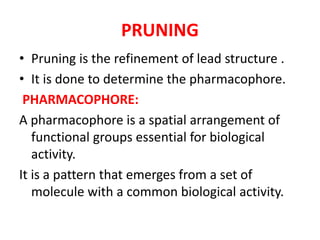
The document discusses the concepts of dose-response curves and structure-activity relationships (SAR) in pharmacology, explaining their definitions, types, and significance in drug response and activity. It covers graded and quantal dose-response curves, the importance of therapeutic index, and the analysis of chemical structures to determine their effects on biological activity. SAR studies are emphasized for their role in drug design, increasing potency, selectivity, and minimizing adverse effects.

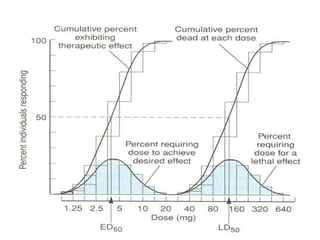
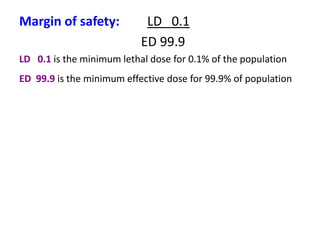
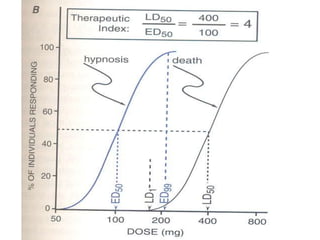
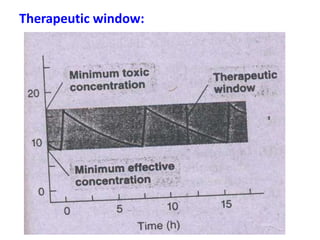
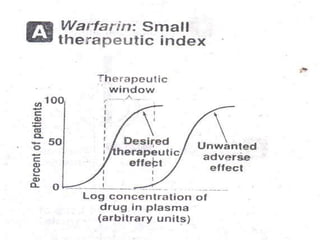
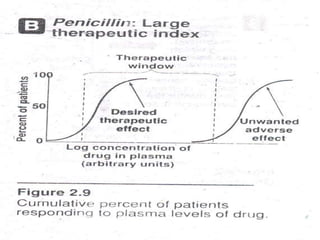
![Therapeutic index: It is the ratio of median toxic dose or median
lethal dose to median effective dose.
Therapeutic Index (T.I) = LD50 [ Median letal dose]
ED50 [Median effective dose]
TI indicates that safely the dose can be increased without fear of
toxicity.
Drugs with LOW TI--- less safe ,require monitoring of plasma
concentration. Digoxin , Lithium phenytoin, digitalis.
They have narrow Therapeutic window .
Drugs with HIGH TI: Safer , They have wide Therapeutic window
Eg: Penicillin have high TI.
•](https://image.slidesharecdn.com/drcsar-240730075825-bfe6ef86/85/Dose-Response-Curve-SAR-ppt-for-students-25-320.jpg)


![ONFH[AVN HIP] -TRIPLE REGIME -A NOVAL SURGICAL CONCEPT .pptx](https://cdn.slidesharecdn.com/ss_thumbnails/onfhavnhip2026koaconcalicutdrgokuldevdrmashraf-260210064517-213ec005-thumbnail.jpg?width=640&height=640&fit=bounds)

![PERI-PROSTHETIC FRACTURE NAIL-PLATE CONSTRUCT [NPC].pptx](https://cdn.slidesharecdn.com/ss_thumbnails/drarunkumardrmohamedashrafperiprostheticfrasturenail-plateconstructnpc-260209164459-7e9d15a1-thumbnail.jpg?width=640&height=640&fit=bounds)

