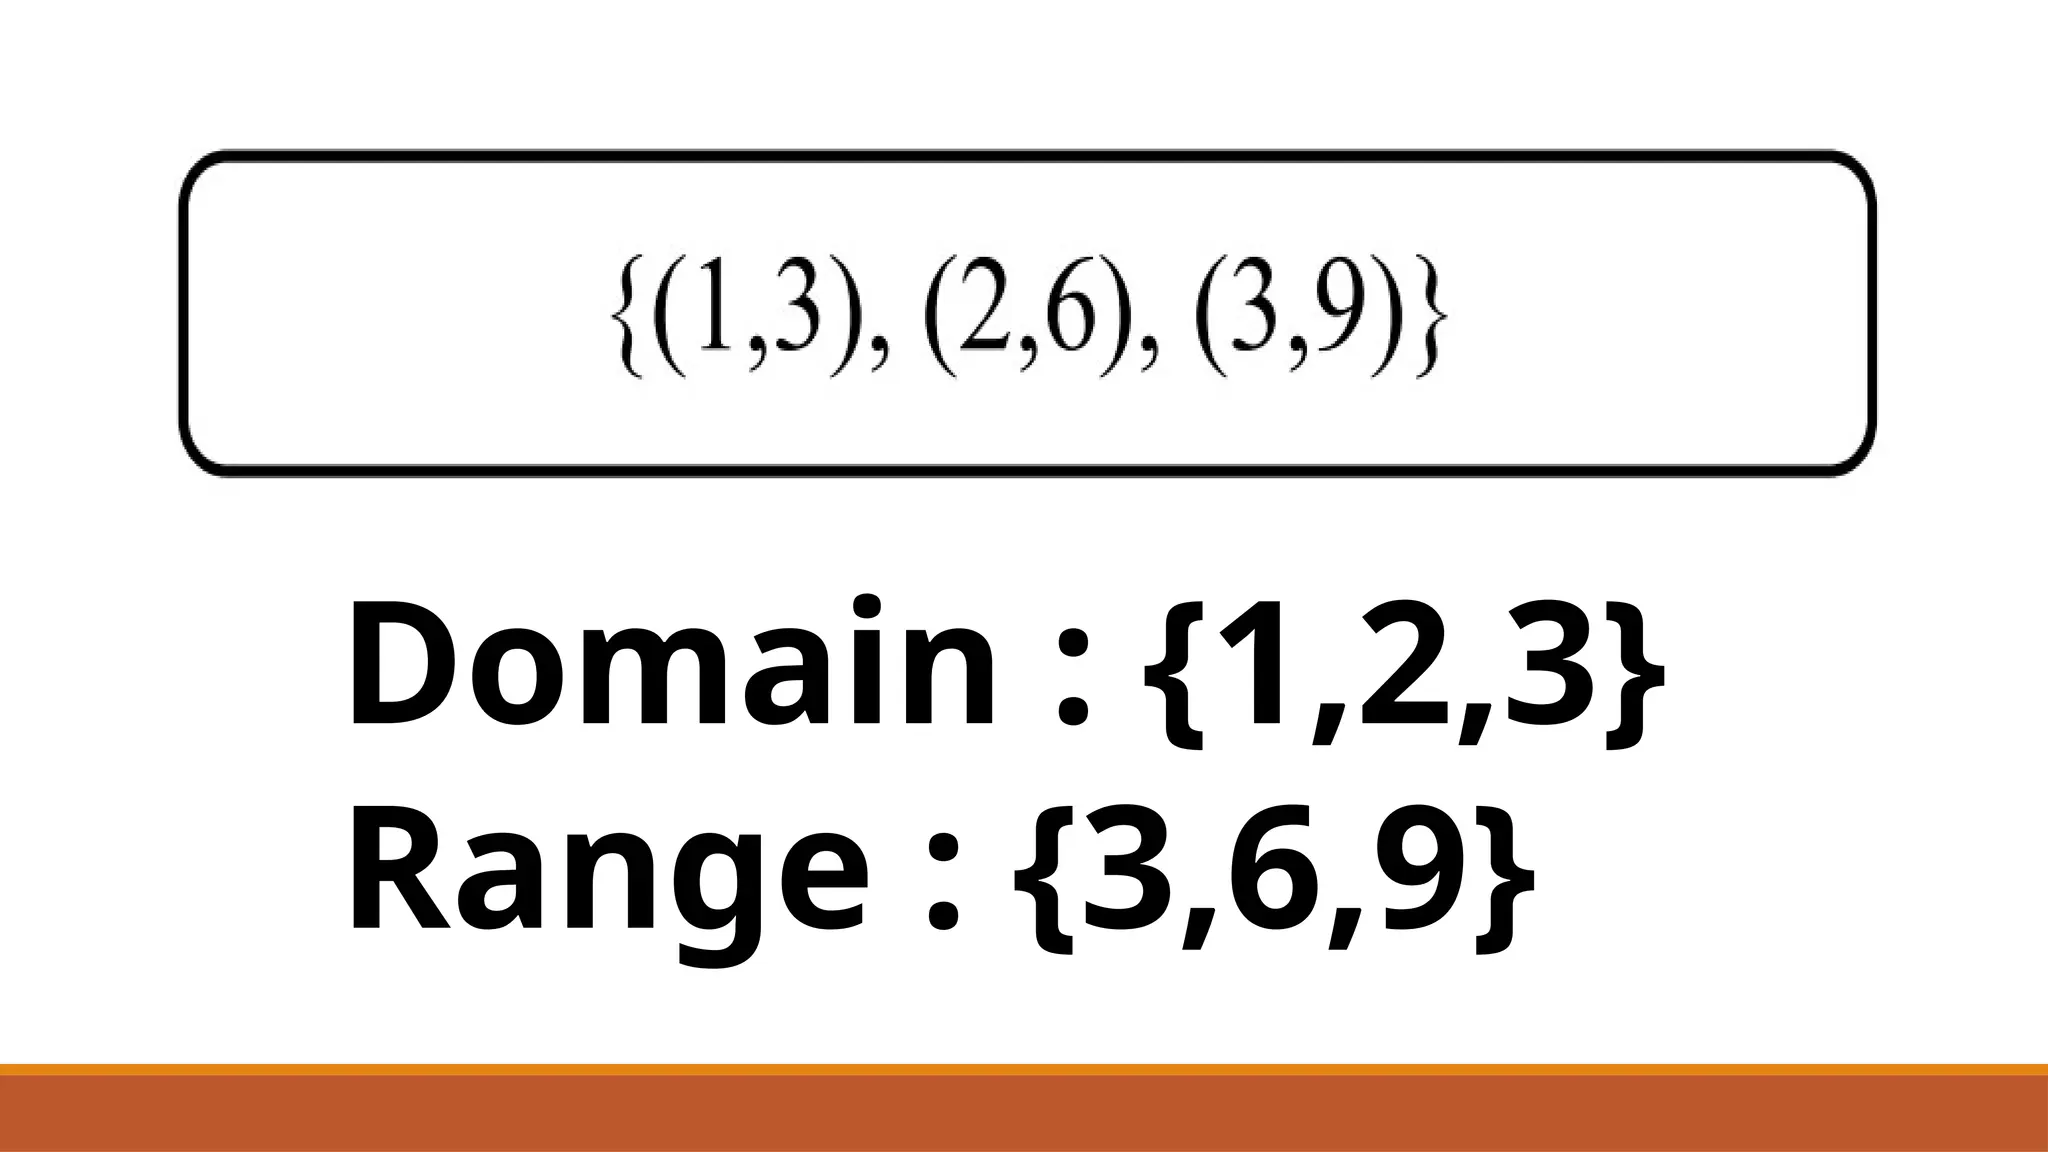
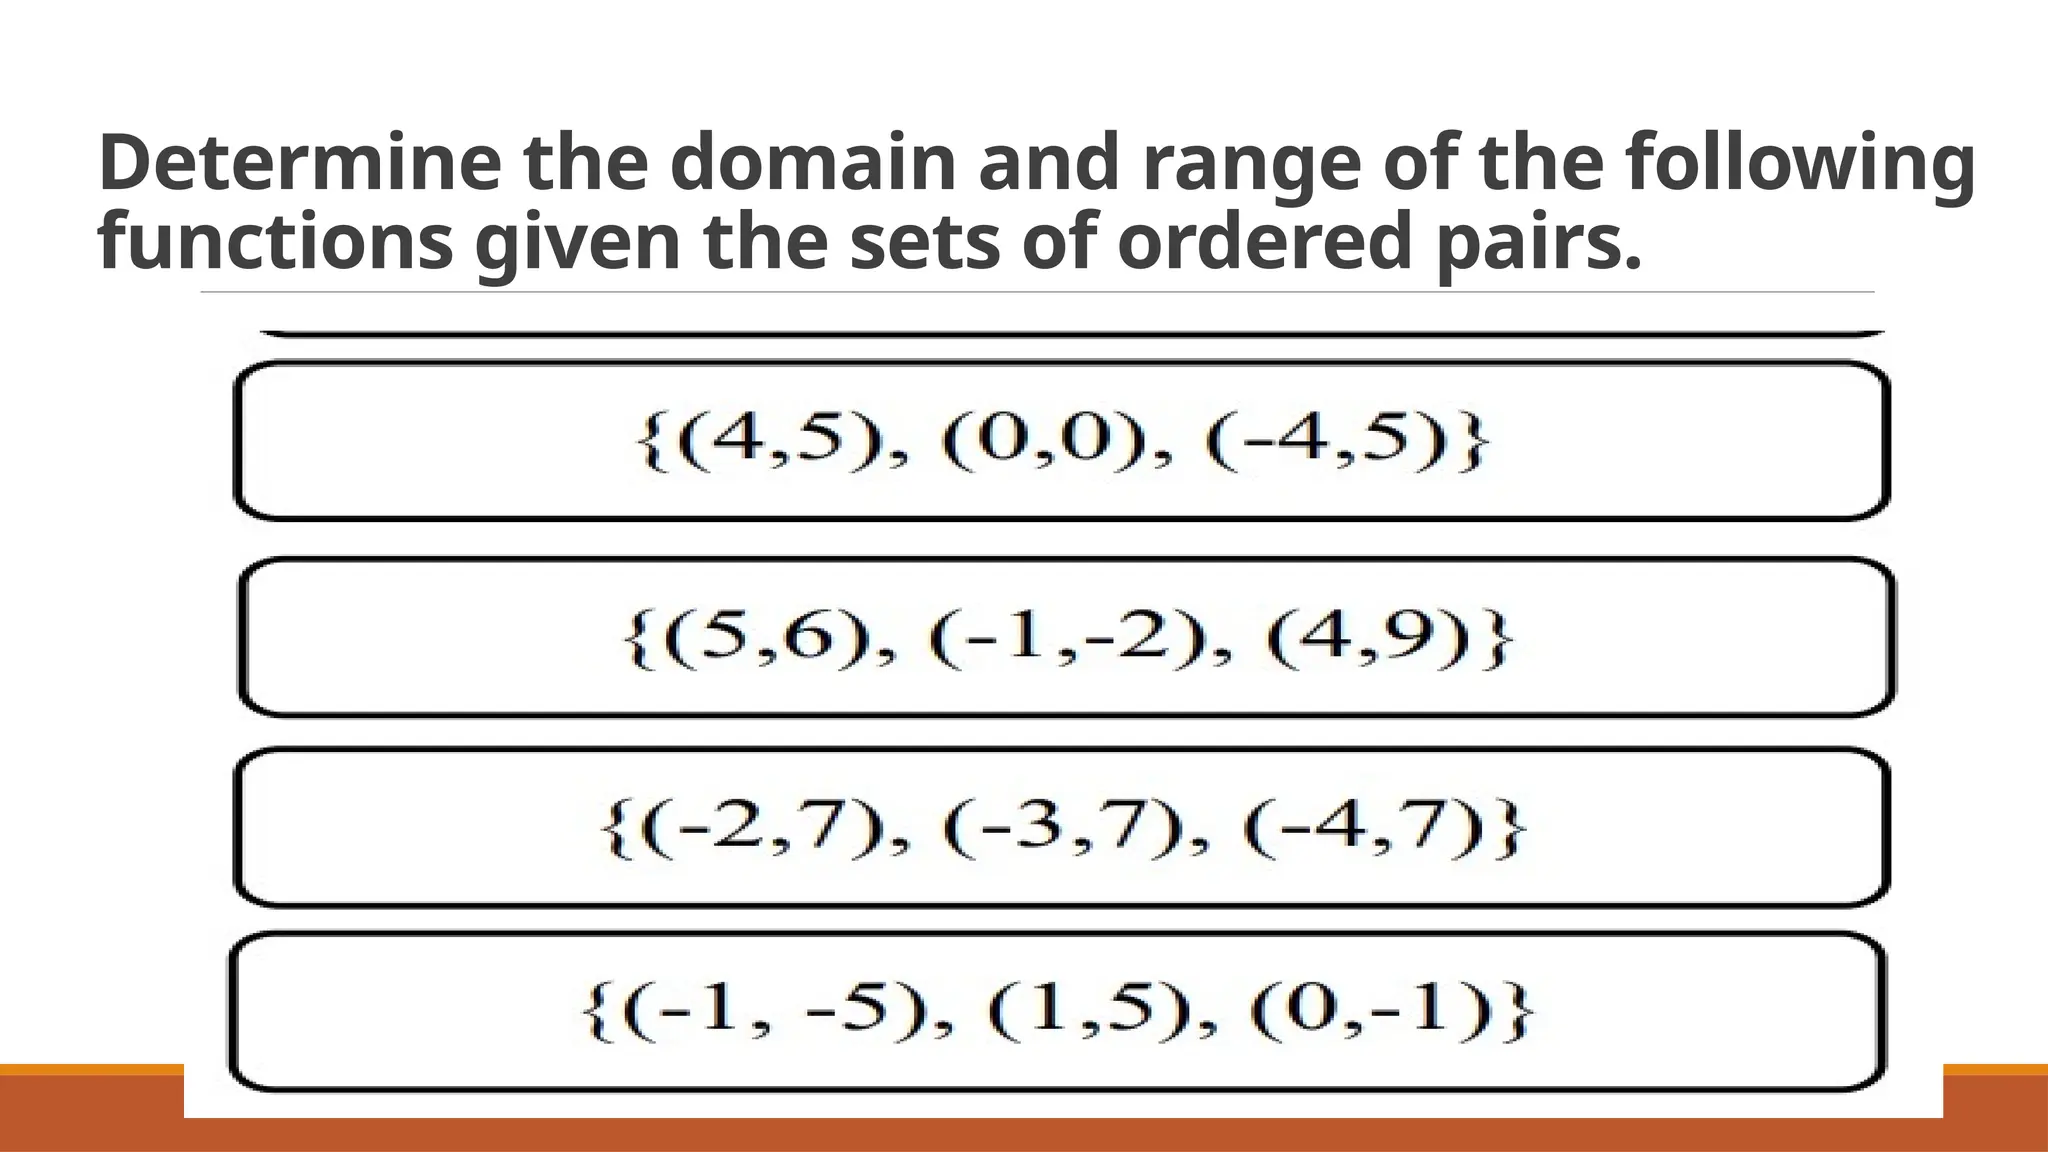
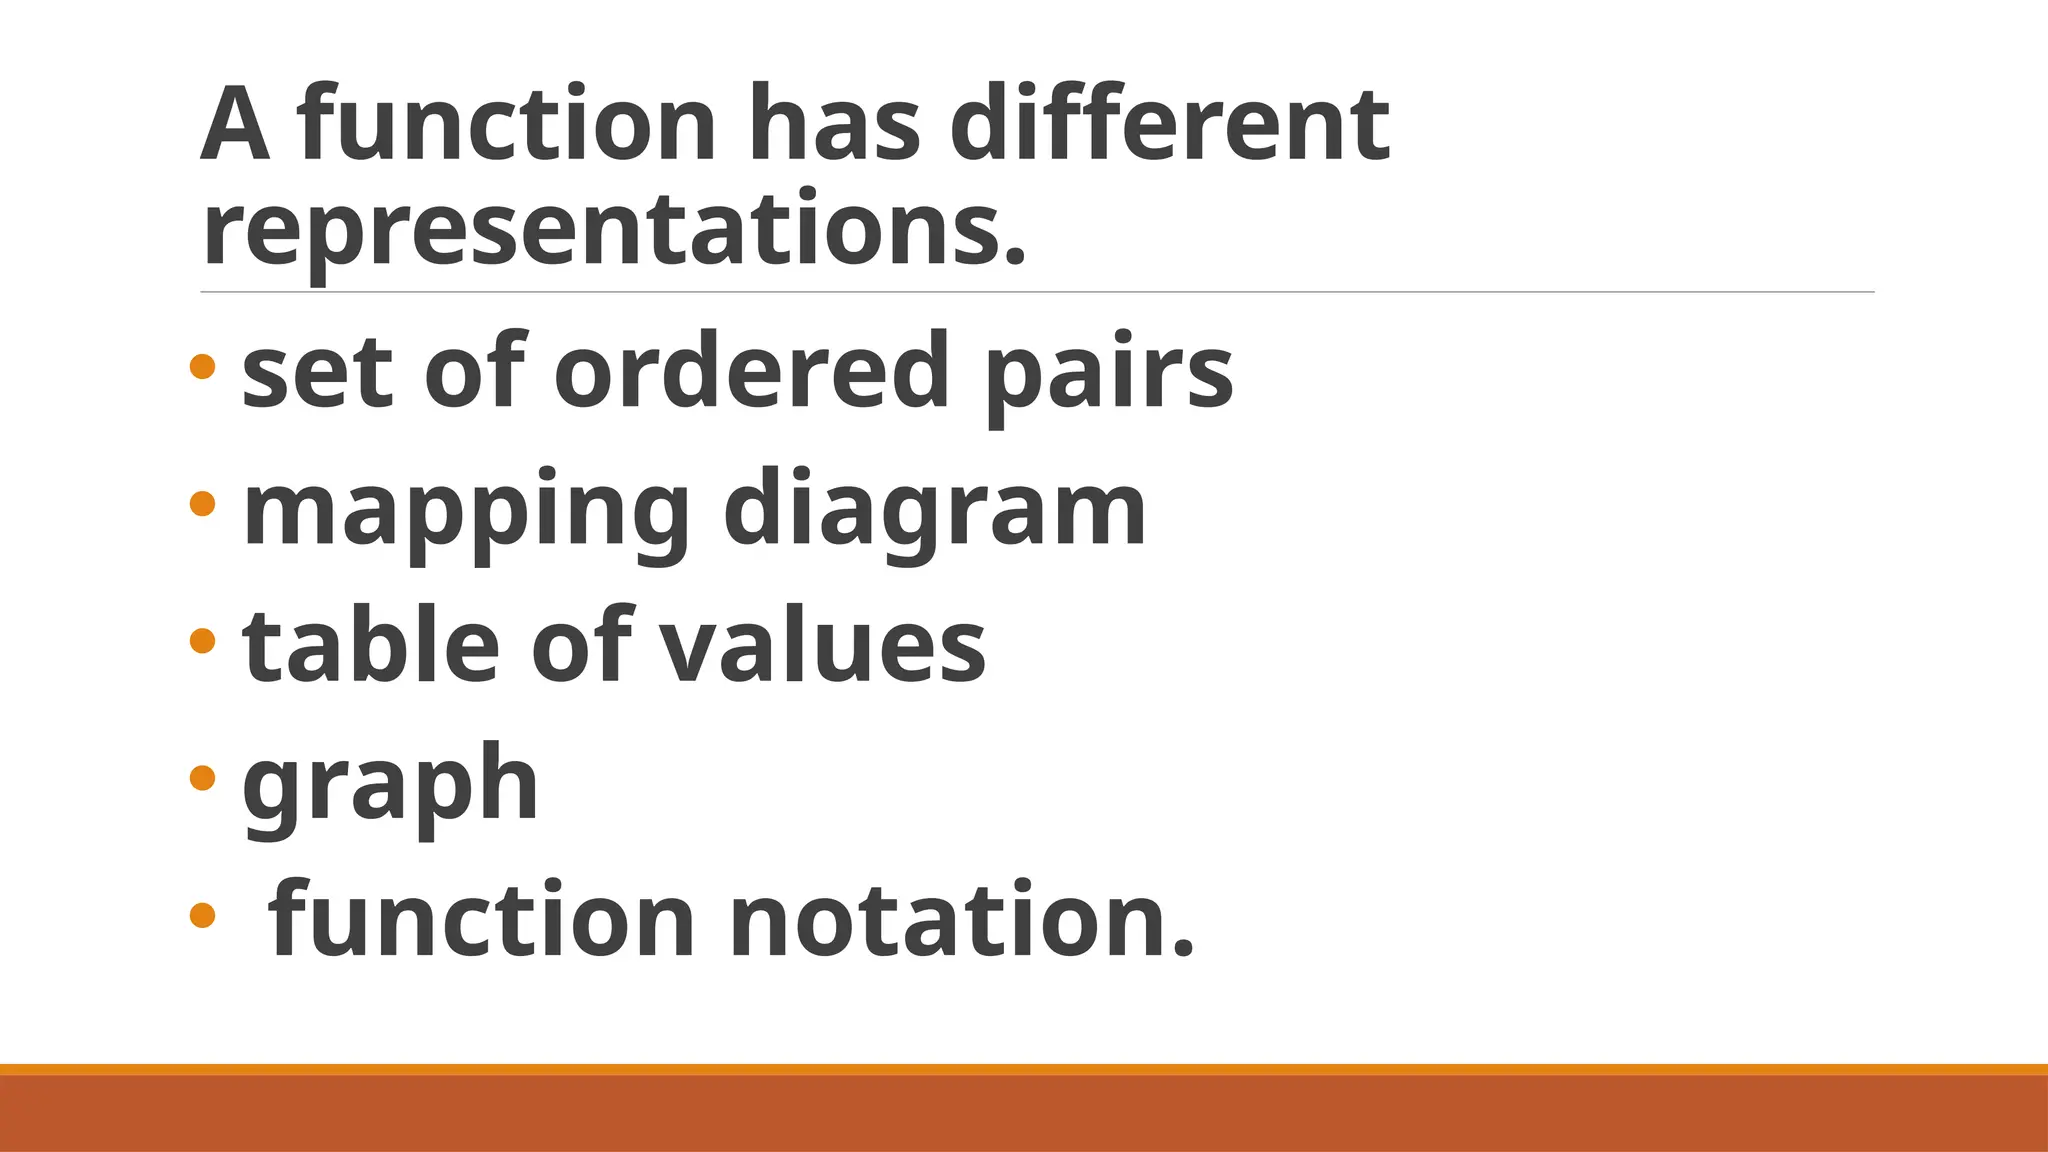
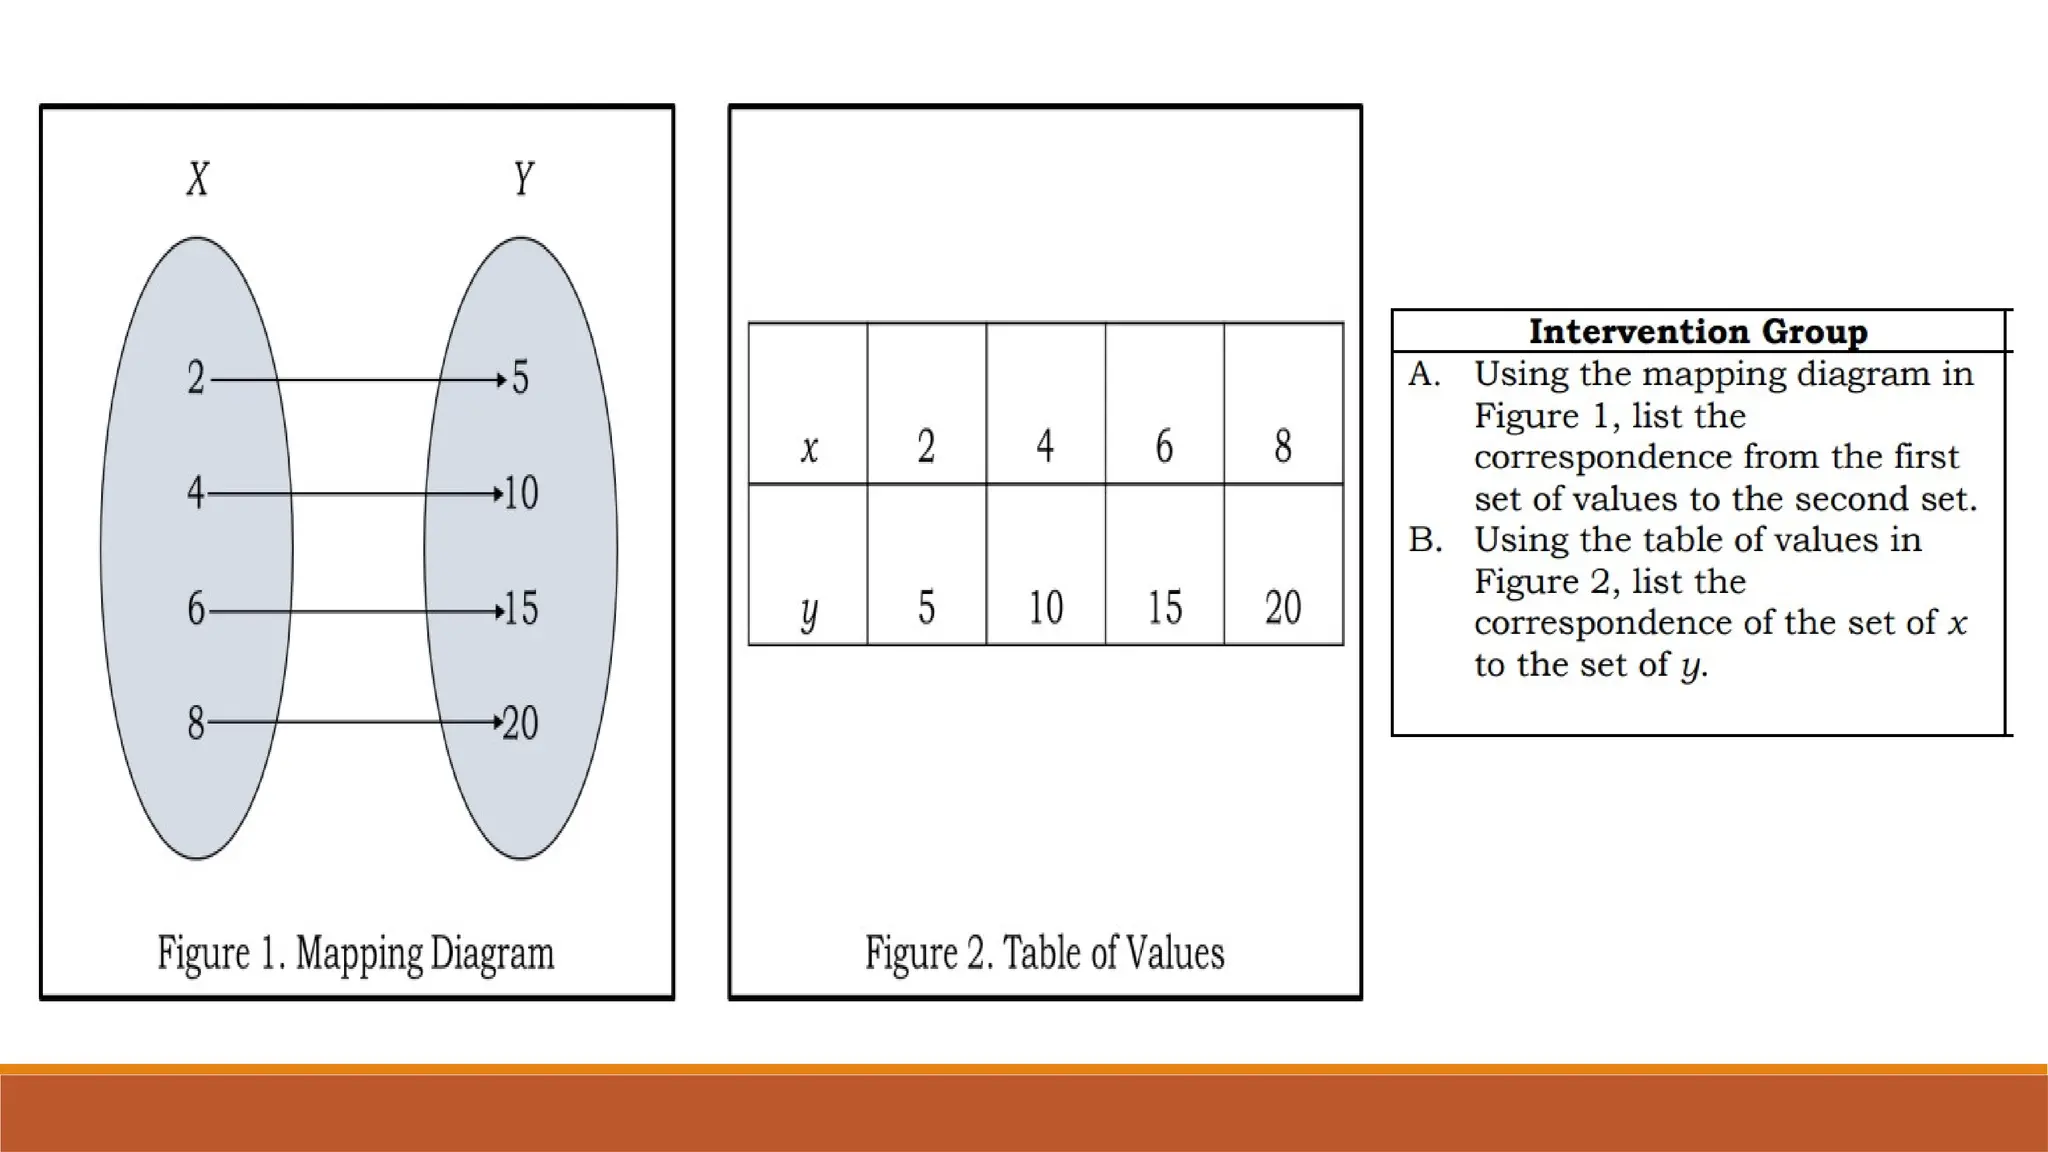
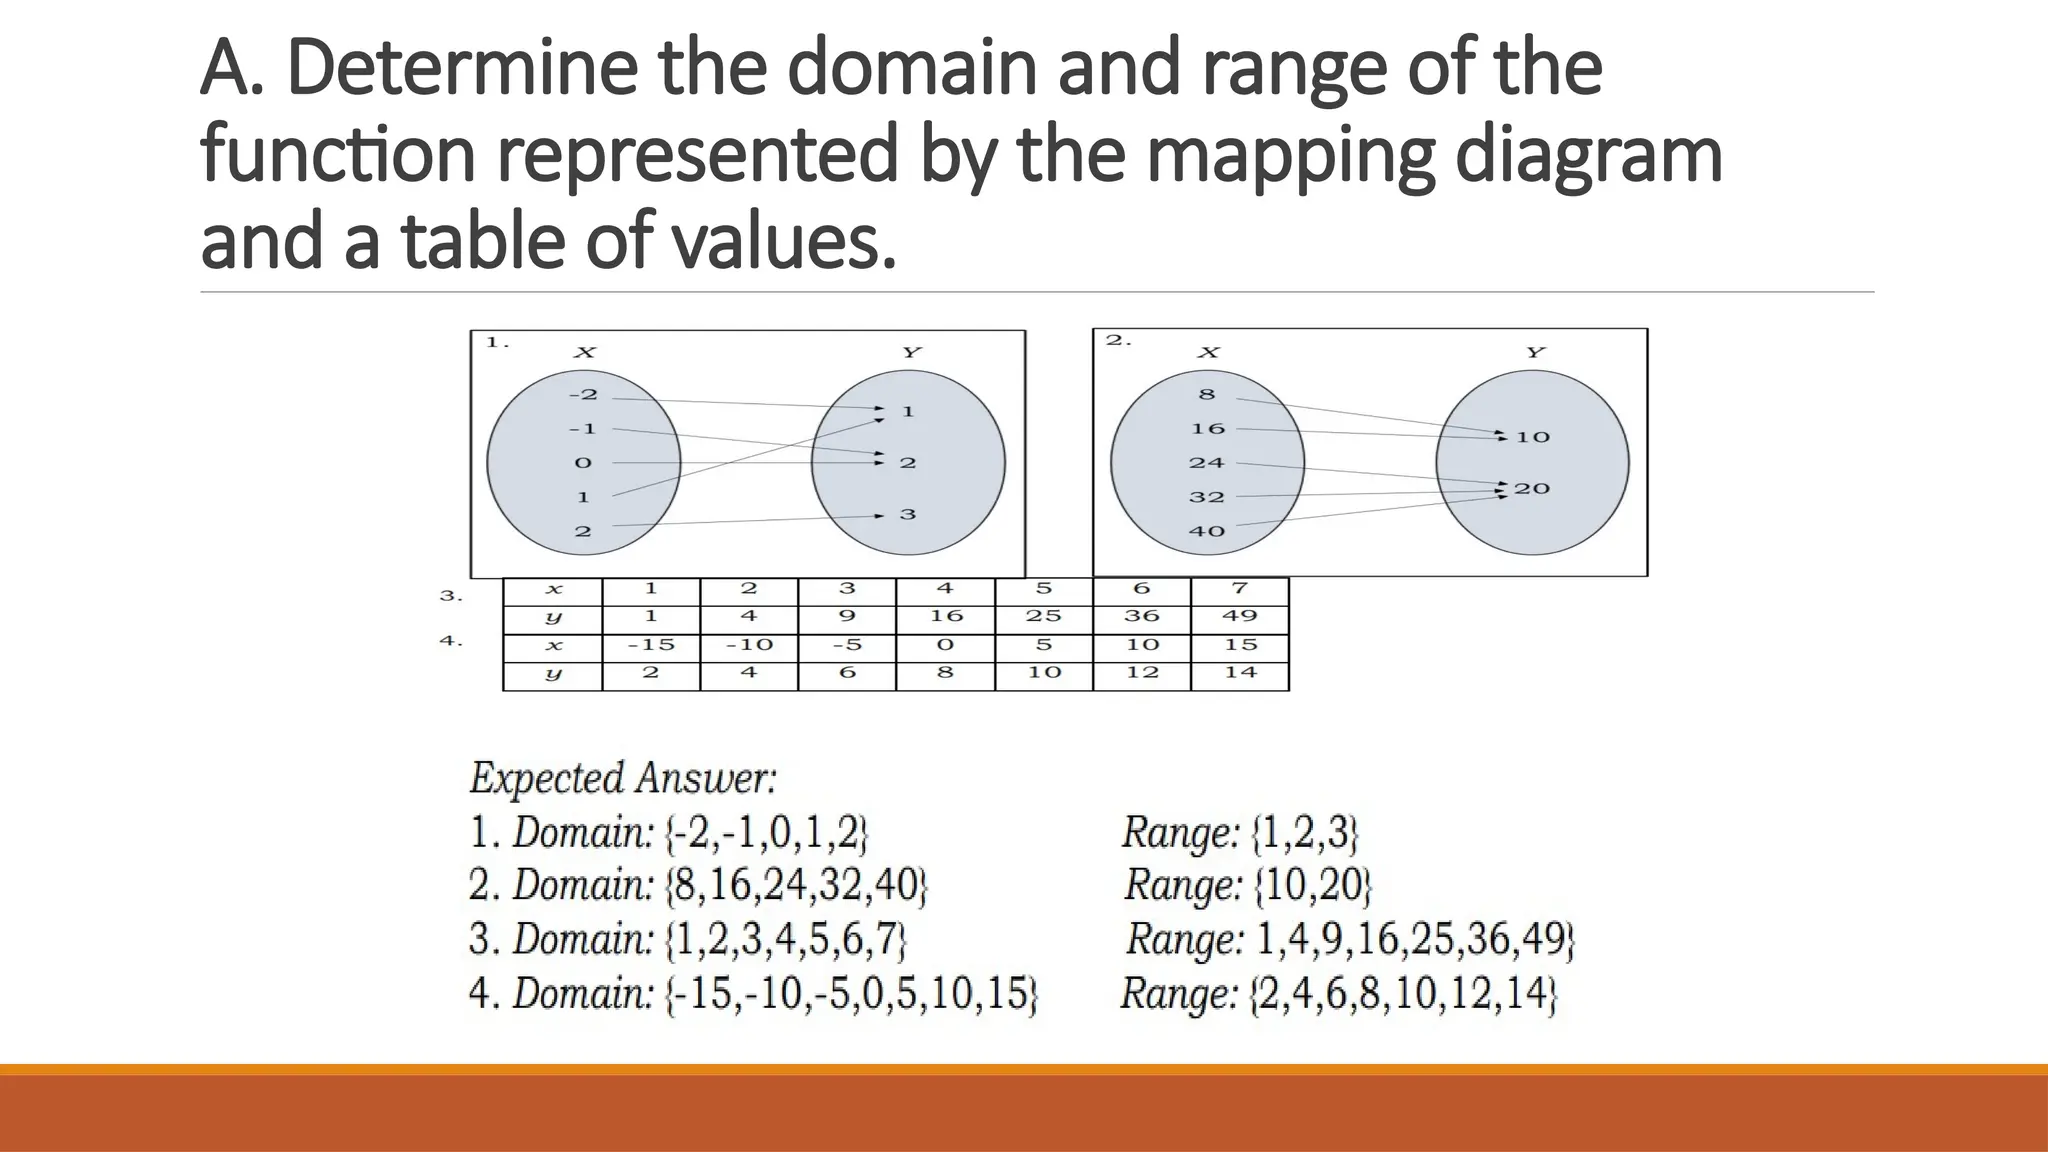
Domain and Range
of a Function
of a function? A
range of a
function?
The domain of the
function is the set of all
permissible values of x
that give real values for y.
The range of the function is
the set of permissible
values for y or f(x) that give
the values of x real
numbers.
Domain : {1,2,3}
Range : {3,6,9}
Domain :
{1,2,3,4,5}
Range :
Determine the domain and range of the following
functions given the sets of ordered pairs.
A function has different
representations.
• set of ordered pairs
• mapping diagram
• table of values
• graph
• function notation.
UNLOCKING TERMS
1. A mapping diagram is an
image of two sets that shows
the relationship between the
input (x-values) and the
output values (y-values).
UNLOCKING TERMS
2. A table of values is a systematic
arrangement of data in rows and
columns that shows the relationship
between variables.
It is used to display the input values (x-
values) and their corresponding output
values (y-values).
Based on the correspondence
you have listed, what do you
think is the domain and range
of the function represented by
the mapping diagram?
Domain: {2,4,6,8}
What is the domain and range
of the function represented by
the table of values?
Range: {5,10,15,20}
A. Determine the domain and range of the
function represented by the mapping diagram
and a table of values.
A. Determine the domain and range of the
function represented by the mapping diagram
and a table of values.
Domain and Range of a Function- Day3.pptx

Domain and Range of a Function- Day3.pptx

  • 1.
  • 2.
    of a function?A range of a function?
  • 3.
    The domain ofthe function is the set of all permissible values of x that give real values for y.
  • 4.
    The range ofthe function is the set of permissible values for y or f(x) that give the values of x real numbers.
  • 5.
  • 6.
  • 7.
    Determine the domainand range of the following functions given the sets of ordered pairs.
  • 8.
    A function hasdifferent representations. • set of ordered pairs • mapping diagram • table of values • graph • function notation.
  • 10.
    UNLOCKING TERMS 1. Amapping diagram is an image of two sets that shows the relationship between the input (x-values) and the output values (y-values).
  • 11.
    UNLOCKING TERMS 2. Atable of values is a systematic arrangement of data in rows and columns that shows the relationship between variables. It is used to display the input values (x- values) and their corresponding output values (y-values).
  • 14.
    Based on thecorrespondence you have listed, what do you think is the domain and range of the function represented by the mapping diagram? Domain: {2,4,6,8}
  • 15.
    What is thedomain and range of the function represented by the table of values? Range: {5,10,15,20}
  • 16.
    A. Determine thedomain and range of the function represented by the mapping diagram and a table of values.
  • 17.
    A. Determine thedomain and range of the function represented by the mapping diagram and a table of values.

Editor's Notes

  • #8 A while ago, you were able to determine the domain and range of functions represented by the set of ordered pairs. This time, we will determine the domain and range of a function represented by a mapping diagram and a table of values.