Download to read offline

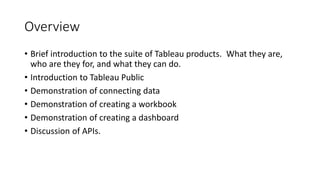


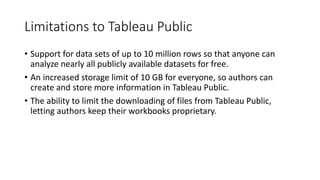
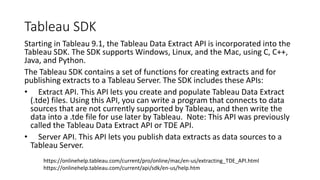
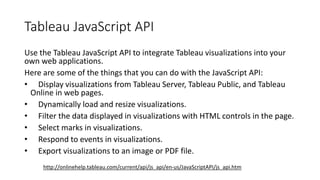

This document provides an overview of Tableau, a data visualization software. It describes the main Tableau products: Tableau Desktop for individuals, Tableau Server for enterprises, Tableau Online for cloud hosting, and Tableau Public for free sharing. It demonstrates how to connect data and create workbooks and dashboards in Tableau. It also discusses the Tableau SDK for integrating visualizations and the Tableau JavaScript API.