Introduction to DataVisualization
with Tableau
Explore the world of visualization
2.
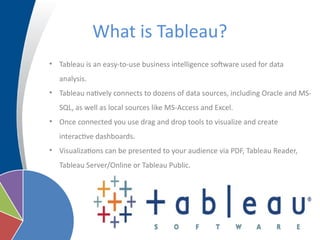
What is Tableau?
•Tableau is an easy-to-use business intelligence software used for data
analysis.
• Tableau natively connects to dozens of data sources, including Oracle and MS-
SQL, as well as local sources like MS-Access and Excel.
• Once connected you use drag and drop tools to visualize and create
interactive dashboards.
• Visualizations can be presented to your audience via PDF, Tableau Reader,
Tableau Server/Online or Tableau Public.
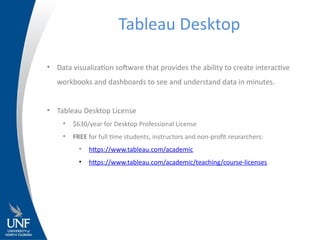
• Data visualizationsoftware that provides the ability to create interactive
workbooks and dashboards to see and understand data in minutes.
• Tableau Desktop License
• $630/year for Desktop Professional License
• FREE for full time students, instructors and non-profit researchers:
• https://www.tableau.com/academic
• https://www.tableau.com/academic/teaching/course-licenses
Tableau Desktop
5.
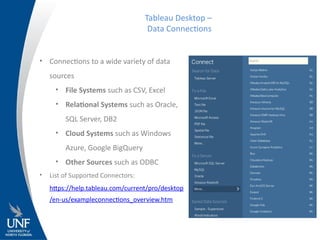
• Connections toa wide variety of data
sources
• File Systems such as CSV, Excel
• Relational Systems such as Oracle,
SQL Server, DB2
• Cloud Systems such as Windows
Azure, Google BigQuery
• Other Sources such as ODBC
• List of Supported Connectors:
https://help.tableau.com/current/pro/desktop
/en-us/exampleconnections_overview.htm
Tableau Desktop –
Data Connections
6.
• Area Chart
•Bar Chart
• Box Plot
• Bubble Chart
• Bullet Graph
• Density Marks (Heatmap)
• Gantt Chart
• Dot Plot
• Highlight Table
• Histogram
Tableau Desktop –
Graphic Types
• Line Chart
• Maps (Geographical and Heat)
• Pie Chart
• Scatter Plot
• Text Table
• Treemap
• Word Cloud
7.
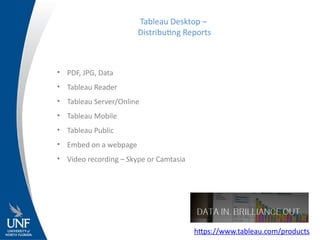
• PDF, JPG,Data
• Tableau Reader
• Tableau Server/Online
• Tableau Mobile
• Tableau Public
• Embed on a webpage
• Video recording – Skype or Camtasia
Tableau Desktop –
Distributing Reports
https://www.tableau.com/products
8.
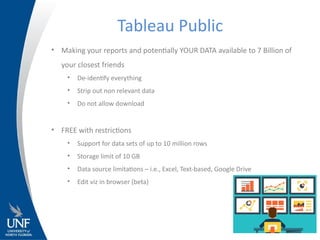
• Making yourreports and potentially YOUR DATA available to 7 Billion of
your closest friends
• De-identify everything
• Strip out non relevant data
• Do not allow download
• FREE with restrictions
• Support for data sets of up to 10 million rows
• Storage limit of 10 GB
• Data source limitations – i.e., Excel, Text-based, Google Drive
• Edit viz in browser (beta)
Tableau Public
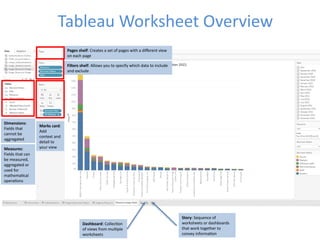
Tableau Worksheet Overview
Dashboard:Collection
of views from multiple
worksheets
Story: Sequence of
worksheets or dashboards
that work together to
convey information
Pages shelf: Creates a set of pages with a different view
on each page
Filters shelf: Allows you to specify which data to include
and exclude
Marks card:
Add
context and
detail to
your view
Dimensions:
Fields that
cannot be
aggregated
Measures:
Fields that can
be measured,
aggregated or
used for
mathematical
operations
11.
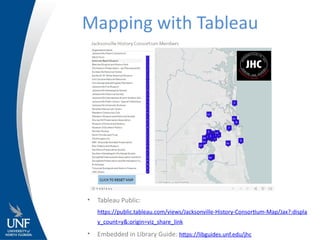
Mapping with Tableau
•Tableau Public:
https://public.tableau.com/views/Jacksonville-History-Consortium-Map/Jax?:displa
y_count=y&:origin=viz_share_link
• Embedded in Library Guide: https://libguides.unf.edu/jhc
• Free Trial
https://www.tableau.com/en-gb/products/trial
•Getting Started
https://help.tableau.com/current/pro/desktop/en-us/gettingstarted_overview.htm
• Free Training Videos
https://www.tableau.com/learn/training
• Tableau Add-In for Reshaping Data in Excel
https://community.tableau.com/docs/DOC-10394
• Higher Ed Analytics
https://www.tableau.com/solutions/education-higher-ed-analytics
• Viz of the Day
https://public.tableau.com/en-us/gallery/?tab=viz-of-the-day&type=viz-of-the-day
Tableau Resources
14.
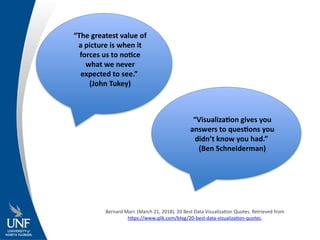
“The greatest valueof
a picture is when it
forces us to notice
what we never
expected to see.”
(John Tukey)
“Visualization gives you
answers to questions you
didn’t know you had.”
(Ben Schneiderman)
Bernard Marr. (March 21, 2018). 20 Best Data Visualization Quotes. Retrieved from
https://www.qlik.com/blog/20-best-data-visualization-quotes.