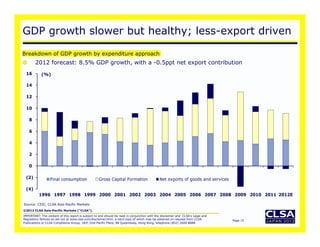
U.S. Global Investors
                  Searching for Opportunities, Managing Risk


Hard or Soft Landing in China?
Navigating China’s Transition
to a Consumer-Driven Economy

Andy Rothman
CLSA China Macro
Strategist, Shanghai
Frank Holmes,
CEO and Chief
Investment Officer
Xian Liang,
China Analyst

www.usfunds.com                                                April 2012
1.800.US.FUNDS                                                     12-182
About U.S.
Global Investors (GROW)


A boutique publicly listed investment adviser specializing
in gold, natural resources, emerging markets and
infrastructure opportunities around the world.


   www.usfunds.com
   April 2012 12-232                                         2
“Performance and Results Oriented”

        Investment leadership results in performance


                      Winner of 29 Lipper performance awards,
                       certificates and top rankings since 2000
                (Four out of 13 U.S. Global Investors Funds received Lipper performance awards
                    from 2005 to 2008, six out of 13 received certificates from 2000 to 2007,
                           and two out of 13 received top rankings from 2009 to 2010.)


  www.usfunds.com
  April 2012 12-232                                                                              3
Focus on Education


  28 MFEA STAR Awards for Excellence in Education
  www.usfunds.com
  April 2012 12-232                                 4
Bubble — Negative Press on China


  www.usfunds.com
  April 2012 12-232                5
China’s GDP Growth Tends to Stabilize
in Fifth Year of Leadership Transition Cycle


   www.usfunds.com
   April 2012 12-232                           6
Stay Tuned to the Big S-Curve
                                                                                                                                                 2009   1966


An S-curve is a type of curve that shows a rapid, exponential increase in growth for a period of time, followed by a tapering or leveling off.


            www.usfunds.com
            April 2012 12-232                                                                                                                                  7
China Still Experiencing
Strong Growth Momentum


  www.usfunds.com
  April 2012 12-232        8
Industry Relocation —
Going West and North


   www.usfunds.com
   April 2012 12-232    9
Tipping Point
 Impact is About to Be Felt Quite Soon


High Speed Train, China


           www.usfunds.com
           April 2012 12-232             10
Emerging High-Speed Rail Hub Cities


                              Frank Holmes
                              High Speed Train, China


  www.usfunds.com
  April 2012 12-232                                     11
Now, the High-Speed Rail
Will Change Everything…


  www.usfunds.com
  April 2012 12-232        12
Misunderstanding China


Andy Rothman
CLSA China Macro Strategist
Shanghai

U.S. Global Investors, 2012
Exports - Less for GDP, more for jobs
Distribution of value for iPad


Source: PCIC, UC Irvine
©2011 CLSA Asia-Pacific Markets (“CLSA”).

IMPORTANT: The content of this report is subject to and should be read in conjunction with the disclaimer and CLSA's Legal and
Regulatory Notices as set out at www.clsa.com/disclaimer.html, a hard copy of which may be obtained on request from CLSA         Page 14
Publications or CLSA Compliance Group, 18/F, One Pacific Place, 88 Queensway, Hong Kong, telephone (852) 2600 8888.
GDP growth slower but healthy; less-export driven

Breakdown of GDP growth by expenditure approach
        2012 forecast: 8.5% GDP growth, with a -0.5ppt net export contribution


Source: CEIC, CLSA Asia-Pacific Markets
©2012 CLSA Asia-Pacific Markets (“CLSA”).
IMPORTANT: The content of this report is subject to and should be read in conjunction with the disclaimer and CLSA's Legal and
Regulatory Notices as set out at www.clsa.com/disclaimer.html, a hard copy of which may be obtained on request from CLSA         Page 15
Publications or CLSA Compliance Group, 18/F, One Pacific Place, 88 Queensway, Hong Kong, telephone (852) 2600 8888.
Exports a small share of manufacturing

           50       (YoY %)
                                                                    FAI in manufacturing                              Total exports
           40         39.2
                                                           34.7
                                                                                30.7                                        31.3        31.8
                                      29.1
           30                                                                                         26.6
                                                                                                                                                    24.7
                      28.4
                                      27.2                                                                                       27.0
                                                           25.7
           20
                                                                                                                                        20.3
                                                                              17.3
           10

                                                                                                                                                    6.9
             0


        (10)


        (20)                                                                                        (15.9)

               2005                 2006                  2007                 2008                 2009                  2010          2011      YTDFeb12


FAI before 2011 include urban FAI only. FAI=Fixed Asset Investment. Source: CEIC
©2012 CLSA Asia-Pacific Markets (“CLSA”).
IMPORTANT: The content of this report is subject to and should be read in conjunction with the disclaimer and CLSA's Legal and
Regulatory Notices as set out at www.clsa.com/disclaimer.html, a hard copy of which may be obtained on request from CLSA                Page 16
Publications or CLSA Compliance Group, 18/F, One Pacific Place, 88 Queensway, Hong Kong, telephone (852) 2600 8888.
Significant RMB appreciation since 2005

BIS effective exchange rates since January 2005


 Source: BIS

©2012 CLSA Asia-Pacific Markets (“CLSA”).
IMPORTANT: The content of this report is subject to and should be read in conjunction with the disclaimer and CLSA's Legal and
Regulatory Notices as set out at www.clsa.com/disclaimer.html, a hard copy of which may be obtained on request from CLSA         Page 17
Publications or CLSA Compliance Group, 18/F, One Pacific Place, 88 Queensway, Hong Kong, telephone (852) 2600 8888.
Slower Rmb appreciation likely this year

China’s current account balance/GDP ratio


Source: CEIC, SAFE
©2012 CLSA Asia-Pacific Markets (“CLSA”).
IMPORTANT: The content of this report is subject to and should be read in conjunction with the disclaimer and CLSA's Legal and
Regulatory Notices as set out at www.clsa.com/disclaimer.html, a hard copy of which may be obtained on request from CLSA         Page 18
Publications or CLSA Compliance Group, 18/F, One Pacific Place, 88 Queensway, Hong Kong, telephone (852) 2600 8888.
Despite an undervalued Rmb, China drives US exports

Growth in US exports to major markets, 2000 to 2011
        Over that time, China has gone from the USA’s 7th largest export market to No.3


Source: CEIC
©2012 CLSA Asia-Pacific Markets (“CLSA”).
IMPORTANT: The content of this report is subject to and should be read in conjunction with the disclaimer and CLSA's Legal and
Regulatory Notices as set out at www.clsa.com/disclaimer.html, a hard copy of which may be obtained on request from CLSA         Page 19
Publications or CLSA Compliance Group, 18/F, One Pacific Place, 88 Queensway, Hong Kong, telephone (852) 2600 8888.
More privately driven investment growth
Private firms driving FAI growth for 24 consecutive months; plenty of SOE stimulus capacity
SOE share of FAI 33% in Feb12, 45% in 09, 58% in 04. SOE share of employment 19% in 2010, 61% in 90


FAI=Fixed Asset Investment. SOE=State Owned Enterprise. Source: CEIC

©2012 CLSA Asia-Pacific Markets (“CLSA”).
IMPORTANT: The content of this report is subject to and should be read in conjunction with the disclaimer and CLSA's Legal and
Regulatory Notices as set out at www.clsa.com/disclaimer.html, a hard copy of which may be obtained on request from CLSA         Page 20
Publications or CLSA Compliance Group, 18/F, One Pacific Place, 88 Queensway, Hong Kong, telephone (852) 2600 8888.
Still the world’s best consumption story

Urban household spending up 12% 4Q11 (11% 4Q10); rural up 23% 3Q11 (9% 3Q10)


Source: CEIC
©2012 CLSA Asia-Pacific Markets (“CLSA”).
IMPORTANT: The content of this report is subject to and should be read in conjunction with the disclaimer and CLSA's Legal and
Regulatory Notices as set out at www.clsa.com/disclaimer.html, a hard copy of which may be obtained on request from CLSA         Page 21
Publications or CLSA Compliance Group, 18/F, One Pacific Place, 88 Queensway, Hong Kong, telephone (852) 2600 8888.
Income growth mitigates CPI, drives spending
 Real urban income growth 7%+ for 11 years; rural income growth accelerating
 Over last decade, real urban income up 173%; rural 120%; Shanghai minimum wage up 161%


Source: National Bureau of Statistics (NBS)

©2012 CLSA Asia-Pacific Markets (“CLSA”).
IMPORTANT: The content of this report is subject to and should be read in conjunction with the disclaimer and CLSA's Legal and
Regulatory Notices as set out at www.clsa.com/disclaimer.html, a hard copy of which may be obtained on request from CLSA         Page 22
Publications or CLSA Compliance Group, 18/F, One Pacific Place, 88 Queensway, Hong Kong, telephone (852) 2600 8888.
A framework for future consumption
Strong growth in government spending on soft infrastructure
        2011 spending: education up 28%, social security 22%; health care 33%; social housing 61%
         Over last five years, spending on health care up 382%, on education up 237%


Source: NBS, Ministry of Finance
©2012 CLSA Asia-Pacific Markets (“CLSA”).
IMPORTANT: The content of this report is subject to and should be read in conjunction with the disclaimer and CLSA's Legal and
Regulatory Notices as set out at www.clsa.com/disclaimer.html, a hard copy of which may be obtained on request from CLSA         Page 23
Publications or CLSA Compliance Group, 18/F, One Pacific Place, 88 Queensway, Hong Kong, telephone (852) 2600 8888.
FAI transition point this year

After 9 years of about 25% nominal YoY growth, FAI will rise by 21-22% in 2012


FAI=Fixed Asset Investment. Source: CEIC
©2012 CLSA Asia-Pacific Markets (“CLSA”).
IMPORTANT: The content of this report is subject to and should be read in conjunction with the disclaimer and CLSA's Legal and
Regulatory Notices as set out at www.clsa.com/disclaimer.html, a hard copy of which may be obtained on request from CLSA         Page 24
Publications or CLSA Compliance Group, 18/F, One Pacific Place, 88 Queensway, Hong Kong, telephone (852) 2600 8888.
Far from bubbly

    92% of buyers are owner-occupiers; 8% investors

    23% of first-time buyers, 53% of investors pay all cash

    For those using mortgage, avg cash downpayment 44%

    Plain vanilla mortgages; home equity loans rare

    Prices rising in line with income over recent years

    Only 4% of sales in Tier 1 cities

    67% of sales in Tier 3, where prices 70% below Tier 1


Source: CRR
©2012 CLSA Asia-Pacific Markets (“CLSA”).
IMPORTANT: The content of this report is subject to and should be read in conjunction with the disclaimer and CLSA's Legal and
Regulatory Notices as set out at www.clsa.com/disclaimer.html, a hard copy of which may be obtained on request from CLSA         Page 25
Publications or CLSA Compliance Group, 18/F, One Pacific Place, 88 Queensway, Hong Kong, telephone (852) 2600 8888.
New home prices up in line with income

 30
             (YoY %)                 Average selling price per sqm                              Urban household disposable income (nominal)

 25


 20


 15


 10


    5


    0


 (5)
                  2006                      2007                     2008                     2009                      2010      2011       Average
                                                                                                                                           growth from
                                                                                                                                            06 to 2011


©2012 CLSA Asia-Pacific Markets (“CLSA”).
IMPORTANT: The content of this report is subject to and should be read in conjunction with the disclaimer and CLSA's Legal and
Regulatory Notices as set out at www.clsa.com/disclaimer.html, a hard copy of which may be obtained on request from CLSA         Page 26
Publications or CLSA Compliance Group, 18/F, One Pacific Place, 88 Queensway, Hong Kong, telephone (852) 2600 8888.
When is the big easing coming?

The market may be disappointed . . .


 Source: CEIC
©2012 CLSA Asia-Pacific Markets (“CLSA”).
IMPORTANT: The content of this report is subject to and should be read in conjunction with the disclaimer and CLSA's Legal and
Regulatory Notices as set out at www.clsa.com/disclaimer.html, a hard copy of which may be obtained on request from CLSA         Page 27
Publications or CLSA Compliance Group, 18/F, One Pacific Place, 88 Queensway, Hong Kong, telephone (852) 2600 8888.
Why no easing now? Not due to inflation

Food 62% of CPI rise. CPI this year 3.5-4% vs. 5.4% in 2011, while nominal income up over 10%


Source: CEIC, CLSA Asia-Pacific Markets

©2012 CLSA Asia-Pacific Markets (“CLSA”).
IMPORTANT: The content of this report is subject to and should be read in conjunction with the disclaimer and CLSA's Legal and
Regulatory Notices as set out at www.clsa.com/disclaimer.html, a hard copy of which may be obtained on request from CLSA         Page 28
Publications or CLSA Compliance Group, 18/F, One Pacific Place, 88 Queensway, Hong Kong, telephone (852) 2600 8888.
Not due to lack of political will or fiscal capacity

Fiscal rev rose 25% YoY in 2011 (21% in 2010), w central govt rev up 21%, local 29%

                                                                                 Local govt debt
       50       (Share of GDP)                                                   Central govt debt                                           (YoY %)     35

                                                                                 Fiscal revenue growth (RHS)
                                                                                                                                                         30
       40

                                                                                                                                                         25


       30
                                                                                                                                                         20


                                                                                                                                                         15
       20


                                                                                                                                                         10

       10
                                                                                                                                                         5


         0                                                                                                                                               0
                      2005                 2006                  2007                 2008                  2009                 2010             2011


 Source: NAO, CEIC
©2012 CLSA Asia-Pacific Markets (“CLSA”).
IMPORTANT: The content of this report is subject to and should be read in conjunction with the disclaimer and CLSA's Legal and
Regulatory Notices as set out at www.clsa.com/disclaimer.html, a hard copy of which may be obtained on request from CLSA                Page 29
Publications or CLSA Compliance Group, 18/F, One Pacific Place, 88 Queensway, Hong Kong, telephone (852) 2600 8888.
Industrial indicators solid

Growth of value-added of industry and power in line with 9%+ GDP growth in 2011, 8.5% in 2012
        Larger industrial firm profits up 25% YoY


Source: CEIC
©2012 CLSA Asia-Pacific Markets (“CLSA”).
IMPORTANT: The content of this report is subject to and should be read in conjunction with the disclaimer and CLSA's Legal and
Regulatory Notices as set out at www.clsa.com/disclaimer.html, a hard copy of which may be obtained on request from CLSA         Page 30
Publications or CLSA Compliance Group, 18/F, One Pacific Place, 88 Queensway, Hong Kong, telephone (852) 2600 8888.
Freight traffic healthy
  Freight traffic up 16.3% YoY in February vs. avg 11.4% during the five pre-stimulus years


Source: CEIC
©2012 CLSA Asia-Pacific Markets (“CLSA”).
IMPORTANT: The content of this report is subject to and should be read in conjunction with the disclaimer and CLSA's Legal and
Regulatory Notices as set out at www.clsa.com/disclaimer.html, a hard copy of which may be obtained on request from CLSA         Page 31
Publications or CLSA Compliance Group, 18/F, One Pacific Place, 88 Queensway, Hong Kong, telephone (852) 2600 8888.
GDP growth slower but healthy; less-export driven

Breakdown of GDP growth by expenditure approach
        2012 forecast: 8.5% GDP growth, with a -0.5ppt net export contribution


Source: CEIC, CLSA Asia-Pacific Markets
©2012 CLSA Asia-Pacific Markets (“CLSA”).
IMPORTANT: The content of this report is subject to and should be read in conjunction with the disclaimer and CLSA's Legal and
Regulatory Notices as set out at www.clsa.com/disclaimer.html, a hard copy of which may be obtained on request from CLSA         Page 32
Publications or CLSA Compliance Group, 18/F, One Pacific Place, 88 Queensway, Hong Kong, telephone (852) 2600 8888.
Only marginal easing coming

Inflation expectations & CPI have peaked; growth is cooling; stimulus withdrawal completed
        In recent months, loans stabilised at 15-16% YoY (vs 16% during pre-stimulus years)
        In recent months, M2 stabilised at 12-13% YoY (vs 17% during pre-stimulus years)


Source: CEIC
©2012 CLSA Asia-Pacific Markets (“CLSA”).
IMPORTANT: The content of this report is subject to and should be read in conjunction with the disclaimer and CLSA's Legal and
Regulatory Notices as set out at www.clsa.com/disclaimer.html, a hard copy of which may be obtained on request from CLSA         Page 33
Publications or CLSA Compliance Group, 18/F, One Pacific Place, 88 Queensway, Hong Kong, telephone (852) 2600 8888.
Fiscal stimulus IF exports collapse again


Source: CEIC, Bloomberg

©2012 CLSA Asia-Pacific Markets (“CLSA”).
IMPORTANT: The content of this report is subject to and should be read in conjunction with the disclaimer and CLSA's Legal and
Regulatory Notices as set out at www.clsa.com/disclaimer.html, a hard copy of which may be obtained on request from CLSA         Page 34
Publications or CLSA Compliance Group, 18/F, One Pacific Place, 88 Queensway, Hong Kong, telephone (852) 2600 8888.
Important notices
  © 2012 CLSA Asia-Pacific Markets ("CLSA") and/or Credit Agricole Securities (USA) Inc (“CAS”).
  Key to CLSA investment rankings: BUY: Total return expected to exceed market return AND provide 20% or greater absolute return; O-PF: Total return expected to be greater than market return but less than 20%
  absolute return; U-PF: Total return expected to be less than market return but expected to provide a positive absolute return; SELL: Total return expected to be less than market return AND to provide a negative
  absolute return. For relative performance, we benchmark the 12-month total return (including dividends) for the stock against the 12-month forecast return (including dividends) for the local market where the stock
  is traded.

  This publication/communication is subject to and incorporates the terms and conditions of use set out on the www.clsa.com website. Neither the publication/ communication nor any portion hereof may be reprinted,
  sold or redistributed without the written consent of CLSA and/or CAS, a broker-dealer registered with the Securities and Exchange Commission of US and an affiliate of CLSA.

  CLSA and/or CAS has/have produced this publication/communication for private circulation to professional, institutional and/or wholesale clients only. The information, opinions and estimates herein are not directed at,
  or intended for distribution to or use by, any person or entity in any jurisdiction where doing so would be contrary to law or regulation or which would subject CLSA and/or CAS to any additional registration or licensing
  requirement within such jurisdiction. The information and statistical data herein have been obtained from sources we believe to be reliable. Such information has not been independently verified and we make no
  representation or warranty as to its accuracy, completeness or correctness. Any opinions or estimates herein reflect the judgment of CLSA and/or CAS at the date of this publication/communication and are subject to
  change at any time without notice. Where any part of the information, opinions or estimates contained herein reflects the views and opinions of a sales person or a non-analyst, such views and opinions may not
  correspond to the published view of CLSA and/or CAS. This is not a solicitation or any offer to buy or sell. This publication/communication is for information purposes only and does not constitute any recommendation,
  representation, warranty or guarantee of performance. Any price target given in the report may be projected from 1 or more valuation models and hence any price target may be subject to the inherent risk of the
  selected model as well as other external risk factors. This is not intended to provide professional, investment or any other type of advice or recommendation and does not take into account the particular investment
  objectives, financial situation or needs of individual recipients. Before acting on any information in this publication/ communication, you should consider whether it is suitable for your particular circumstances and, if
  appropriate, seek professional advice, including tax advice. CLSA and/or CAS do/does not accept any responsibility and cannot be held liable for any person’s use of or reliance on the information and opinions
  contained herein. To the extent permitted by applicable securities laws and regulations, CLSA and/or CAS accept(s) no liability whatsoever for any direct or consequential loss arising from the use of this publication/
  communication or its contents. Where the publication does not contain rating, the material should not be construed as research but is offered as factual commentary. It is not intended to, nor should it be used to form
  an investment opinion about the not rated companies.

  Subject to any applicable laws and regulations at any given time CLSA, CAS, their respective affiliates or companies or individuals connected with CLSA/CAS may have used the information contained herein before
  publication and may have positions in, may from time to time purchase or sell or have a material interest in any of the securities mentioned or related securities or may currently or in future have or have had a
  business or financial relationship with, or may provide or have provided investment banking, capital markets and/or other services to, the entities referred to herein, their advisors and/or any other connected parties.
  As a result, investors should be aware that CLSA, CAS and/or their respective affiliates or companies or such individuals may have one or more conflicts of interest.

  Regulations or market practice of some jurisdictions/markets prescribe certain disclosures to be made for certain actual, potential or perceived conflicts of interests relating to research report. Details of the disclosable
  interest can be found in certain reports as required by the relevant rules and regulation and the full details are available at http://www.clsa.com/member/research_disclosures/. Disclosures therein include the position
  of the CLSA Group only and do not reflect those of Credit Agricole Corporate & Investment Bank and/or its affiliates. If investors have any difficulty accessing this website, please contact webadmin@clsa.com on (852)
  2600 8111. If you require disclosure information on previous dates, please contact compliance_hk@clsa.com.

  This publication/communication is distributed for and on behalf of CLSA Limited (for research compiled by non-US analyst(s)) and /or CAS (for research compiled by US analyst(s)) in Australia by CLSA Australia Pty
  Ltd; in Hong Kong by CLSA Research Ltd.; in India by CLSA India Ltd. (Address: 8/F, Dalamal House, Nariman Point, Mumbai 400021. Tel No: +91-22-66505050. SEBI Registration No: BSE Capital Market Segment:
  INB010826432; BSE F&O Segment: INF010826432; NSE Capital Market Segment: INB230826436; NSE F&O Segment: INF230826436); in Indonesia by PT CLSA Indonesia; in Japan by Credit Agricole Securities Asia
  B.V., Tokyo Branch, a member of the JSDA licensed to use the "CLSA" logo in Japan; in Korea by CLSA Securities Korea Ltd.; in Malaysia by CLSA Securities Malaysia Sdn Bhd; in the Philippines by CLSA Philippines Inc.
  (a member of Philippine Stock Exchange and Securities Investors Protection Fund); in Thailand by CLSA Securities (Thailand) Limited; and in Taiwan by CLSA Limited, Taipei Branch.

  United States of America: Where any section of the research is compiled by US analyst(s), it is distributed by CAS. Where any section is compiled by non-US analyst(s), it is distributed into the United States by CLSA
  solely to persons who qualify as "Major U.S. Institutional Investors" as defined in Rule 15a-6 under the Securities and Exchange Act of 1934 and who deal with Credit Agricole Corporate & Investment Bank. However,
  the delivery of this research report to any person in the United States shall not be deemed a recommendation to effect any transactions in the securities discussed herein or an endorsement of any opinion expressed
  herein. Any recipient of this research in the United States wishing to effect a transaction in any security mentioned herein should do so by contacting CAS.

  United Kingdom: Notwithstanding anything to the contrary herein, the following applies where the publication/communication is distributed in and/or into the United Kingdom. This publication/communication is only for
  distribution and/or is only directed at persons ("permitted recipients") who are (i) persons falling within Article 19 of the Financial Services and Markets Act 2000 (Financial Promotion) Order 2001 (the "FPO") having
  professional experience in matters relating to investments or high net worth companies, unincorporated associations etc. falling within Article 49 of the FPO, and (ii) where an unregulated collective investment scheme
  (an "unregulated CIS") is the subject of the publication/communication, also persons of a kind to whom the unregulated CIS may lawfully be promoted by a person authorised under the Financial Services and Markets
  Act 2000 ("FSMA") by virtue of Section 238(5) of the FSMA. The investments or services to which this publication/communication relates are available only to permitted recipients and persons of any other description
  should not rely upon it. This publication/ communication may have been produced in circumstances such that it is not appropriate to categorise it as impartial in accordance with the FSA Rules.

  Singapore: This publication/communication is distributed for and on behalf of CLSA Limited (for research compiled by non-US analyst(s)) and /or CAS (for research compiled by US analyst(s)) in Singapore through
  CLSA Singapore Pte Ltd solely to persons who qualify as Institutional, Accredited and Expert Investors only, as defined in s.4A(1) of the Securities and Futures Act. Pursuant to Paragraphs 33, 34, 35 and 36 of the
  Financial Advisers (Amendment) Regulations 2005 with regards to an Accredited Investor, Expert Investor or Overseas Investor, sections 25, 27 and 36 of the Financial Adviser Act shall not apply to CLSA Singapore Pte
  Ltd. Please contact CLSA Singapore Pte Ltd in connection with queries on the report. MICA (P) 162/12/2011

  The analysts/contributors to this publication/communication may be employed by a Credit Agricole or a CLSA company which is different from the entity that distributes the publication/communication in the respective
  jurisdictions.

 MSCI-sourced information is the exclusive property of Morgan Stanley Capital International Inc. (MSCI). Without prior written permission of MSCI, this information and any other MSCI intellectual property may not be
 reproduced, redisseminated or used to create any financial products, including any indices. This information is provided on an "as is" basis. The user assumes the entire risk of any use made of this information. MSCI,
 its affiliates and any third party involved in, or related to, computing or compiling the information hereby expressly disclaim all warranties of originality, accuracy, completeness, merchantability or fitness for a particular
 purpose with respect to any of this information. Without limiting any of the foregoing, in no event shall MSCI, any of its affiliates or any third party involved in, or related to, computing or compiling the information
©2012 CLSA Asia-Pacific Markets (“CLSA”). Morgan Stanley Capital International and the MSCI indexes are services marks of MSCI and its affiliates. The Global Industry Classification Standard (GICS) was
 have any liability for any damages of any kind. MSCI,
 developed by and is the exclusive property of Morgan Stanley Capital International Inc. and Standard & Poor's. GICS is a service mark of MSCI and S&P and has been licensed for use by CLSA Asia-Pacific Markets.
IMPORTANT: The content of this report is subject to and should be read in conjunction with the disclaimer and CLSA's Legal and
Regulatory registeredas set out of Stern, Stewart & Co. "CL" in charts and hard copy offor CAS estimates obtained on request in the CLSA
  EVA® is a Notices trademark at www.clsa.com/disclaimer.html, a tables stands which may be unless otherwise noted from source.
                                                                                                                                                                               Page 35
Publications or CLSA Compliance Group, 18/F, One Pacific Place, 88 Queensway, Hong Kong, telephone (852) 2600 8888.                                                                                                    01/01/2012
Come Visit Us at…


                      Facebook: www.facebook.com/usfunds

                      Twitter: www.twitter.com/usfunds

                      Frank Talk: www.usfunds.com/franktalk

                      Investor Alert: www.usfunds.com/alert


  www.usfunds.com
  April 2012 12-232                                           36
U.S. Global Investors is Mobile

  Get Investor Alert and Frank Talk On the Go


                   Visit www.usfunds.com/apps
   www.usfunds.com
   April 2012 12-232                            37
Disclosures
All opinions expressed and data provided are subject to change without notice. Some of these opinions may not be appropriate to every investor.

Although Lipper makes reasonable efforts to ensure the accuracy and reliability of the data contained herein, the accuracy is not guaranteed by
Lipper. Users acknowledge that they have not relied upon any warranty, condition, guarantee, or representation made by Lipper. Any use of the
data for analyzing, managing, or trading financial instruments is at the user's own risk. This is not an offer to buy or sell securities.

The Consumer Price Index (CPI) is one of the most widely recognized price measures for tracking the price of a market basket of goods and
services purchased by individuals. The weights of components are based on consumer spending patterns.

M2 Money Supply is a broad measure of money supply that includes M1 in addition to all time-related deposits, savings deposits, and
non-institutional money-market funds.

The following securities mentioned in the presentation were held by one or more of U.S. Global Investors Funds as of 12/31/2011: Apple Inc.,
Starbucks Corp.


          www.usfunds.com
          April 2012 12-232                                                                                                                       38

12 182-china webcast

  • 1.
    U.S. Global Investors Searching for Opportunities, Managing Risk Hard or Soft Landing in China? Navigating China’s Transition to a Consumer-Driven Economy Andy Rothman CLSA China Macro Strategist, Shanghai Frank Holmes, CEO and Chief Investment Officer Xian Liang, China Analyst www.usfunds.com April 2012 1.800.US.FUNDS 12-182
  • 2.
    About U.S. Global Investors(GROW) A boutique publicly listed investment adviser specializing in gold, natural resources, emerging markets and infrastructure opportunities around the world. www.usfunds.com April 2012 12-232 2
  • 3.
    “Performance and ResultsOriented” Investment leadership results in performance Winner of 29 Lipper performance awards, certificates and top rankings since 2000 (Four out of 13 U.S. Global Investors Funds received Lipper performance awards from 2005 to 2008, six out of 13 received certificates from 2000 to 2007, and two out of 13 received top rankings from 2009 to 2010.) www.usfunds.com April 2012 12-232 3
  • 4.
    Focus on Education 28 MFEA STAR Awards for Excellence in Education www.usfunds.com April 2012 12-232 4
  • 5.
    Bubble — NegativePress on China www.usfunds.com April 2012 12-232 5
  • 6.
    China’s GDP GrowthTends to Stabilize in Fifth Year of Leadership Transition Cycle www.usfunds.com April 2012 12-232 6
  • 7.
    Stay Tuned tothe Big S-Curve 2009 1966 An S-curve is a type of curve that shows a rapid, exponential increase in growth for a period of time, followed by a tapering or leveling off. www.usfunds.com April 2012 12-232 7
  • 8.
    China Still Experiencing StrongGrowth Momentum www.usfunds.com April 2012 12-232 8
  • 9.
    Industry Relocation — GoingWest and North www.usfunds.com April 2012 12-232 9
  • 10.
    Tipping Point Impactis About to Be Felt Quite Soon High Speed Train, China www.usfunds.com April 2012 12-232 10
  • 11.
    Emerging High-Speed RailHub Cities Frank Holmes High Speed Train, China www.usfunds.com April 2012 12-232 11
  • 12.
    Now, the High-SpeedRail Will Change Everything… www.usfunds.com April 2012 12-232 12
  • 13.
    Misunderstanding China Andy Rothman CLSAChina Macro Strategist Shanghai U.S. Global Investors, 2012
  • 14.
    Exports - Lessfor GDP, more for jobs Distribution of value for iPad Source: PCIC, UC Irvine ©2011 CLSA Asia-Pacific Markets (“CLSA”). IMPORTANT: The content of this report is subject to and should be read in conjunction with the disclaimer and CLSA's Legal and Regulatory Notices as set out at www.clsa.com/disclaimer.html, a hard copy of which may be obtained on request from CLSA Page 14 Publications or CLSA Compliance Group, 18/F, One Pacific Place, 88 Queensway, Hong Kong, telephone (852) 2600 8888.
  • 15.
    GDP growth slowerbut healthy; less-export driven Breakdown of GDP growth by expenditure approach   2012 forecast: 8.5% GDP growth, with a -0.5ppt net export contribution Source: CEIC, CLSA Asia-Pacific Markets ©2012 CLSA Asia-Pacific Markets (“CLSA”). IMPORTANT: The content of this report is subject to and should be read in conjunction with the disclaimer and CLSA's Legal and Regulatory Notices as set out at www.clsa.com/disclaimer.html, a hard copy of which may be obtained on request from CLSA Page 15 Publications or CLSA Compliance Group, 18/F, One Pacific Place, 88 Queensway, Hong Kong, telephone (852) 2600 8888.
  • 16.
    Exports a smallshare of manufacturing 50 (YoY %) FAI in manufacturing Total exports 40 39.2 34.7 30.7 31.3 31.8 29.1 30 26.6 24.7 28.4 27.2 27.0 25.7 20 20.3 17.3 10 6.9 0 (10) (20) (15.9) 2005 2006 2007 2008 2009 2010 2011 YTDFeb12 FAI before 2011 include urban FAI only. FAI=Fixed Asset Investment. Source: CEIC ©2012 CLSA Asia-Pacific Markets (“CLSA”). IMPORTANT: The content of this report is subject to and should be read in conjunction with the disclaimer and CLSA's Legal and Regulatory Notices as set out at www.clsa.com/disclaimer.html, a hard copy of which may be obtained on request from CLSA Page 16 Publications or CLSA Compliance Group, 18/F, One Pacific Place, 88 Queensway, Hong Kong, telephone (852) 2600 8888.
  • 17.
    Significant RMB appreciationsince 2005 BIS effective exchange rates since January 2005 Source: BIS ©2012 CLSA Asia-Pacific Markets (“CLSA”). IMPORTANT: The content of this report is subject to and should be read in conjunction with the disclaimer and CLSA's Legal and Regulatory Notices as set out at www.clsa.com/disclaimer.html, a hard copy of which may be obtained on request from CLSA Page 17 Publications or CLSA Compliance Group, 18/F, One Pacific Place, 88 Queensway, Hong Kong, telephone (852) 2600 8888.
  • 18.
    Slower Rmb appreciationlikely this year China’s current account balance/GDP ratio Source: CEIC, SAFE ©2012 CLSA Asia-Pacific Markets (“CLSA”). IMPORTANT: The content of this report is subject to and should be read in conjunction with the disclaimer and CLSA's Legal and Regulatory Notices as set out at www.clsa.com/disclaimer.html, a hard copy of which may be obtained on request from CLSA Page 18 Publications or CLSA Compliance Group, 18/F, One Pacific Place, 88 Queensway, Hong Kong, telephone (852) 2600 8888.
  • 19.
    Despite an undervaluedRmb, China drives US exports Growth in US exports to major markets, 2000 to 2011   Over that time, China has gone from the USA’s 7th largest export market to No.3 Source: CEIC ©2012 CLSA Asia-Pacific Markets (“CLSA”). IMPORTANT: The content of this report is subject to and should be read in conjunction with the disclaimer and CLSA's Legal and Regulatory Notices as set out at www.clsa.com/disclaimer.html, a hard copy of which may be obtained on request from CLSA Page 19 Publications or CLSA Compliance Group, 18/F, One Pacific Place, 88 Queensway, Hong Kong, telephone (852) 2600 8888.
  • 20.
    More privately driveninvestment growth Private firms driving FAI growth for 24 consecutive months; plenty of SOE stimulus capacity SOE share of FAI 33% in Feb12, 45% in 09, 58% in 04. SOE share of employment 19% in 2010, 61% in 90 FAI=Fixed Asset Investment. SOE=State Owned Enterprise. Source: CEIC ©2012 CLSA Asia-Pacific Markets (“CLSA”). IMPORTANT: The content of this report is subject to and should be read in conjunction with the disclaimer and CLSA's Legal and Regulatory Notices as set out at www.clsa.com/disclaimer.html, a hard copy of which may be obtained on request from CLSA Page 20 Publications or CLSA Compliance Group, 18/F, One Pacific Place, 88 Queensway, Hong Kong, telephone (852) 2600 8888.
  • 21.
    Still the world’sbest consumption story Urban household spending up 12% 4Q11 (11% 4Q10); rural up 23% 3Q11 (9% 3Q10) Source: CEIC ©2012 CLSA Asia-Pacific Markets (“CLSA”). IMPORTANT: The content of this report is subject to and should be read in conjunction with the disclaimer and CLSA's Legal and Regulatory Notices as set out at www.clsa.com/disclaimer.html, a hard copy of which may be obtained on request from CLSA Page 21 Publications or CLSA Compliance Group, 18/F, One Pacific Place, 88 Queensway, Hong Kong, telephone (852) 2600 8888.
  • 22.
    Income growth mitigatesCPI, drives spending Real urban income growth 7%+ for 11 years; rural income growth accelerating Over last decade, real urban income up 173%; rural 120%; Shanghai minimum wage up 161% Source: National Bureau of Statistics (NBS) ©2012 CLSA Asia-Pacific Markets (“CLSA”). IMPORTANT: The content of this report is subject to and should be read in conjunction with the disclaimer and CLSA's Legal and Regulatory Notices as set out at www.clsa.com/disclaimer.html, a hard copy of which may be obtained on request from CLSA Page 22 Publications or CLSA Compliance Group, 18/F, One Pacific Place, 88 Queensway, Hong Kong, telephone (852) 2600 8888.
  • 23.
    A framework forfuture consumption Strong growth in government spending on soft infrastructure   2011 spending: education up 28%, social security 22%; health care 33%; social housing 61%   Over last five years, spending on health care up 382%, on education up 237% Source: NBS, Ministry of Finance ©2012 CLSA Asia-Pacific Markets (“CLSA”). IMPORTANT: The content of this report is subject to and should be read in conjunction with the disclaimer and CLSA's Legal and Regulatory Notices as set out at www.clsa.com/disclaimer.html, a hard copy of which may be obtained on request from CLSA Page 23 Publications or CLSA Compliance Group, 18/F, One Pacific Place, 88 Queensway, Hong Kong, telephone (852) 2600 8888.
  • 24.
    FAI transition pointthis year After 9 years of about 25% nominal YoY growth, FAI will rise by 21-22% in 2012 FAI=Fixed Asset Investment. Source: CEIC ©2012 CLSA Asia-Pacific Markets (“CLSA”). IMPORTANT: The content of this report is subject to and should be read in conjunction with the disclaimer and CLSA's Legal and Regulatory Notices as set out at www.clsa.com/disclaimer.html, a hard copy of which may be obtained on request from CLSA Page 24 Publications or CLSA Compliance Group, 18/F, One Pacific Place, 88 Queensway, Hong Kong, telephone (852) 2600 8888.
  • 25.
    Far from bubbly   92% of buyers are owner-occupiers; 8% investors   23% of first-time buyers, 53% of investors pay all cash   For those using mortgage, avg cash downpayment 44%   Plain vanilla mortgages; home equity loans rare   Prices rising in line with income over recent years   Only 4% of sales in Tier 1 cities   67% of sales in Tier 3, where prices 70% below Tier 1 Source: CRR ©2012 CLSA Asia-Pacific Markets (“CLSA”). IMPORTANT: The content of this report is subject to and should be read in conjunction with the disclaimer and CLSA's Legal and Regulatory Notices as set out at www.clsa.com/disclaimer.html, a hard copy of which may be obtained on request from CLSA Page 25 Publications or CLSA Compliance Group, 18/F, One Pacific Place, 88 Queensway, Hong Kong, telephone (852) 2600 8888.
  • 26.
    New home pricesup in line with income 30 (YoY %) Average selling price per sqm Urban household disposable income (nominal) 25 20 15 10 5 0 (5) 2006 2007 2008 2009 2010 2011 Average growth from 06 to 2011 ©2012 CLSA Asia-Pacific Markets (“CLSA”). IMPORTANT: The content of this report is subject to and should be read in conjunction with the disclaimer and CLSA's Legal and Regulatory Notices as set out at www.clsa.com/disclaimer.html, a hard copy of which may be obtained on request from CLSA Page 26 Publications or CLSA Compliance Group, 18/F, One Pacific Place, 88 Queensway, Hong Kong, telephone (852) 2600 8888.
  • 27.
    When is thebig easing coming? The market may be disappointed . . . Source: CEIC ©2012 CLSA Asia-Pacific Markets (“CLSA”). IMPORTANT: The content of this report is subject to and should be read in conjunction with the disclaimer and CLSA's Legal and Regulatory Notices as set out at www.clsa.com/disclaimer.html, a hard copy of which may be obtained on request from CLSA Page 27 Publications or CLSA Compliance Group, 18/F, One Pacific Place, 88 Queensway, Hong Kong, telephone (852) 2600 8888.
  • 28.
    Why no easingnow? Not due to inflation Food 62% of CPI rise. CPI this year 3.5-4% vs. 5.4% in 2011, while nominal income up over 10% Source: CEIC, CLSA Asia-Pacific Markets ©2012 CLSA Asia-Pacific Markets (“CLSA”). IMPORTANT: The content of this report is subject to and should be read in conjunction with the disclaimer and CLSA's Legal and Regulatory Notices as set out at www.clsa.com/disclaimer.html, a hard copy of which may be obtained on request from CLSA Page 28 Publications or CLSA Compliance Group, 18/F, One Pacific Place, 88 Queensway, Hong Kong, telephone (852) 2600 8888.
  • 29.
    Not due tolack of political will or fiscal capacity Fiscal rev rose 25% YoY in 2011 (21% in 2010), w central govt rev up 21%, local 29% Local govt debt 50 (Share of GDP) Central govt debt (YoY %) 35 Fiscal revenue growth (RHS) 30 40 25 30 20 15 20 10 10 5 0 0 2005 2006 2007 2008 2009 2010 2011 Source: NAO, CEIC ©2012 CLSA Asia-Pacific Markets (“CLSA”). IMPORTANT: The content of this report is subject to and should be read in conjunction with the disclaimer and CLSA's Legal and Regulatory Notices as set out at www.clsa.com/disclaimer.html, a hard copy of which may be obtained on request from CLSA Page 29 Publications or CLSA Compliance Group, 18/F, One Pacific Place, 88 Queensway, Hong Kong, telephone (852) 2600 8888.
  • 30.
    Industrial indicators solid Growthof value-added of industry and power in line with 9%+ GDP growth in 2011, 8.5% in 2012   Larger industrial firm profits up 25% YoY Source: CEIC ©2012 CLSA Asia-Pacific Markets (“CLSA”). IMPORTANT: The content of this report is subject to and should be read in conjunction with the disclaimer and CLSA's Legal and Regulatory Notices as set out at www.clsa.com/disclaimer.html, a hard copy of which may be obtained on request from CLSA Page 30 Publications or CLSA Compliance Group, 18/F, One Pacific Place, 88 Queensway, Hong Kong, telephone (852) 2600 8888.
  • 31.
    Freight traffic healthy Freight traffic up 16.3% YoY in February vs. avg 11.4% during the five pre-stimulus years Source: CEIC ©2012 CLSA Asia-Pacific Markets (“CLSA”). IMPORTANT: The content of this report is subject to and should be read in conjunction with the disclaimer and CLSA's Legal and Regulatory Notices as set out at www.clsa.com/disclaimer.html, a hard copy of which may be obtained on request from CLSA Page 31 Publications or CLSA Compliance Group, 18/F, One Pacific Place, 88 Queensway, Hong Kong, telephone (852) 2600 8888.
  • 32.
    GDP growth slowerbut healthy; less-export driven Breakdown of GDP growth by expenditure approach   2012 forecast: 8.5% GDP growth, with a -0.5ppt net export contribution Source: CEIC, CLSA Asia-Pacific Markets ©2012 CLSA Asia-Pacific Markets (“CLSA”). IMPORTANT: The content of this report is subject to and should be read in conjunction with the disclaimer and CLSA's Legal and Regulatory Notices as set out at www.clsa.com/disclaimer.html, a hard copy of which may be obtained on request from CLSA Page 32 Publications or CLSA Compliance Group, 18/F, One Pacific Place, 88 Queensway, Hong Kong, telephone (852) 2600 8888.
  • 33.
    Only marginal easingcoming Inflation expectations & CPI have peaked; growth is cooling; stimulus withdrawal completed   In recent months, loans stabilised at 15-16% YoY (vs 16% during pre-stimulus years)   In recent months, M2 stabilised at 12-13% YoY (vs 17% during pre-stimulus years) Source: CEIC ©2012 CLSA Asia-Pacific Markets (“CLSA”). IMPORTANT: The content of this report is subject to and should be read in conjunction with the disclaimer and CLSA's Legal and Regulatory Notices as set out at www.clsa.com/disclaimer.html, a hard copy of which may be obtained on request from CLSA Page 33 Publications or CLSA Compliance Group, 18/F, One Pacific Place, 88 Queensway, Hong Kong, telephone (852) 2600 8888.
  • 34.
    Fiscal stimulus IFexports collapse again Source: CEIC, Bloomberg ©2012 CLSA Asia-Pacific Markets (“CLSA”). IMPORTANT: The content of this report is subject to and should be read in conjunction with the disclaimer and CLSA's Legal and Regulatory Notices as set out at www.clsa.com/disclaimer.html, a hard copy of which may be obtained on request from CLSA Page 34 Publications or CLSA Compliance Group, 18/F, One Pacific Place, 88 Queensway, Hong Kong, telephone (852) 2600 8888.
  • 35.
    Important notices © 2012 CLSA Asia-Pacific Markets ("CLSA") and/or Credit Agricole Securities (USA) Inc (“CAS”). Key to CLSA investment rankings: BUY: Total return expected to exceed market return AND provide 20% or greater absolute return; O-PF: Total return expected to be greater than market return but less than 20% absolute return; U-PF: Total return expected to be less than market return but expected to provide a positive absolute return; SELL: Total return expected to be less than market return AND to provide a negative absolute return. For relative performance, we benchmark the 12-month total return (including dividends) for the stock against the 12-month forecast return (including dividends) for the local market where the stock is traded. This publication/communication is subject to and incorporates the terms and conditions of use set out on the www.clsa.com website. Neither the publication/ communication nor any portion hereof may be reprinted, sold or redistributed without the written consent of CLSA and/or CAS, a broker-dealer registered with the Securities and Exchange Commission of US and an affiliate of CLSA. CLSA and/or CAS has/have produced this publication/communication for private circulation to professional, institutional and/or wholesale clients only. The information, opinions and estimates herein are not directed at, or intended for distribution to or use by, any person or entity in any jurisdiction where doing so would be contrary to law or regulation or which would subject CLSA and/or CAS to any additional registration or licensing requirement within such jurisdiction. The information and statistical data herein have been obtained from sources we believe to be reliable. Such information has not been independently verified and we make no representation or warranty as to its accuracy, completeness or correctness. Any opinions or estimates herein reflect the judgment of CLSA and/or CAS at the date of this publication/communication and are subject to change at any time without notice. Where any part of the information, opinions or estimates contained herein reflects the views and opinions of a sales person or a non-analyst, such views and opinions may not correspond to the published view of CLSA and/or CAS. This is not a solicitation or any offer to buy or sell. This publication/communication is for information purposes only and does not constitute any recommendation, representation, warranty or guarantee of performance. Any price target given in the report may be projected from 1 or more valuation models and hence any price target may be subject to the inherent risk of the selected model as well as other external risk factors. This is not intended to provide professional, investment or any other type of advice or recommendation and does not take into account the particular investment objectives, financial situation or needs of individual recipients. Before acting on any information in this publication/ communication, you should consider whether it is suitable for your particular circumstances and, if appropriate, seek professional advice, including tax advice. CLSA and/or CAS do/does not accept any responsibility and cannot be held liable for any person’s use of or reliance on the information and opinions contained herein. To the extent permitted by applicable securities laws and regulations, CLSA and/or CAS accept(s) no liability whatsoever for any direct or consequential loss arising from the use of this publication/ communication or its contents. Where the publication does not contain rating, the material should not be construed as research but is offered as factual commentary. It is not intended to, nor should it be used to form an investment opinion about the not rated companies. Subject to any applicable laws and regulations at any given time CLSA, CAS, their respective affiliates or companies or individuals connected with CLSA/CAS may have used the information contained herein before publication and may have positions in, may from time to time purchase or sell or have a material interest in any of the securities mentioned or related securities or may currently or in future have or have had a business or financial relationship with, or may provide or have provided investment banking, capital markets and/or other services to, the entities referred to herein, their advisors and/or any other connected parties. As a result, investors should be aware that CLSA, CAS and/or their respective affiliates or companies or such individuals may have one or more conflicts of interest. Regulations or market practice of some jurisdictions/markets prescribe certain disclosures to be made for certain actual, potential or perceived conflicts of interests relating to research report. Details of the disclosable interest can be found in certain reports as required by the relevant rules and regulation and the full details are available at http://www.clsa.com/member/research_disclosures/. Disclosures therein include the position of the CLSA Group only and do not reflect those of Credit Agricole Corporate & Investment Bank and/or its affiliates. If investors have any difficulty accessing this website, please contact webadmin@clsa.com on (852) 2600 8111. If you require disclosure information on previous dates, please contact compliance_hk@clsa.com. This publication/communication is distributed for and on behalf of CLSA Limited (for research compiled by non-US analyst(s)) and /or CAS (for research compiled by US analyst(s)) in Australia by CLSA Australia Pty Ltd; in Hong Kong by CLSA Research Ltd.; in India by CLSA India Ltd. (Address: 8/F, Dalamal House, Nariman Point, Mumbai 400021. Tel No: +91-22-66505050. SEBI Registration No: BSE Capital Market Segment: INB010826432; BSE F&O Segment: INF010826432; NSE Capital Market Segment: INB230826436; NSE F&O Segment: INF230826436); in Indonesia by PT CLSA Indonesia; in Japan by Credit Agricole Securities Asia B.V., Tokyo Branch, a member of the JSDA licensed to use the "CLSA" logo in Japan; in Korea by CLSA Securities Korea Ltd.; in Malaysia by CLSA Securities Malaysia Sdn Bhd; in the Philippines by CLSA Philippines Inc. (a member of Philippine Stock Exchange and Securities Investors Protection Fund); in Thailand by CLSA Securities (Thailand) Limited; and in Taiwan by CLSA Limited, Taipei Branch. United States of America: Where any section of the research is compiled by US analyst(s), it is distributed by CAS. Where any section is compiled by non-US analyst(s), it is distributed into the United States by CLSA solely to persons who qualify as "Major U.S. Institutional Investors" as defined in Rule 15a-6 under the Securities and Exchange Act of 1934 and who deal with Credit Agricole Corporate & Investment Bank. However, the delivery of this research report to any person in the United States shall not be deemed a recommendation to effect any transactions in the securities discussed herein or an endorsement of any opinion expressed herein. Any recipient of this research in the United States wishing to effect a transaction in any security mentioned herein should do so by contacting CAS. United Kingdom: Notwithstanding anything to the contrary herein, the following applies where the publication/communication is distributed in and/or into the United Kingdom. This publication/communication is only for distribution and/or is only directed at persons ("permitted recipients") who are (i) persons falling within Article 19 of the Financial Services and Markets Act 2000 (Financial Promotion) Order 2001 (the "FPO") having professional experience in matters relating to investments or high net worth companies, unincorporated associations etc. falling within Article 49 of the FPO, and (ii) where an unregulated collective investment scheme (an "unregulated CIS") is the subject of the publication/communication, also persons of a kind to whom the unregulated CIS may lawfully be promoted by a person authorised under the Financial Services and Markets Act 2000 ("FSMA") by virtue of Section 238(5) of the FSMA. The investments or services to which this publication/communication relates are available only to permitted recipients and persons of any other description should not rely upon it. This publication/ communication may have been produced in circumstances such that it is not appropriate to categorise it as impartial in accordance with the FSA Rules. Singapore: This publication/communication is distributed for and on behalf of CLSA Limited (for research compiled by non-US analyst(s)) and /or CAS (for research compiled by US analyst(s)) in Singapore through CLSA Singapore Pte Ltd solely to persons who qualify as Institutional, Accredited and Expert Investors only, as defined in s.4A(1) of the Securities and Futures Act. Pursuant to Paragraphs 33, 34, 35 and 36 of the Financial Advisers (Amendment) Regulations 2005 with regards to an Accredited Investor, Expert Investor or Overseas Investor, sections 25, 27 and 36 of the Financial Adviser Act shall not apply to CLSA Singapore Pte Ltd. Please contact CLSA Singapore Pte Ltd in connection with queries on the report. MICA (P) 162/12/2011 The analysts/contributors to this publication/communication may be employed by a Credit Agricole or a CLSA company which is different from the entity that distributes the publication/communication in the respective jurisdictions. MSCI-sourced information is the exclusive property of Morgan Stanley Capital International Inc. (MSCI). Without prior written permission of MSCI, this information and any other MSCI intellectual property may not be reproduced, redisseminated or used to create any financial products, including any indices. This information is provided on an "as is" basis. The user assumes the entire risk of any use made of this information. MSCI, its affiliates and any third party involved in, or related to, computing or compiling the information hereby expressly disclaim all warranties of originality, accuracy, completeness, merchantability or fitness for a particular purpose with respect to any of this information. Without limiting any of the foregoing, in no event shall MSCI, any of its affiliates or any third party involved in, or related to, computing or compiling the information ©2012 CLSA Asia-Pacific Markets (“CLSA”). Morgan Stanley Capital International and the MSCI indexes are services marks of MSCI and its affiliates. The Global Industry Classification Standard (GICS) was have any liability for any damages of any kind. MSCI, developed by and is the exclusive property of Morgan Stanley Capital International Inc. and Standard & Poor's. GICS is a service mark of MSCI and S&P and has been licensed for use by CLSA Asia-Pacific Markets. IMPORTANT: The content of this report is subject to and should be read in conjunction with the disclaimer and CLSA's Legal and Regulatory registeredas set out of Stern, Stewart & Co. "CL" in charts and hard copy offor CAS estimates obtained on request in the CLSA EVA® is a Notices trademark at www.clsa.com/disclaimer.html, a tables stands which may be unless otherwise noted from source. Page 35 Publications or CLSA Compliance Group, 18/F, One Pacific Place, 88 Queensway, Hong Kong, telephone (852) 2600 8888. 01/01/2012
  • 36.
    Come Visit Usat… Facebook: www.facebook.com/usfunds Twitter: www.twitter.com/usfunds Frank Talk: www.usfunds.com/franktalk Investor Alert: www.usfunds.com/alert www.usfunds.com April 2012 12-232 36
  • 37.
    U.S. Global Investorsis Mobile Get Investor Alert and Frank Talk On the Go Visit www.usfunds.com/apps www.usfunds.com April 2012 12-232 37
  • 38.
    Disclosures All opinions expressedand data provided are subject to change without notice. Some of these opinions may not be appropriate to every investor. Although Lipper makes reasonable efforts to ensure the accuracy and reliability of the data contained herein, the accuracy is not guaranteed by Lipper. Users acknowledge that they have not relied upon any warranty, condition, guarantee, or representation made by Lipper. Any use of the data for analyzing, managing, or trading financial instruments is at the user's own risk. This is not an offer to buy or sell securities. The Consumer Price Index (CPI) is one of the most widely recognized price measures for tracking the price of a market basket of goods and services purchased by individuals. The weights of components are based on consumer spending patterns. M2 Money Supply is a broad measure of money supply that includes M1 in addition to all time-related deposits, savings deposits, and non-institutional money-market funds. The following securities mentioned in the presentation were held by one or more of U.S. Global Investors Funds as of 12/31/2011: Apple Inc., Starbucks Corp. www.usfunds.com April 2012 12-232 38