1) The Canadian Hydrogen Intensity Mapping Experiment (CHIME) telescope will observe the 400-800 MHz band and have a uniform north-south field of view, allowing it to observe every NANOGrav pulsar once per day.
2) Models show that CHIME should be able to make satisfactory daily observations for most NANOGrav pulsars, with a detection threshold flux shown in Figure 2.
3) Calculations based on pulse profiles and timing uncertainties indicate CHIME could measure pulsar dispersion measures (DMs) daily with uncertainties better than 10-3 pc cm-3 for many NANOGrav pulsars, comparable to current uncertainties, as shown in Figure 5.
Explanation of very simple methods for atmospheric corrections and an example adapted from a paper of the Dept. of Thermodynamics, University of Valencia, Spain.
MODELLING AND ATMOSPHERIC ERRORS IN GPS SIGNAL PROPAGATIONSHADABANSARI57
A BRIEF INTRODUCTION TO IONOSPHERIC AND TROPOSPHERIC ERRORS IN GPS SIGNAL PROPAGATION
DERIVATION OF FORMULA WITH THE BASIC LEVEL.
BASIC UNDERSTANDING OF FIGURE..
FOLLOW THE REFERENCE BOOK FOR MORE DETAIL.
Atmospheric Correction of Remotely Sensed Images in Spatial and Transform DomainCSCJournals
Remotely sensed data is an effective source of information for monitoring changes in land use and land cover. However remotely sensed images are often degraded due to atmospheric effects or physical limitations. Atmospheric correction minimizes or removes the atmospheric influences that are added to the pure signal of target and to extract more accurate information. The atmospheric correction is often considered critical pre-processing step to achieve full spectral information from every pixel especially with hyperspectral and multispectral data. In this paper, multispectral atmospheric correction approaches that require no ancillary data are presented in spatial domain and transform domain. We propose atmospheric correction using linear regression model based on the wavelet transform and Fourier transform. They are tested on Landsat image consisting of 7 multispectral bands and their performance is evaluated using visual and statistical measures. The application of the atmospheric correction methods for vegetation analyses using Normalized Difference Vegetation Index is also presented in this paper.
Towards the identification of the primary particle nature by the radiodetecti...Ahmed Ammar Rebai PhD
Radio signal from extensive air showers EAS studied by the CODALEMA experiment have been detected by means of the classic short fat antennas array working in a slave trigger mode by a particle scintillator array. It is shown that the radio shower wavefront is curved with respect to the plane wavefront hypothesis. Then a new tting model (parabolic model) is proposed to fit the radio signal time delay distributions in an event-by-event basis. This model take
into account this wavefront property and several shower geometry parameters such as: the existence of an apparent localised radio-emission source located at a distance Rc from the antenna array of and the radio shower core on the
ground. Comparison of the outputs from this model and other reconstruction models used in the same experiment show:
1)- That the radio shower core is shifted from the particle shower core in a statistic analysis approach.
2)- The capability of the radiodetection method to reconstruct the curvature radius with a statistical error less than 50 g.cm−2 .
Finally a preliminary study of the primary particle nature has been performed based on a comparison between data and Xmax distribution from Aires Monte-Carlo simulations for the same set of events.
Parametric Time Domain Method for separation of Cloud and Drizzle for ARM Clo...Pratik Ramdasi
Presentation describes Parametric Time Domain Method (PTDM) to separate cloud and drizzle moments for the W-band ARM cloud radar located at Graciosa Island, Portugal.
ASTUDYOF TSUNAMIMODEL FOR PROPAGATION OF OCEANICWAVESDr.E.Syed Mohamed
This paper tries to study this phenomenon that shows a considerable amount of uncertainty. To
model the spread of tsunami waves, the initial wave can be considered as a continuous two dimensional
closed curve. Each point in its parametric representation on the curve will act as a point source which
expands as a small ellipse. The parameters of each ellipse depend on many factors such as the energy
focusing effect, travel path of the waves,
IOSR Journal of Applied Physics (IOSR-JAP) is an open access international journal that provides rapid publication (within a month) of articles in all areas of physics and its applications. The journal welcomes publications of high quality papers on theoretical developments and practical applications in applied physics. Original research papers, state-of-the-art reviews, and high quality technical notes are invited for publications.
Further analysis of the References- part 2. Some further analyses about directional recoil, cross sections, galaxy Physics and experiment-optimizations techniques.
VIA Forum Astroparticle Physics Forum COSMOVIA
Author: O.M. Lecian.
Title: LHAASO Further references- part2.
28/03/2020
http://viavca.in2p3.fr/2010c_o_s_m_o_v_i_a__forum_sd24fsdf4zerfzef4ze5f4dsq34sdteerui45788789745rt7yr68t4y54865h45g4hfg56h45df4h86d48h48t7uertujirjtiorjhuiofgrdsqgxcvfghfg5h40yhuyir/viewtopic.php?f=73&t=3705&sid=c56cbf76f87536fc4c3ff216d9edaba2
The distribution and_annihilation_of_dark_matter_around_black_holesSérgio Sacani
Uma nova simulação computacional feita pela NASA mostra que as partículas da matéria escura colidindo na extrema gravidade de um buraco negro pode produzir uma luz de raios-gamma forte e potencialmente observável. Detectando essa emissão forneceria aos astrônomos com uma nova ferramenta para entender tanto os buracos negros como a natureza da matéria escura, uma elusiva substância responsável pela maior parte da massa do universo que nem reflete, absorve ou emite luz.
Ill-posedness formulation of the emission source localization in the radio- d...Ahmed Ammar Rebai PhD
To contact the authors : tarek.salhi@gmail.com and ahmed.rebai2@gmail.com
In the field of radio detection in astroparticle physics, many studies have shown the strong dependence of the solution of the radio-transient sources localization problem (the radio-shower time of arrival on antennas) such solutions are purely numerical artifacts. Based on a detailed analysis of some already published results of radio-detection experiments like : CODALEMA 3 in France, AERA in Argentina and TREND in China, we demonstrate the ill-posed character of this problem in the sens of Hadamard. Two approaches have been used as the existence of solutions degeneration and the bad conditioning of the mathematical formulation problem. A comparison between experimental results and simulations have been made, to highlight the mathematical studies. Many properties of the non-linear least square function are discussed such as the configuration of the set of solutions and the bias.
P-Wave Onset Point Detection for Seismic Signal Using Bhattacharyya DistanceCSCJournals
In seismology Primary p-wave arrival identification is a fundamental problem for the geologist worldwide. Several numbers of algorithms that deal with p-wave onset detection and identification have already been proposed. Accurate p- wave picking is required for earthquake early warning system and determination of epicenter location etc. In this paper we have proposed a novel algorithm for p-wave detection using Bhattacharyya distance for seismic signals. In our study we have taken 50 numbers of real seismic signals (generated by earthquake) recorded by K-NET (Kyoshin network), Japan. Our results show maximum standard deviation of 1.76 sample from true picks which gives better accuracy with respect to ratio test method.
The dosimetry was carried out for radiotherapy patients, and measurements were performed using LiF and thermoluminescent dosimeters (TLDs). Evaluations were done for water-equivalent (effective) thicknesses and target dose with transmission data. Considerations were made for the accuracy of the parameter for the ratio of measured to expected value for each quantity. The entrance dose was estimated as 1.01 ± 0.07. The mean ratio of effective to contour depth was 1.00 ± 0.13, showing a wide distribution reflecting the influence of contour inaccuracies. The mean ratio of the measured contour dose prescription was 1.00 ± 0.07. The difference in depths that is patient and effective depth is a reflection of target dose discrepancies. Graphical simulations were done using Monte-Carlo Simulations and presented.
Estimation of global solar radiation by using machine learning methodsmehmet şahin
In this study, global solar radiation (GSR) was estimated based on 53 locations by using ELM, SVR, KNN, LR and NU-SVR methods. Methods were trained with a two-year data set and accuracy of the mentioned methods was tested with a one-year data set. The data set of each year was consisting of 12 months. Whereas the values of month, altitude, latitude, longitude, vapour pressure deficit and land surface temperature were used as input for developing models, GSR was obtained as output. Values of vapour pressure deficit and land surface temperature were taken from radiometry of NOAA-AVHRR satellite. Estimated solar radiation data were compared with actual data that were obtained from meteorological stations. According to statistical results, most successful method was NU-SVR method. The RMSE and MBE values of NU-SVR method were found to be 1,4972 MJ/m2 and 0,2652 MJ/m2, respectively. R value was 0,9728. Furthermore, worst prediction method was LR. For other methods, RMSE values were changing between 1,7746 MJ/m2 and 2,4546 MJ/m2. It can be seen from the statistical results that ELM, SVR, k-NN and NU-SVR methods can be used for estimation of GSR.
DEEP LEARNING BASED MULTIPLE REGRESSION TO PREDICT TOTAL COLUMN WATER VAPOR (...IJDKP
Total column water vapor is an important factor for the weather and climate. This study apply
deep learning based multiple regression to map the TCWV with elements that can improve
spatiotemporal prediction. In this study, we predict the TCWV with the use of ERA5 that is the
fifth generation ECMWF atmospheric reanalysis of the global climate. We use an appropriate
deep learning based multiple regression algorithm using Keras library to improve nonlinear
prediction between Total Column water vapor and predictors as Mean sea level pressure, Surface
pressure, Sea surface temperature, 100 metre U wind component, 100 metre V wind component,
10 metre U wind component, 10 metre V wind component, 2 metre dew point temperature, 2
metre temperature.
Comparative Calibration Method Between two Different Wavelengths With Aureole...Waqas Tariq
A multi-stage method for calibration of sunphotometer is proposed by combining comparison calibration method between two different wavelengths with aureole observation method for long wavelength calibration. Its effectiveness in reducing the influences for calibration due to molecular and aerosolfs extinction in the unstable turbidity conditions is clarified. By comparing the calculated results with the proposed method and the existing individually calibration method, it is found that the proposed method is superior to the existing method in terms of calibration accuracy. Namely, Through a comparison between ILM and the proposed method using band 0.87um as reference, the largest calibration errors are 0.0014, 0.0428 by PM are lower than that by ILM (0.011,0.0489) for sky radiances with no error and -3~+3%, -5~+5% errors. By analyzing the observation data of 15 days with POM-1 Skyradiometer, the largest standard deviation of calibration constants by PM is 0.02016, and is lower than that by ILM (0.03858).
Comparative Calibration Method Between two Different Wavelengths With Aureole...
DM Measurement with CHIME
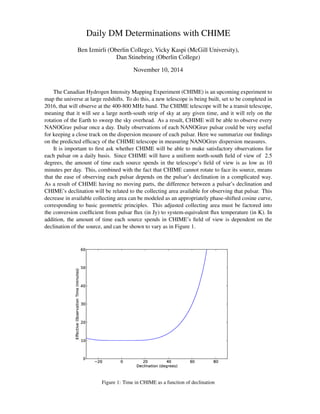
1. Daily DM Determinations with CHIME
Ben Izmirli (Oberlin College), Vicky Kaspi (McGill University),
Dan Stinebring (Oberlin College)
November 10, 2014
The Canadian Hydrogen Intensity Mapping Experiment (CHIME) is an upcoming experiment to
map the universe at large redshifts. To do this, a new telescope is being built, set to be completed in
2016, that will observe at the 400-800 MHz band. The CHIME telescope will be a transit telescope,
meaning that it will see a large north-south strip of sky at any given time, and it will rely on the
rotation of the Earth to sweep the sky overhead. As a result, CHIME will be able to observe every
NANOGrav pulsar once a day. Daily observations of each NANOGrav pulsar could be very useful
for keeping a close track on the dispersion measure of each pulsar. Here we summarize our findings
on the predicted efficacy of the CHIME telescope in measuring NANOGrav dispersion measures.
It is important to first ask whether CHIME will be able to make satisfactory observations for
each pulsar on a daily basis. Since CHIME will have a uniform north-south field of view of 2.5
degrees, the amount of time each source spends in the telescope’s field of view is as low as 10
minutes per day. This, combined with the fact that CHIME cannot rotate to face its source, means
that the ease of observing each pulsar depends on the pulsar’s declination in a complicated way.
As a result of CHIME having no moving parts, the difference between a pulsar’s declination and
CHIME’s declination will be related to the collecting area available for observing that pulsar. This
decrease in available collecting area can be modeled as an appropriately phase-shifted cosine curve,
corresponding to basic geometric principles. This adjusted collecting area must be factored into
the conversion coefficient from pulsar flux (in Jy) to system-equivalent flux temperature (in K). In
addition, the amount of time each source spends in CHIME’s field of view is dependent on the
declination of the source, and can be shown to vary as in Figure 1.
Figure 1: Time in CHIME as a function of declination
2. These two components, the adjusted system-equivalent flux temperature and the adjusted col-
lecting area, are placed into the ideal radiometer equation:
σnoise =
Tsys/gdec
BW × Tfov
,
where Tsys is the system noise plus the sky noise, gdec is the declination-specific flux-temperature
conversion coefficient, BW is the total bandwidth, and Tfov is the declination-specific time in
CHIME’s field of view. Five-sigma is then taken as the detection threshold, and the resultant
function is plotted in Figure 2, with the NANOGrav pulsars (red points) plotted against the five-
sigma threshold observation flux (red line). Most of the NANOGrav pulsars are luckily good
enough sources to be observed by CHIME on a daily basis.
Knowing that NANOGrav’s pulsars are good sources for observation by CHIME, the next
step towards finding the efficacy of DM measurement is to calculate the timing uncertainty per
observation. To do this, a formula proposed by Downs and Reichley1 was used in combination with
amendments by Stinebring and Backer, presented at the Workshop on Impact of Pulsar Timing on
Relativity and Cosmology in July 1990. Using prior knowledge of the pulse profile u(t), the pulse
sharpness Λ is calculated:
Λ =
1
|u (t)|2 dt
From this a timeability factor can be established that relates the ease of timing each pulsar to the
sharpness of its template:
TF =
√
ΛP
Spk
where P is the pulse period, and Spk is the peak flux density. The timing uncertainty is then
approximated by the product of the timeability factor and σnoise:
σtiming = TF × σnoise
Figure 2: Detection Threshold plotted against NANOGrav Pulsars
1
1983, Astrophysics Journal Supplement, vol.53, p.169
2
3. Using this method, we sought to reproduce the timing uncertainties reported in the Demorest et
al. 2012 data release paper2. We found that the TOA uncertainties calculated through the Downs-
Reichley-Stinebring-Backer method form a convincing upper bound to the actual RMS TOA error.
As seen in Figure 3, the actual timing uncertainty value is no larger than the predicted value in
90% of cases, and the predicted value is within one order of magnitude of the actual value in 85%
of cases, making this method a good worst-case estimator of timing uncertainty.
Finally, the expected DM uncertainties from daily measurements must be computed from the
calculated timing uncertainties. Since DM manifests as a frequency-squared lag across the band,
the only way to calculate DM is to split the band into multiple subbands and infer the DM from
the difference in the arrival times of the pulse in each of the subbands. An investigation into the
optimal number of subbands for this calculation revealed that the number of subbands does not have
a significant order-of-magnitude impact on the measurement uncertainty (Figure 4). Assuming the
use of a least-squares fitting paradigm to calculate the DM parameter from the arrival times of the
pulse in each of the subbands, the uncertainty associated with this least-squares fit was derived,
yielding the DM measurement uncertainty, in DM units:
V ar(DM) =
1/D2
Σwi( 1
ν2
i
− < 1
ν2
i
>)2
,
where D is the dispersion constant, ν is the center frequency of the subband, and w is the weight-
ing factor 1
σ2
timing
. This DM uncertainty was calculated for the NANOGrav pulsars, and Figure 5
shows that many NANOGrav pulsars being observed by CHIME will have daily DM determina-
tions with uncertainties better than 10−3 pc cm−3. (Only those pulsars for which we had enough
data to perform the calculation were plotted in Figure 5.) These have been plotted together with
NANOGrav’s current DM measurement uncertainties. (Note that the CHIME daily measurements
could be averaged together, further improving this plotted uncertainty.) We see that in many cases
CHIME may be able to altogether eliminate the need to use other NANOGrav telescopes for DM
measurement.
Figure 3: Note that ”low” and ”high” indicate the low and high
observation frequencies for each respective pulsar in this dataset.
2
Demorest, P. B., R. D. Ferdman, M. E. Gonzalez, D. Nice, S. Ransom, I. H. Stairs, et al. ”Limits on the Stochas-
tic Gravitational Wave Background from the North American Nanohertz Observatory for Gravitational Waves.” arXiv
(2012)
3
4. In conclusion, we find that the CHIME telescope will be able to precisely measure NANOGrav
pulsar DMs on a daily basis, with precision comparable to current NANOGrav DM measurements.
Yet, further work remains to be done. Most significantly, a method of averaging the daily DM mea-
surements to produce more precise values would allow even better measurements of the dispersion
measure. Taking this averaging into account, it is likely that the CHIME telescope will be able to
improve upon the precision of NANOGrav pulsar DM measurements.
Figure 4: The DM uncertainty is seen not to change significantly (order-of-magnitude)
as a function of the number of channels used in the least-squares fit.
Figure 5: The projected worst-case daily DM measurement uncertainties
compare favorably to the current NANOGrav DM measurement uncertainties,
indicating that CHIME will be a good resource for up-to-date DM measurements.