Download to read offline
![arXiv:1504.03320v1[astro-ph.GA]13Apr2015
DRAFT VERSION APRIL 15, 2015
Preprint typeset using LATEX style emulateapj v. 12/16/11
SPECTROSCOPIC CONFIRMATION OF THE EXISTENCE OF LARGE, DIFFUSE GALAXIES IN THE COMA CLUSTER
PIETER G. VAN DOKKUM
1
, AARON J. ROMANOWSKY
2,3
, ROBERTO ABRAHAM
4
, JEAN P. BRODIE
3
, CHARLIE CONROY
5
, MARLA
GEHA
1
, ALLISON MERRITT
1
, ALEXA VILLAUME
3
, JIELAI ZHANG
4
Draft version April 15, 2015
ABSTRACT
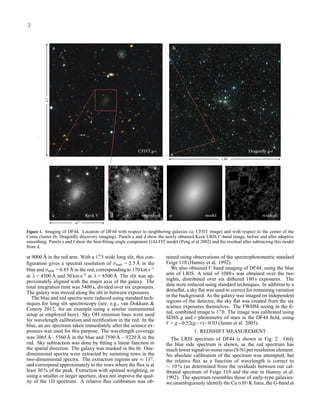
We recently identified a population of low surface brightness objects in the field of the z = 0.023 Coma cluster,
using the Dragonfly Telephoto Array. Here we present Keck spectroscopy of one of the largest of these “ultra-
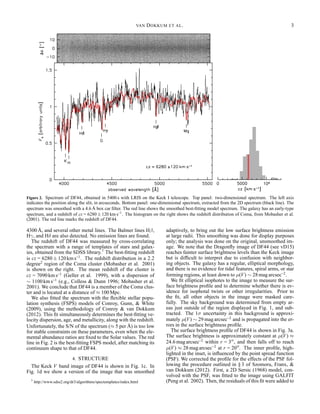
diffuse galaxies” (UDGs), confirming that it is a member of the cluster. The galaxy has prominent absorption
features, including the Ca II H+K lines and the G-band, and no detected emission lines. Its radial velocity of
cz = 6280±120km/s is within the 1σ velocity dispersion of the Coma cluster. The galaxy has an effective radius
of 4.3 ± 0.3kpc and a Sersic index of 0.89 ± 0.06, as measured from Keck imaging. We find no indications
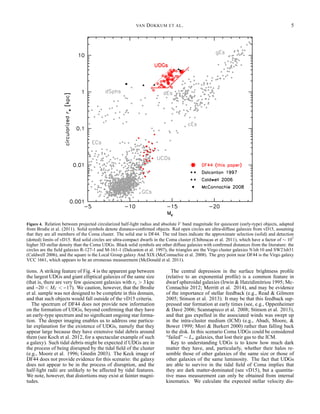
of tidal tails or other distortions, at least out to a radius of ∼ 2re. We show that UDGs are located in a
previously sparsely populated region of the size – magnitude plane of quiescent stellar systems, as they are ∼ 6
magnitudes fainter than normal early-type galaxies of the same size. It appears that the luminosity distribution
of large quiescent galaxies is not continuous, although this could largely be due to selection effects. Dynamical
measurements are needed to determine whether the dark matter halos of UDGs are similar to those of galaxies
with the same luminosity or to those of galaxies with the same size.
Keywords: galaxies: clusters: individual (Coma) — galaxies: evolution — galaxies: structure
1. INTRODUCTION
In the Spring of 2014 we obtained wide-field (3◦
× 3◦
)
observations of the Coma cluster with the Dragonfly Tele-
photo Array (Abraham & van Dokkum 2014). These images
have low spatial resolution (≈ 6′′
), but reach surface bright-
ness limits of µ(g) ∼ 29.3 mag arcsec−2
. We found a popu-
lation of spatially-extended, low surface brightness objects
in these images (van Dokkum et al. 2015). After combin-
ing the data with higher resolution imaging from the Sloan
Digital Sky Survey (SDSS) and the Canada France Hawaii
Telescope (CFHT), we identified 47 objects with effective
radii in the range re = 3′′
−10′′
and central surface brightness
µ(g,0) = 24 −26mag arcsec−2
.
Based on the spatial distribution of the objects, and the
smooth appearance of one of them in a deep Hubble Space
Telescope Advanced Camera for Surveys image, we con-
cluded that they are probably galaxies in the Coma cluster.
The Coma cluster has a radial velocity of cz = 7090 km s−1
(Geller, Diaferio, & Kurtz 1999), and for a Hubble con-
stant of 70 km s−1
Mpc−1
this implies a distance of ≈ 100 Mpc
(DA = 98 Mpc and DL = 103 Mpc). This distance places the
galaxies in an interesting region of parameter space: with ef-
fective radii of reff = 1.5 kpc – 4.6 kpc their sizes are similar
to those of ∼ L∗ galaxies, even though their luminosities, col-
ors, axis ratios, and Sersic (1968) indices are similar to those
of dwarf spheroidal galaxies. In van Dokkum et al. (2015)
[vD15] we used the term “ultra-diffuse galaxies”, or UDGs, to
distinguish these large, relatively round, diffuse objects from
the general classes of dwarf galaxies and low surface bright-
1 Department of Astronomy, Yale University, New Haven, CT 06511,
USA
2 Department of Physics and Astronomy, San José State University, San
Jose, CA 95192, USA
3 University of California Observatories, 1156 High Street, Santa Cruz,
CA 95064, USA
4 Department of Astronomy & Astrophysics, University of Toronto, 50
St. George St., Toronto, ON M5S 3H4 Canada
5 Harvard-Smithsonian Center for Astrophysics, 60 Garden St., Cam-
bridge, MA, USA
ness galaxies.
Although it is plausible that most or all of the 47 galaxies
are indeed Coma cluster members, this can only be confirmed
with secure distance measurements. This is particularly im-
portant for the largest galaxies: it may be that only the galax-
ies with the smallest apparent sizes are at ∼ 100 Mpc, and that
the largest ones are considerably closer (see, e.g., Merritt, van
Dokkum, & Abraham 2014). Here we present spectroscopy
and imaging with the 10 m W.M. Keck Observatory of the
largest galaxy in the vD15 sample, DF44. The goal of the
spectroscopy is to test whether the galaxy is, in fact, in the
Coma cluster. The imaging provides improved measurements
of its morphology and structural parameters.
2. OBSERVATIONS AND REDUCTION
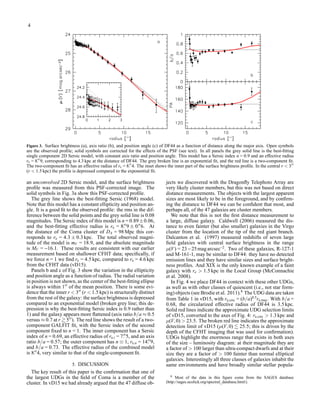
Galaxy DF44 (α = 13h
00m
58.0s
; δ = 26◦
58′
35′′
) was cho-
sen because it is the largest (and second-brightest) galaxy in
the sample of vD15. It has a major-axis effective radius of
9.′′
8 and an integrated apparent magnitude of mg = 19.4, as
measured from CFHT images (see Fig. 1a).6
The effective
radius was derived by fitting a 2D Sersic profile. The Sersic
index was fixed to n = 1 (exponential) in this fit, as the S/N
in the CFHT images is not sufficiently high to measure n re-
liably (see vD15). In Sect. 4 we update these measurements
using deeper imaging from Keck. As shown in Fig. 1a, DF44
does not have bright neighbors. It is at a projected distance of
1.◦
04 from the center of the cluster, corresponding to 1.8 Mpc
or ∼ 0.6 × R200 (Kubo et al. 2007).
The galaxy was observed 2014 December 18 and 19, using
the Low Resolution Imaging Spectrometer (LRIS; Oke et al.
1995) on the Keck I telescope. Conditions were mostly clear.
The 600 lines mm−1
grism blazed at 4000 Å was used in the
blue arm, and the gold-coated 1200 lines mm−1
grating blazed
6 DF44 is also featured in Fig. 1 of vD15. A careful reader may note that
the location of DF44 within the Coma field appears to be different in that
paper. The apparent location of DF44 in vD15 is, indeed, incorrect; the red
square in the Dragonfly image belongs to another one of the four highlighted
galaxies.](https://image.slidesharecdn.com/spectroscopicconfirmationoftheexistenceoflargediffusegalaxiesinthecomacluster-150518002922-lva1-app6892/85/Spectroscopic-confirmation-of_the_existence_of_large_diffuse_galaxies_in_the_coma_cluster-1-320.jpg)
![arXiv:1504.03320v1[astro-ph.GA]13Apr2015
DRAFT VERSION APRIL 15, 2015
Preprint typeset using LATEX style emulateapj v. 12/16/11
SPECTROSCOPIC CONFIRMATION OF THE EXISTENCE OF LARGE, DIFFUSE GALAXIES IN THE COMA CLUSTER
PIETER G. VAN DOKKUM
1
, AARON J. ROMANOWSKY
2,3
, ROBERTO ABRAHAM
4
, JEAN P. BRODIE
3
, CHARLIE CONROY
5
, MARLA
GEHA
1
, ALLISON MERRITT
1
, ALEXA VILLAUME
3
, JIELAI ZHANG
4
Draft version April 15, 2015
ABSTRACT
We recently identified a population of low surface brightness objects in the field of the z = 0.023 Coma cluster,
using the Dragonfly Telephoto Array. Here we present Keck spectroscopy of one of the largest of these “ultra-
diffuse galaxies” (UDGs), confirming that it is a member of the cluster. The galaxy has prominent absorption
features, including the Ca II H+K lines and the G-band, and no detected emission lines. Its radial velocity of
cz = 6280±120km/s is within the 1σ velocity dispersion of the Coma cluster. The galaxy has an effective radius
of 4.3 ± 0.3kpc and a Sersic index of 0.89 ± 0.06, as measured from Keck imaging. We find no indications
of tidal tails or other distortions, at least out to a radius of ∼ 2re. We show that UDGs are located in a
previously sparsely populated region of the size – magnitude plane of quiescent stellar systems, as they are ∼ 6
magnitudes fainter than normal early-type galaxies of the same size. It appears that the luminosity distribution
of large quiescent galaxies is not continuous, although this could largely be due to selection effects. Dynamical
measurements are needed to determine whether the dark matter halos of UDGs are similar to those of galaxies
with the same luminosity or to those of galaxies with the same size.
Keywords: galaxies: clusters: individual (Coma) — galaxies: evolution — galaxies: structure
1. INTRODUCTION
In the Spring of 2014 we obtained wide-field (3◦
× 3◦
)
observations of the Coma cluster with the Dragonfly Tele-
photo Array (Abraham & van Dokkum 2014). These images
have low spatial resolution (≈ 6′′
), but reach surface bright-
ness limits of µ(g) ∼ 29.3 mag arcsec−2
. We found a popu-
lation of spatially-extended, low surface brightness objects
in these images (van Dokkum et al. 2015). After combin-
ing the data with higher resolution imaging from the Sloan
Digital Sky Survey (SDSS) and the Canada France Hawaii
Telescope (CFHT), we identified 47 objects with effective
radii in the range re = 3′′
−10′′
and central surface brightness
µ(g,0) = 24 −26mag arcsec−2
.
Based on the spatial distribution of the objects, and the
smooth appearance of one of them in a deep Hubble Space
Telescope Advanced Camera for Surveys image, we con-
cluded that they are probably galaxies in the Coma cluster.
The Coma cluster has a radial velocity of cz = 7090 km s−1
(Geller, Diaferio, & Kurtz 1999), and for a Hubble con-
stant of 70 km s−1
Mpc−1
this implies a distance of ≈ 100 Mpc
(DA = 98 Mpc and DL = 103 Mpc). This distance places the
galaxies in an interesting region of parameter space: with ef-
fective radii of reff = 1.5 kpc – 4.6 kpc their sizes are similar
to those of ∼ L∗ galaxies, even though their luminosities, col-
ors, axis ratios, and Sersic (1968) indices are similar to those
of dwarf spheroidal galaxies. In van Dokkum et al. (2015)
[vD15] we used the term “ultra-diffuse galaxies”, or UDGs, to
distinguish these large, relatively round, diffuse objects from
the general classes of dwarf galaxies and low surface bright-
1 Department of Astronomy, Yale University, New Haven, CT 06511,
USA
2 Department of Physics and Astronomy, San José State University, San
Jose, CA 95192, USA
3 University of California Observatories, 1156 High Street, Santa Cruz,
CA 95064, USA
4 Department of Astronomy & Astrophysics, University of Toronto, 50
St. George St., Toronto, ON M5S 3H4 Canada
5 Harvard-Smithsonian Center for Astrophysics, 60 Garden St., Cam-
bridge, MA, USA
ness galaxies.
Although it is plausible that most or all of the 47 galaxies
are indeed Coma cluster members, this can only be confirmed
with secure distance measurements. This is particularly im-
portant for the largest galaxies: it may be that only the galax-
ies with the smallest apparent sizes are at ∼ 100 Mpc, and that
the largest ones are considerably closer (see, e.g., Merritt, van
Dokkum, & Abraham 2014). Here we present spectroscopy
and imaging with the 10 m W.M. Keck Observatory of the
largest galaxy in the vD15 sample, DF44. The goal of the
spectroscopy is to test whether the galaxy is, in fact, in the
Coma cluster. The imaging provides improved measurements
of its morphology and structural parameters.
2. OBSERVATIONS AND REDUCTION
Galaxy DF44 (α = 13h
00m
58.0s
; δ = 26◦
58′
35′′
) was cho-
sen because it is the largest (and second-brightest) galaxy in
the sample of vD15. It has a major-axis effective radius of
9.′′
8 and an integrated apparent magnitude of mg = 19.4, as
measured from CFHT images (see Fig. 1a).6
The effective
radius was derived by fitting a 2D Sersic profile. The Sersic
index was fixed to n = 1 (exponential) in this fit, as the S/N
in the CFHT images is not sufficiently high to measure n re-
liably (see vD15). In Sect. 4 we update these measurements
using deeper imaging from Keck. As shown in Fig. 1a, DF44
does not have bright neighbors. It is at a projected distance of
1.◦
04 from the center of the cluster, corresponding to 1.8 Mpc
or ∼ 0.6 × R200 (Kubo et al. 2007).
The galaxy was observed 2014 December 18 and 19, using
the Low Resolution Imaging Spectrometer (LRIS; Oke et al.
1995) on the Keck I telescope. Conditions were mostly clear.
The 600 lines mm−1
grism blazed at 4000 Å was used in the
blue arm, and the gold-coated 1200 lines mm−1
grating blazed
6 DF44 is also featured in Fig. 1 of vD15. A careful reader may note that
the location of DF44 within the Coma field appears to be different in that
paper. The apparent location of DF44 in vD15 is, indeed, incorrect; the red
square in the Dragonfly image belongs to another one of the four highlighted
galaxies.](https://image.slidesharecdn.com/spectroscopicconfirmationoftheexistenceoflargediffusegalaxiesinthecomacluster-150518002922-lva1-app6892/75/Spectroscopic-confirmation-of_the_existence_of_large_diffuse_galaxies_in_the_coma_cluster-1-2048.jpg)

This document presents the spectroscopic confirmation of an ultra-diffuse galaxy (UDG) identified in the Coma cluster, focusing on the galaxy df44. The spectroscopy reveals distinct absorption features and establishes it as a cluster member with a redshift of cz = 6280 ± 120 km/s, categorizing it among large quiescent galaxies. The study emphasizes that UDGs, which are much dimmer than typical early-type galaxies of comparable size, occupy an unusual region in the size-magnitude plane, suggesting a gap in the luminosity distribution of such galaxies.


![Polymer [ बहुलक ] Chemistry Notes PDF - Irfanullah Mehar - JJ Sir Chemistry.pdf](https://cdn.slidesharecdn.com/ss_thumbnails/polymerchemistrynotespdf-irfanullahmehar-jjsirchemistry-260210172118-3f9b37f7-thumbnail.jpg?width=640&height=640&fit=bounds)


