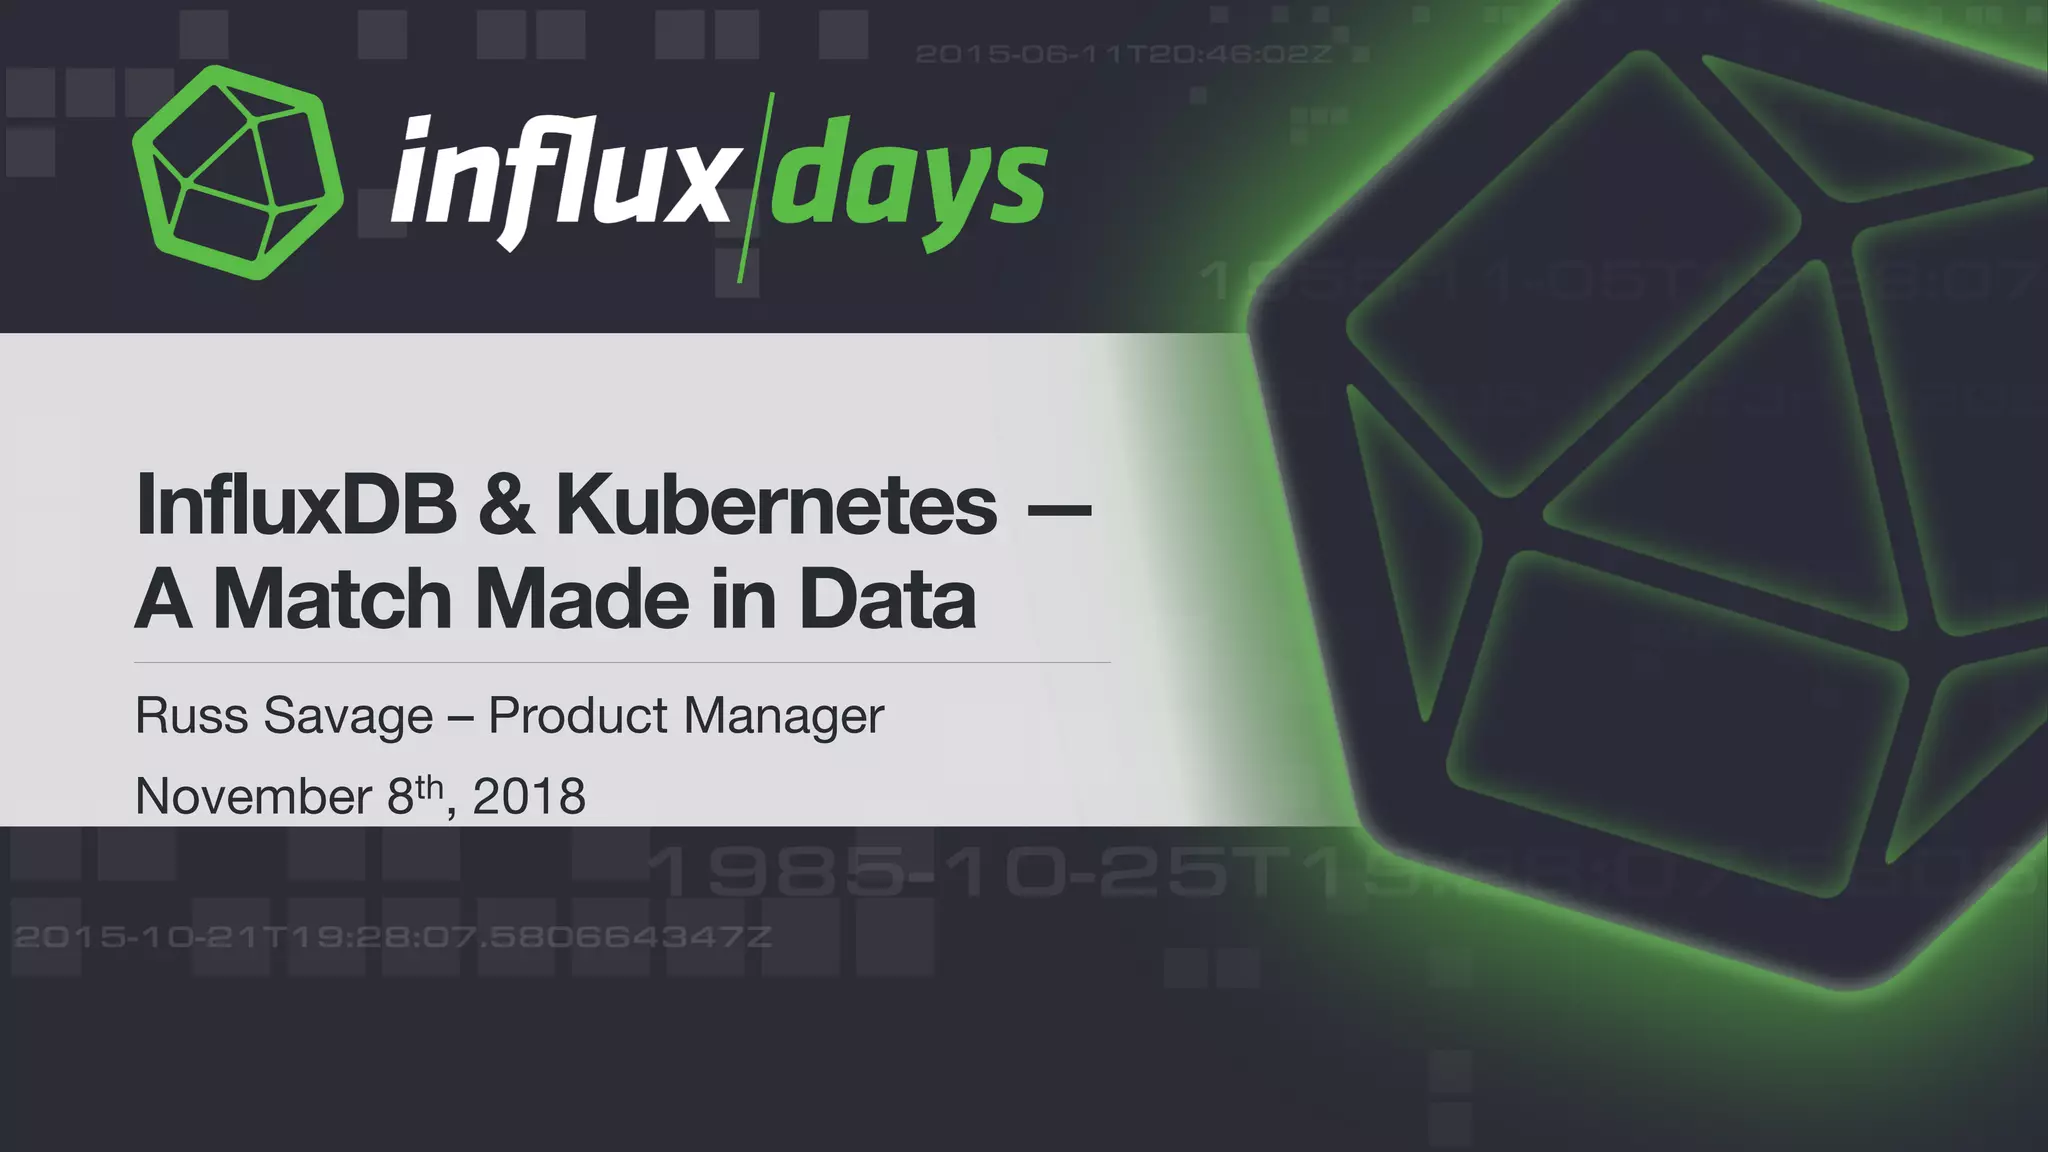
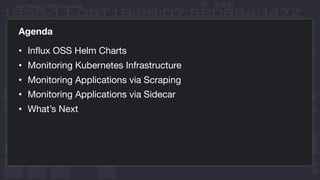
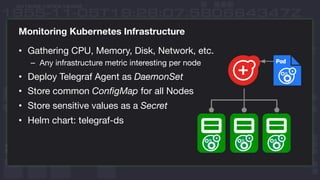
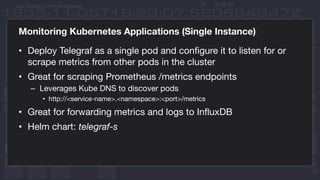
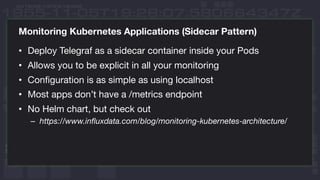
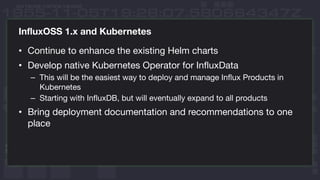
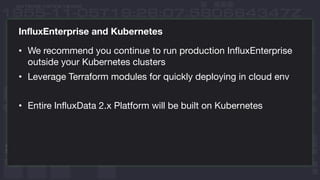
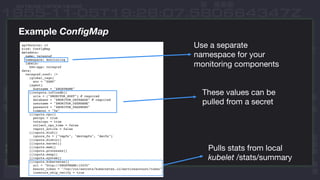
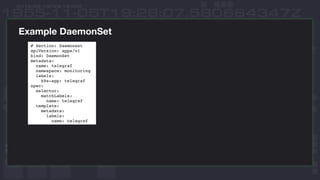
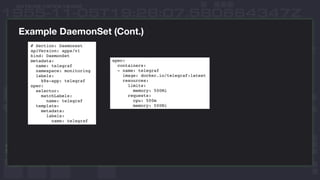
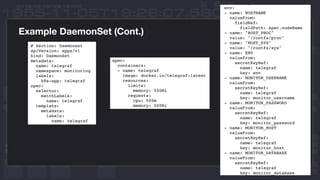
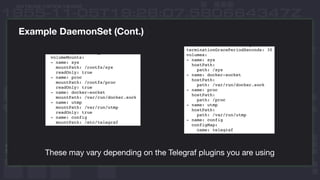
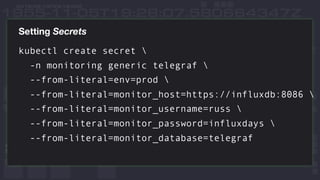
Russ Savage – Product Manager
November 8th, 2018
InfluxDB & Kubernetes —
A Match Made in Data
Agenda
• Influx OSS Helm Charts
• Monitoring Kubernetes Infrastructure
• Monitoring Applications via Scraping
• Monitoring Applications via Sidecar
• What’s Next
InfluxData Helm Charts https://github.com/influxdata/tick-charts
Deploy InfluxDB and
Chronograf in GKE
Monitoring Kubernetes Infrastructure
• Gathering CPU, Memory, Disk, Network, etc.
– Any infrastructure metric interesting per node
• Deploy Telegraf Agent as DaemonSet
• Store common ConfigMap for all Nodes
• Store sensitive values as a Secret
• Helm chart: telegraf-ds
Deploy Telegraf DaemonSet
via Helm Charts
Useful Telegraf Plugins per Node
• cpu
– Collects standard CPU metrics as
defined in `man proc`
• disk
– Gathers metrics about disk usage
• docker
– Uses the Official Docker Client to
gather stats from the Engine API
• diskio
– Gathers metrics about disk traffic
and timing
• kernel
– Gathers info about the kernel that
doesn't fit into other plugins
• kubernetes
– Talks to the kubelet api using the
/stats/summary endpoint
• mem
– Collects system memory metrics
• processes
– Gathers info about the total number
of processes and groups them by
status
• swap
– Collects system swap metrics
• system
– Gathers general stats on system
load, uptime
Monitoring Kubernetes Applications (Single Instance)
• Deploy Telegraf as a single pod and configure it to listen for or
scrape metrics from other pods in the cluster
• Great for scraping Prometheus /metrics endpoints
– Leverages Kube DNS to discover pods
• http://<service-name>.<namespace>:<port>/metrics
• Great for forwarding metrics and logs to InfluxDB
• Helm chart: telegraf-s
Deploy Telegraf Single Pod
via Helm Charts
Monitoring Kubernetes Applications (Sidecar Pattern)
• Deploy Telegraf as a sidecar container inside your Pods
• Allows you to be explicit in all your monitoring
• Configuration is as simple as using localhost
• Most apps don’t have a /metrics endpoint
• No Helm chart, but check out
– https://www.influxdata.com/blog/monitoring-kubernetes-architecture/
The Future of Influx and
Kubernetes
InfluxOSS 1.x and Kubernetes
• Continue to enhance the existing Helm charts
• Develop native Kubernetes Operator for InfluxData
– This will be the easiest way to deploy and manage Influx Products in
Kubernetes
– Starting with InfluxDB, but will eventually expand to all products
• Bring deployment documentation and recommendations to one
place
Deploy InfluxData Operator
InfluxEnterprise and Kubernetes
• We recommend you continue to run production InfluxEnterprise
outside your Kubernetes clusters
• Leverage Terraform modules for quickly deploying in cloud env
• Entire InfluxData 2.x Platform will be built on Kubernetes
Thank You
Example ConfigMap
Example ConfigMap
Use a separate
namespace for your
monitoring components
These values can be
pulled from a secret
Pulls stats from local
kubelet /stats/summary
Example DaemonSet
Example DaemonSet (Cont.)
These may vary depending on the Telegraf plugins you are using
Setting Secrets
kubectl create secret 
-n monitoring generic telegraf 
--from-literal=env=prod 
--from-literal=monitor_host=https://influxdb:8086 
--from-literal=monitor_username=russ 
--from-literal=monitor_password=influxdays 
--from-literal=monitor_database=telegraf

InfluxDB & Kubernetes

  • 1.
    Russ Savage –Product Manager November 8th, 2018 InfluxDB & Kubernetes — A Match Made in Data
  • 2.
    Agenda • Influx OSSHelm Charts • Monitoring Kubernetes Infrastructure • Monitoring Applications via Scraping • Monitoring Applications via Sidecar • What’s Next
  • 3.
    InfluxData Helm Chartshttps://github.com/influxdata/tick-charts
  • 4.
  • 5.
    Monitoring Kubernetes Infrastructure •Gathering CPU, Memory, Disk, Network, etc. – Any infrastructure metric interesting per node • Deploy Telegraf Agent as DaemonSet • Store common ConfigMap for all Nodes • Store sensitive values as a Secret • Helm chart: telegraf-ds
  • 6.
  • 7.
    Useful Telegraf Pluginsper Node • cpu – Collects standard CPU metrics as defined in `man proc` • disk – Gathers metrics about disk usage • docker – Uses the Official Docker Client to gather stats from the Engine API • diskio – Gathers metrics about disk traffic and timing • kernel – Gathers info about the kernel that doesn't fit into other plugins • kubernetes – Talks to the kubelet api using the /stats/summary endpoint • mem – Collects system memory metrics • processes – Gathers info about the total number of processes and groups them by status • swap – Collects system swap metrics • system – Gathers general stats on system load, uptime
  • 8.
    Monitoring Kubernetes Applications(Single Instance) • Deploy Telegraf as a single pod and configure it to listen for or scrape metrics from other pods in the cluster • Great for scraping Prometheus /metrics endpoints – Leverages Kube DNS to discover pods • http://<service-name>.<namespace>:<port>/metrics • Great for forwarding metrics and logs to InfluxDB • Helm chart: telegraf-s
  • 9.
    Deploy Telegraf SinglePod via Helm Charts
  • 10.
    Monitoring Kubernetes Applications(Sidecar Pattern) • Deploy Telegraf as a sidecar container inside your Pods • Allows you to be explicit in all your monitoring • Configuration is as simple as using localhost • Most apps don’t have a /metrics endpoint • No Helm chart, but check out – https://www.influxdata.com/blog/monitoring-kubernetes-architecture/
  • 11.
    The Future ofInflux and Kubernetes
  • 12.
    InfluxOSS 1.x andKubernetes • Continue to enhance the existing Helm charts • Develop native Kubernetes Operator for InfluxData – This will be the easiest way to deploy and manage Influx Products in Kubernetes – Starting with InfluxDB, but will eventually expand to all products • Bring deployment documentation and recommendations to one place
  • 13.
  • 14.
    InfluxEnterprise and Kubernetes •We recommend you continue to run production InfluxEnterprise outside your Kubernetes clusters • Leverage Terraform modules for quickly deploying in cloud env • Entire InfluxData 2.x Platform will be built on Kubernetes
  • 15.
  • 16.
  • 17.
    Example ConfigMap Use aseparate namespace for your monitoring components These values can be pulled from a secret Pulls stats from local kubelet /stats/summary
  • 18.
  • 19.
  • 20.
  • 21.
    Example DaemonSet (Cont.) Thesemay vary depending on the Telegraf plugins you are using
  • 22.
    Setting Secrets kubectl createsecret -n monitoring generic telegraf --from-literal=env=prod --from-literal=monitor_host=https://influxdb:8086 --from-literal=monitor_username=russ --from-literal=monitor_password=influxdays --from-literal=monitor_database=telegraf