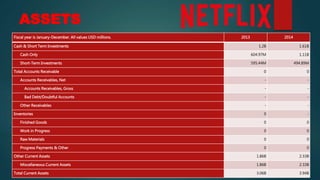
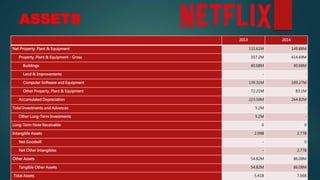
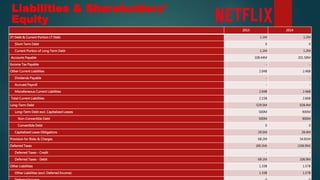
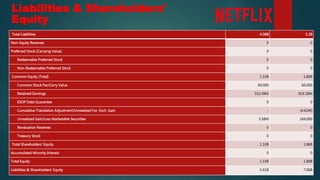
ASSETS
 An asset is a resource that a corporation like Netflix owns and has
economic value.
 The two major types of assets are: fixed assets like real estate, plant and
machinery.
 So, the total asset value for NFLX for the last Quarter is 7.06B.
 It’s easy to associate the term with manufacturing companies, which invest
a lot in factories and equipment.
ASSETS
Fiscal year is January-December. All values USD millions. 2013 2014
Cash & Short Term Investments 1.2B 1.61B
Cash Only 604.97M 1.11B
Short-Term Investments 595.44M 494.89M
Total Accounts Receivable 0 0
Accounts Receivables, Net - -
Accounts Receivables, Gross - -
Bad Debt/Doubtful Accounts - -
Other Receivables - -
Inventories 0 -
Finished Goods 0 0
Work in Progress 0 0
Raw Materials 0 0
Progress Payments & Other 0 0
Other Current Assets 1.86B 2.33B
Miscellaneous Current Assets 1.86B 2.33B
Total Current Assets 3.06B 3.94B
ASSETS
2013 2014
Net Property, Plant & Equipment 133.61M 149.88M
Property, Plant & Equipment - Gross 357.2M 414.69M
Buildings 40.68M 40.68M
Land & Improvements - -
Computer Software and Equipment 139.31M 189.27M
Other Property, Plant & Equipment 72.21M 83.1M
Accumulated Depreciation 223.59M 264.82M
Total Investments and Advances 5.2M -
Other Long-Term Investments 5.2M -
Long-Term Note Receivable 0 0
Intangible Assets 2.09B 2.77B
Net Goodwill - 0
Net Other Intangibles - 2.77B
Other Assets 54.82M 86.08M
Tangible Other Assets 54.82M 86.08M
Total Assets 5.41B 7.06B
LIABILITIES
Liabilities include short term loans and long term loans availed by the company to fund its business
operations. NFLX had total liabilities of 5.2B for 2014.
 Between 2013 to 2014; Netflix total asset increased by 5.41 to 7.06 billion. Which means total
growth of assets of Netflix is 30.38%.
 By the by we can see a short term investment growth from 60% to 34% by which there is a dramatic
increase in total assets of Netflix.
Liabilities & Shareholders'
Equity
2013 2014
ST Debt & Current Portion LT Debt 1.1M 1.2M
Short Term Debt 0 0
Current Portion of Long Term Debt 1.1M 1.2M
Accounts Payable 108.44M 201.58M
Income Tax Payable - -
Other Current Liabilities 2.04B 2.46B
Dividends Payable - -
Accrued Payroll - -
Miscellaneous Current Liabilities 2.04B 2.46B
Total Current Liabilities 2.15B 2.66B
Long-Term Debt 529.5M 928.4M
Long-Term Debt excl. Capitalized Leases 500M 900M
Non-Convertible Debt 500M 900M
Convertible Debt 0 0
Capitalized Lease Obligations 29.5M 28.4M
Provision for Risks & Charges 68.2M 34.81M
Deferred Taxes (69.1M) (106.9M)
Deferred Taxes - Credit - -
Deferred Taxes - Debit 69.1M 106.9M
Other Liabilities 1.33B 1.57B
Other Liabilities (excl. Deferred Income) 1.33B 1.57B
Liabilities & Shareholders'
Equity
Total Liabilities 4.08B 5.2B
Non-Equity Reserves 0 0
Preferred Stock (Carrying Value) 0 0
Redeemable Preferred Stock 0 0
Non-Redeemable Preferred Stock 0 0
Common Equity (Total) 1.33B 1.86B
Common Stock Par/Carry Value 60,000 60,000
Retained Earnings 552.49M 819.28M
ESOP Debt Guarantee 0 0
Cumulative Translation Adjustment/Unrealized For. Exch. Gain - (4.62M)
Unrealized Gain/Loss Marketable Securities 3.58M 169,000
Revaluation Reserves 0 0
Treasury Stock 0 0
Total Shareholders' Equity 1.33B 1.86B
Accumulated Minority Interest 0 0
Total Equity 1.33B 1.86B
Liabilities & Shareholders' Equity 5.41B 7.06B

netflix

  • 2.
    ASSETS  An assetis a resource that a corporation like Netflix owns and has economic value.  The two major types of assets are: fixed assets like real estate, plant and machinery.  So, the total asset value for NFLX for the last Quarter is 7.06B.  It’s easy to associate the term with manufacturing companies, which invest a lot in factories and equipment.
  • 3.
    ASSETS Fiscal year isJanuary-December. All values USD millions. 2013 2014 Cash & Short Term Investments 1.2B 1.61B Cash Only 604.97M 1.11B Short-Term Investments 595.44M 494.89M Total Accounts Receivable 0 0 Accounts Receivables, Net - - Accounts Receivables, Gross - - Bad Debt/Doubtful Accounts - - Other Receivables - - Inventories 0 - Finished Goods 0 0 Work in Progress 0 0 Raw Materials 0 0 Progress Payments & Other 0 0 Other Current Assets 1.86B 2.33B Miscellaneous Current Assets 1.86B 2.33B Total Current Assets 3.06B 3.94B
  • 4.
    ASSETS 2013 2014 Net Property,Plant & Equipment 133.61M 149.88M Property, Plant & Equipment - Gross 357.2M 414.69M Buildings 40.68M 40.68M Land & Improvements - - Computer Software and Equipment 139.31M 189.27M Other Property, Plant & Equipment 72.21M 83.1M Accumulated Depreciation 223.59M 264.82M Total Investments and Advances 5.2M - Other Long-Term Investments 5.2M - Long-Term Note Receivable 0 0 Intangible Assets 2.09B 2.77B Net Goodwill - 0 Net Other Intangibles - 2.77B Other Assets 54.82M 86.08M Tangible Other Assets 54.82M 86.08M Total Assets 5.41B 7.06B
  • 5.
    LIABILITIES Liabilities include shortterm loans and long term loans availed by the company to fund its business operations. NFLX had total liabilities of 5.2B for 2014.  Between 2013 to 2014; Netflix total asset increased by 5.41 to 7.06 billion. Which means total growth of assets of Netflix is 30.38%.  By the by we can see a short term investment growth from 60% to 34% by which there is a dramatic increase in total assets of Netflix.
  • 6.
    Liabilities & Shareholders' Equity 20132014 ST Debt & Current Portion LT Debt 1.1M 1.2M Short Term Debt 0 0 Current Portion of Long Term Debt 1.1M 1.2M Accounts Payable 108.44M 201.58M Income Tax Payable - - Other Current Liabilities 2.04B 2.46B Dividends Payable - - Accrued Payroll - - Miscellaneous Current Liabilities 2.04B 2.46B Total Current Liabilities 2.15B 2.66B Long-Term Debt 529.5M 928.4M Long-Term Debt excl. Capitalized Leases 500M 900M Non-Convertible Debt 500M 900M Convertible Debt 0 0 Capitalized Lease Obligations 29.5M 28.4M Provision for Risks & Charges 68.2M 34.81M Deferred Taxes (69.1M) (106.9M) Deferred Taxes - Credit - - Deferred Taxes - Debit 69.1M 106.9M Other Liabilities 1.33B 1.57B Other Liabilities (excl. Deferred Income) 1.33B 1.57B
  • 7.
    Liabilities & Shareholders' Equity TotalLiabilities 4.08B 5.2B Non-Equity Reserves 0 0 Preferred Stock (Carrying Value) 0 0 Redeemable Preferred Stock 0 0 Non-Redeemable Preferred Stock 0 0 Common Equity (Total) 1.33B 1.86B Common Stock Par/Carry Value 60,000 60,000 Retained Earnings 552.49M 819.28M ESOP Debt Guarantee 0 0 Cumulative Translation Adjustment/Unrealized For. Exch. Gain - (4.62M) Unrealized Gain/Loss Marketable Securities 3.58M 169,000 Revaluation Reserves 0 0 Treasury Stock 0 0 Total Shareholders' Equity 1.33B 1.86B Accumulated Minority Interest 0 0 Total Equity 1.33B 1.86B Liabilities & Shareholders' Equity 5.41B 7.06B