Download as PDF, PPTX
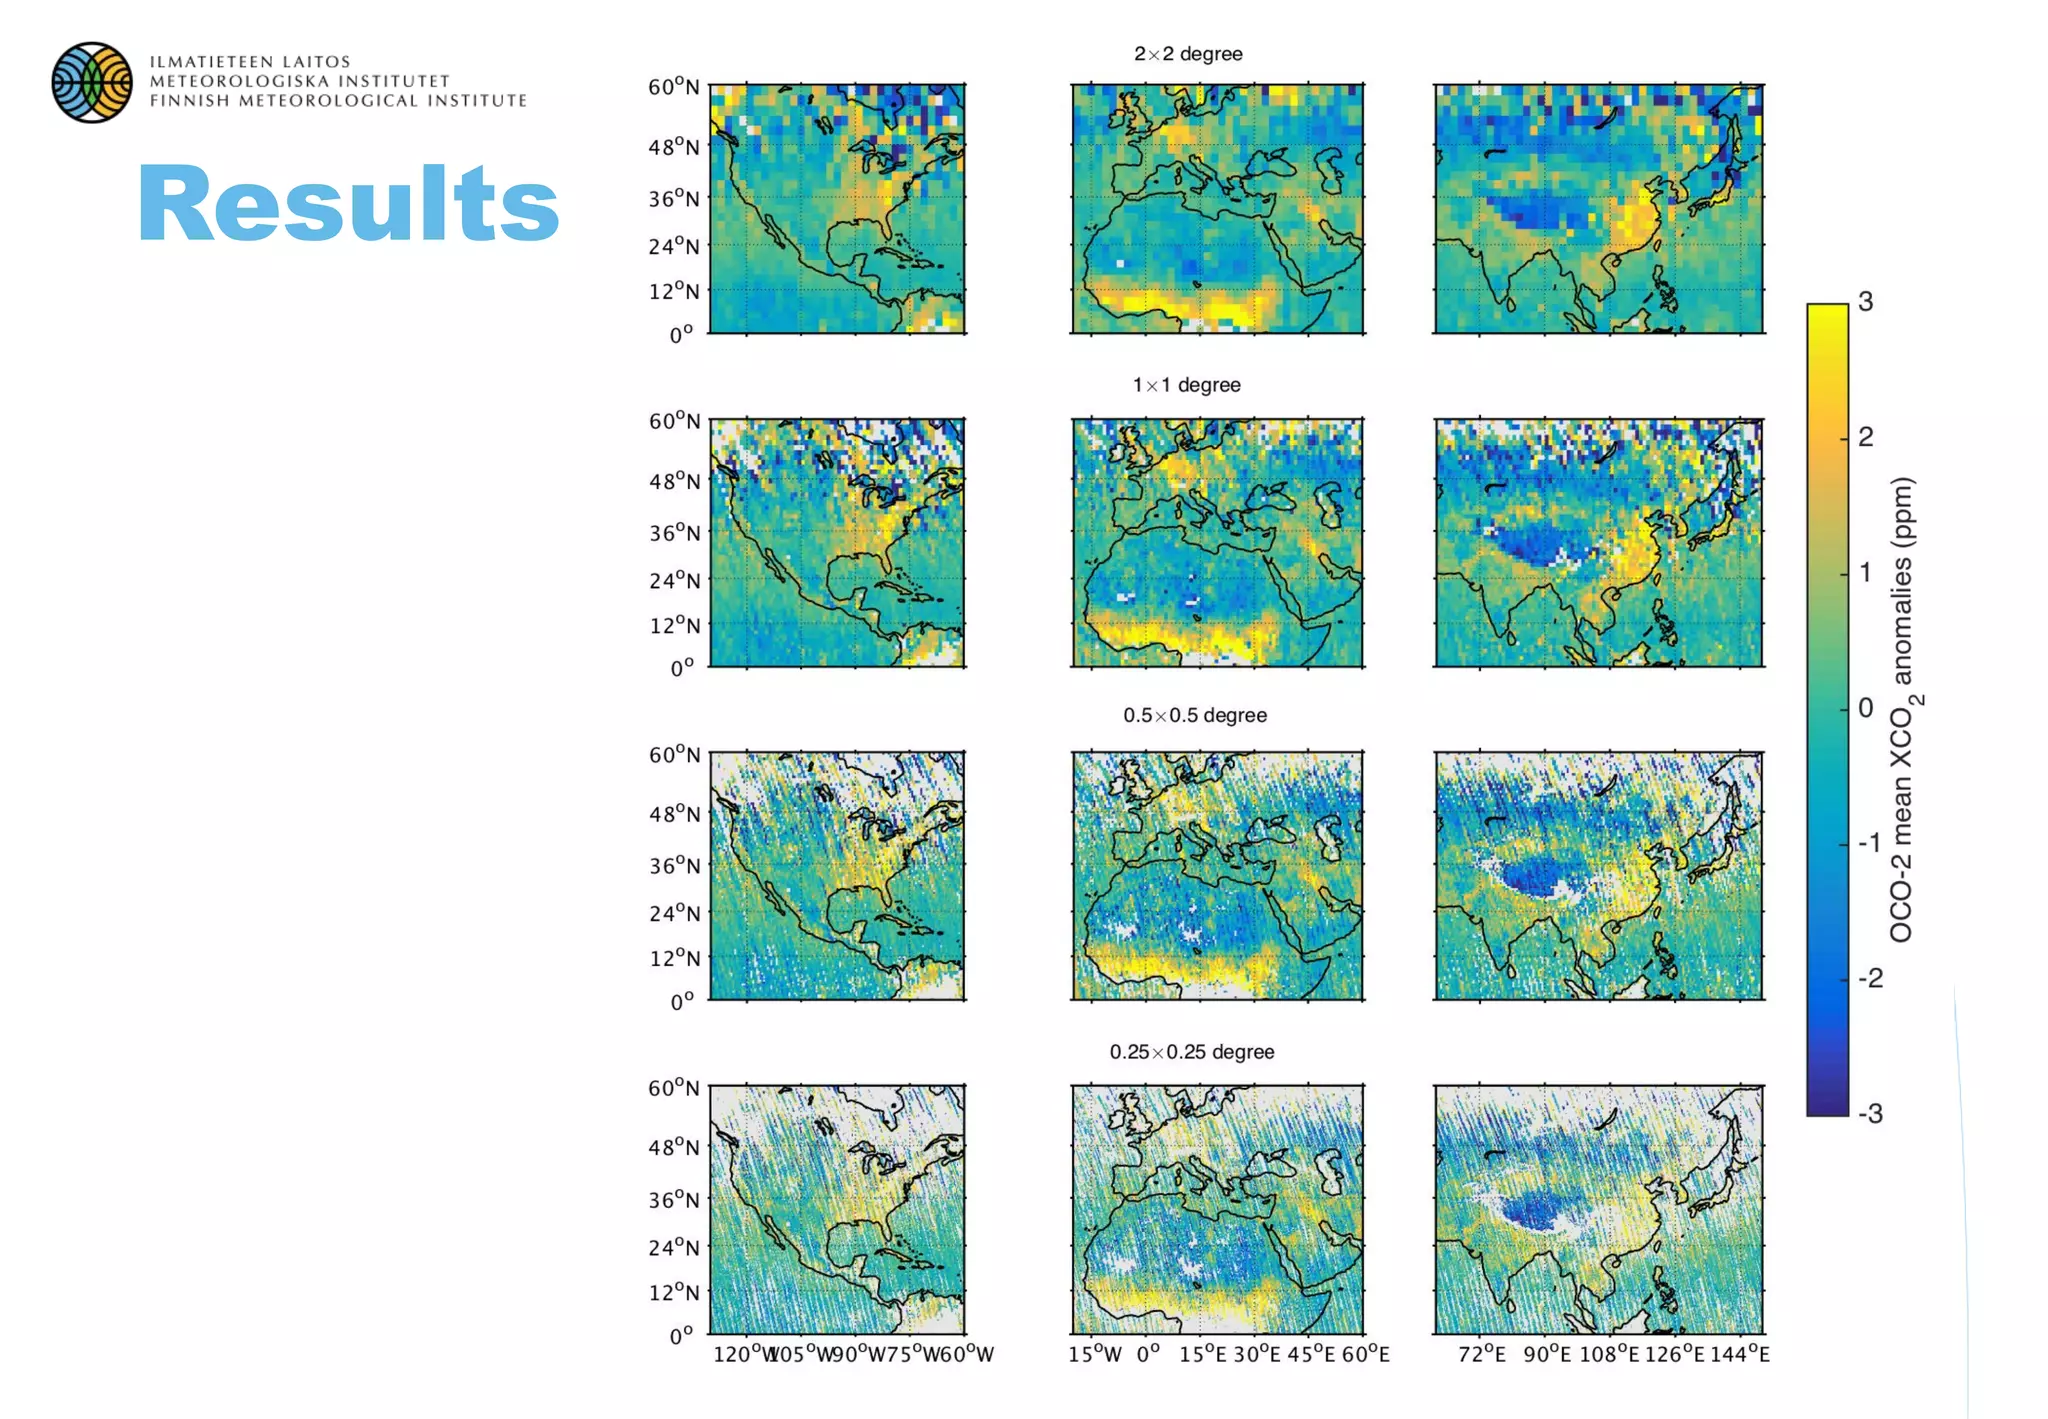
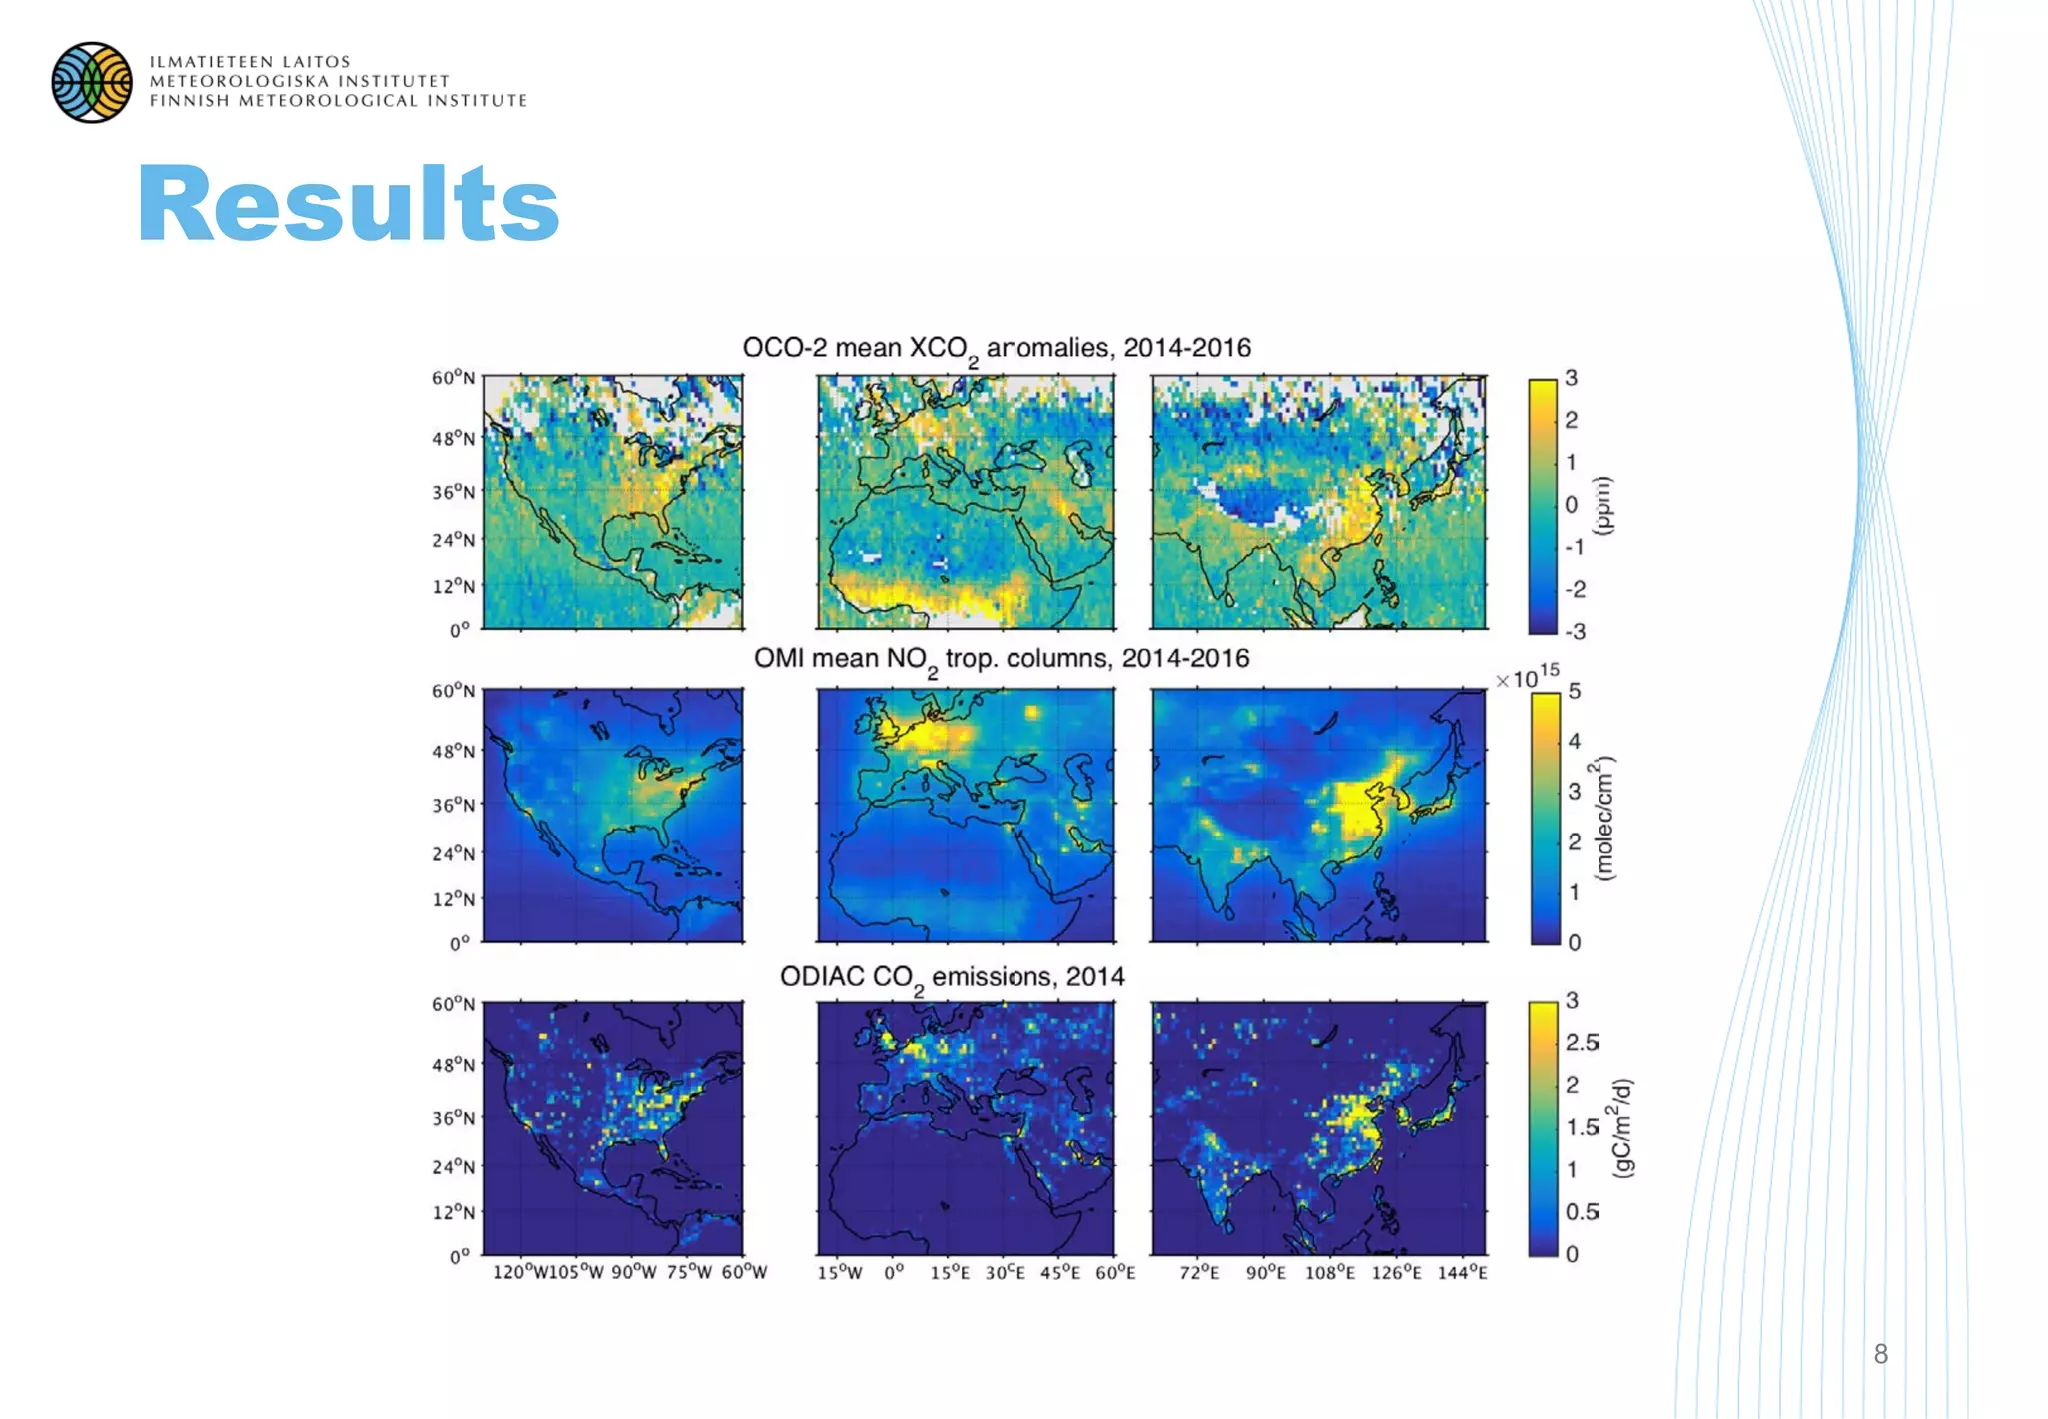
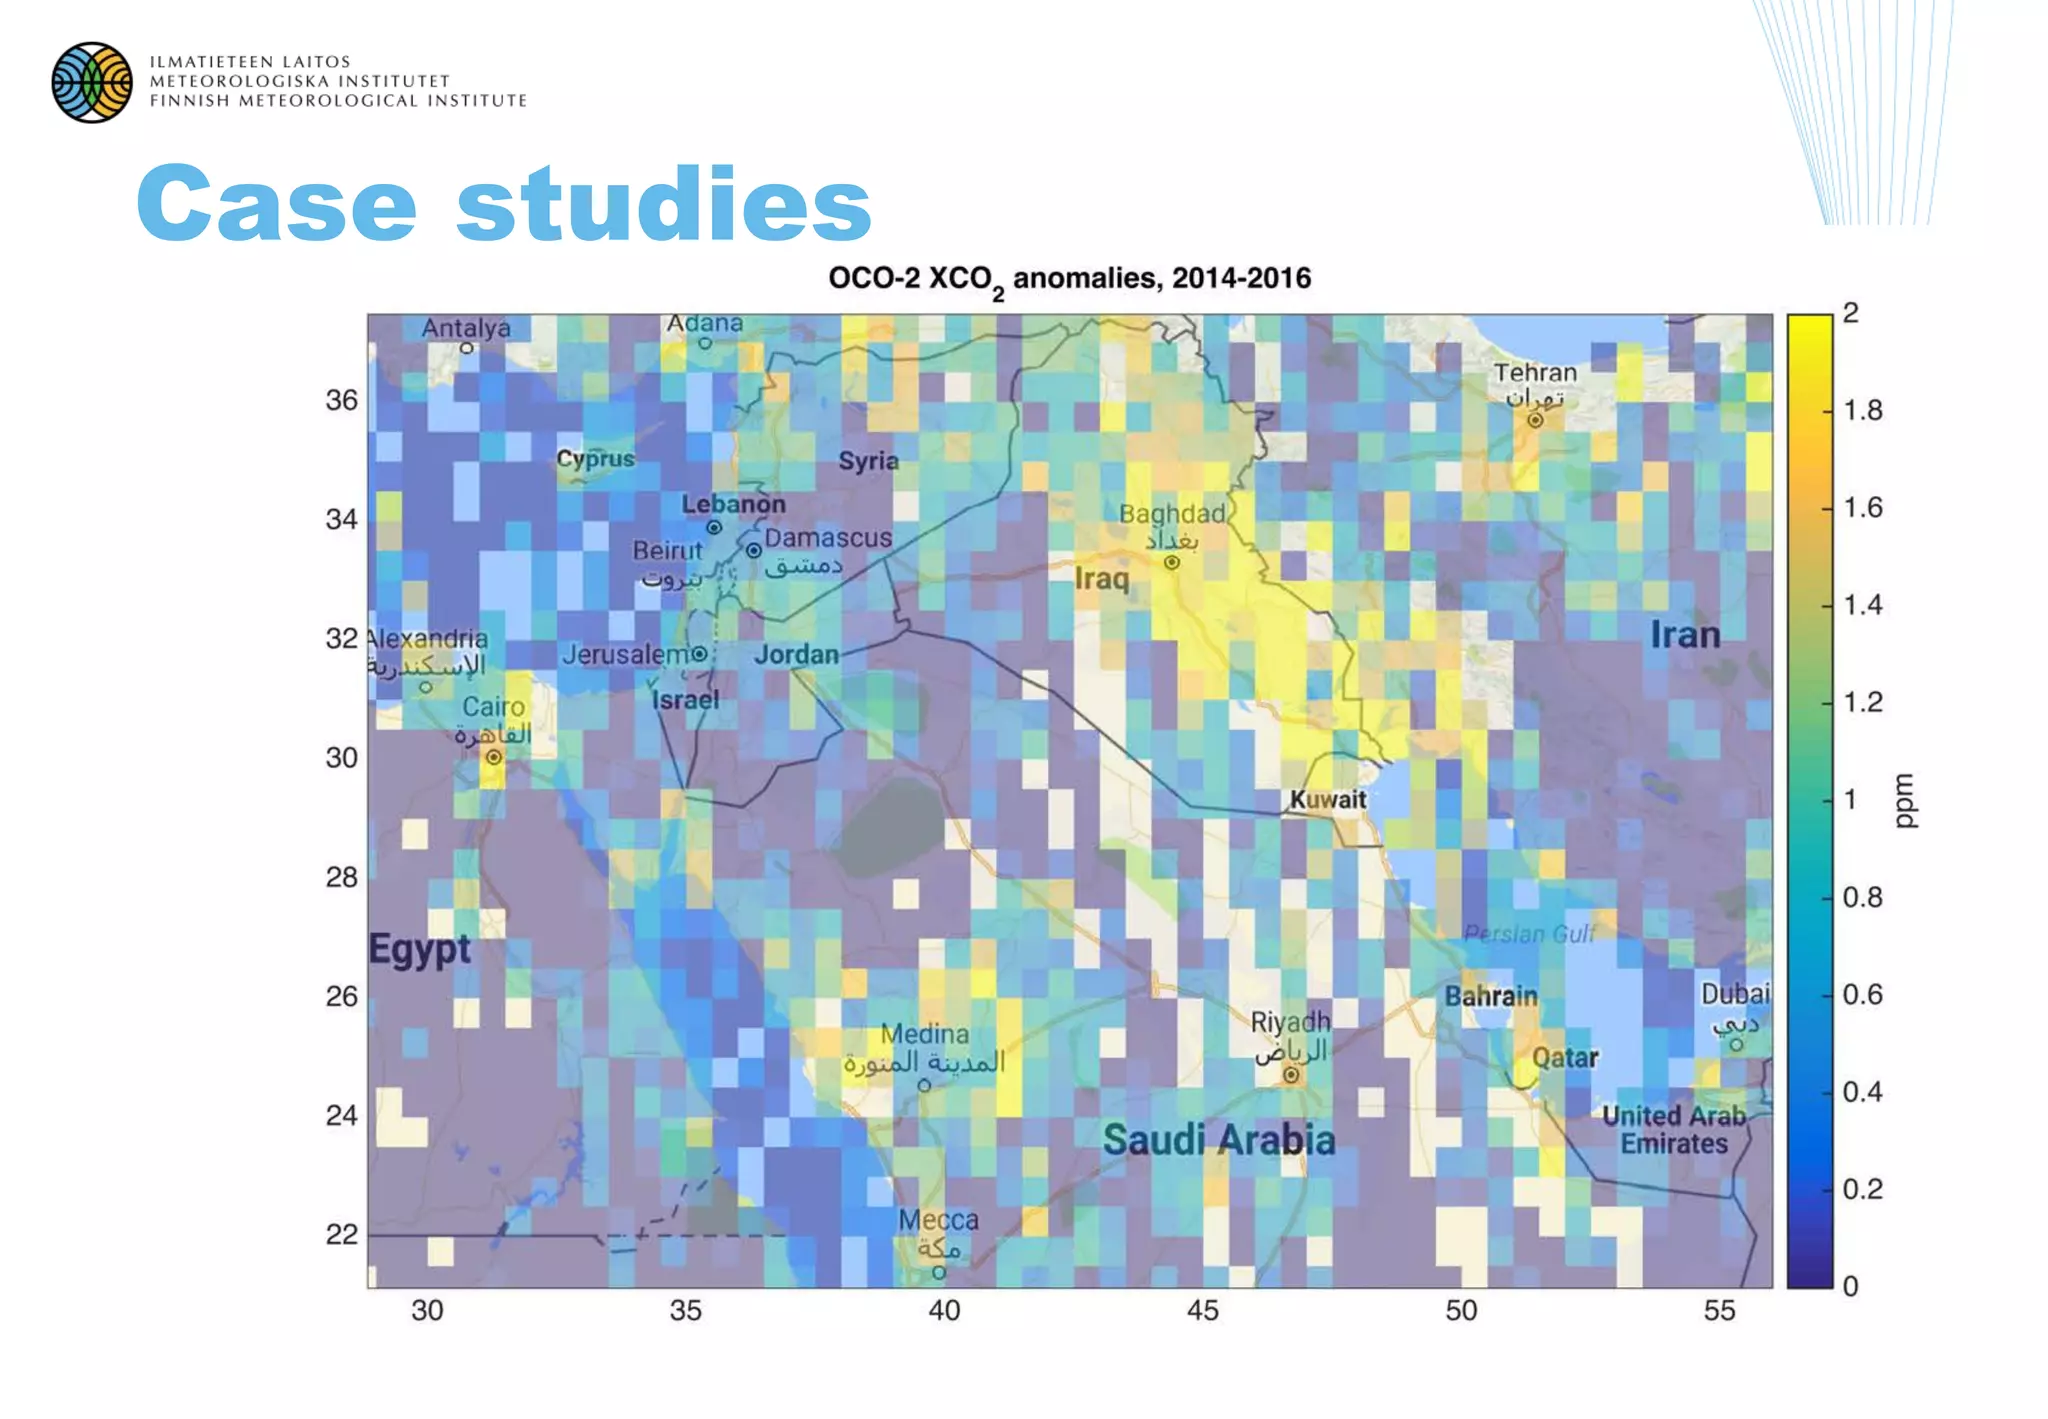
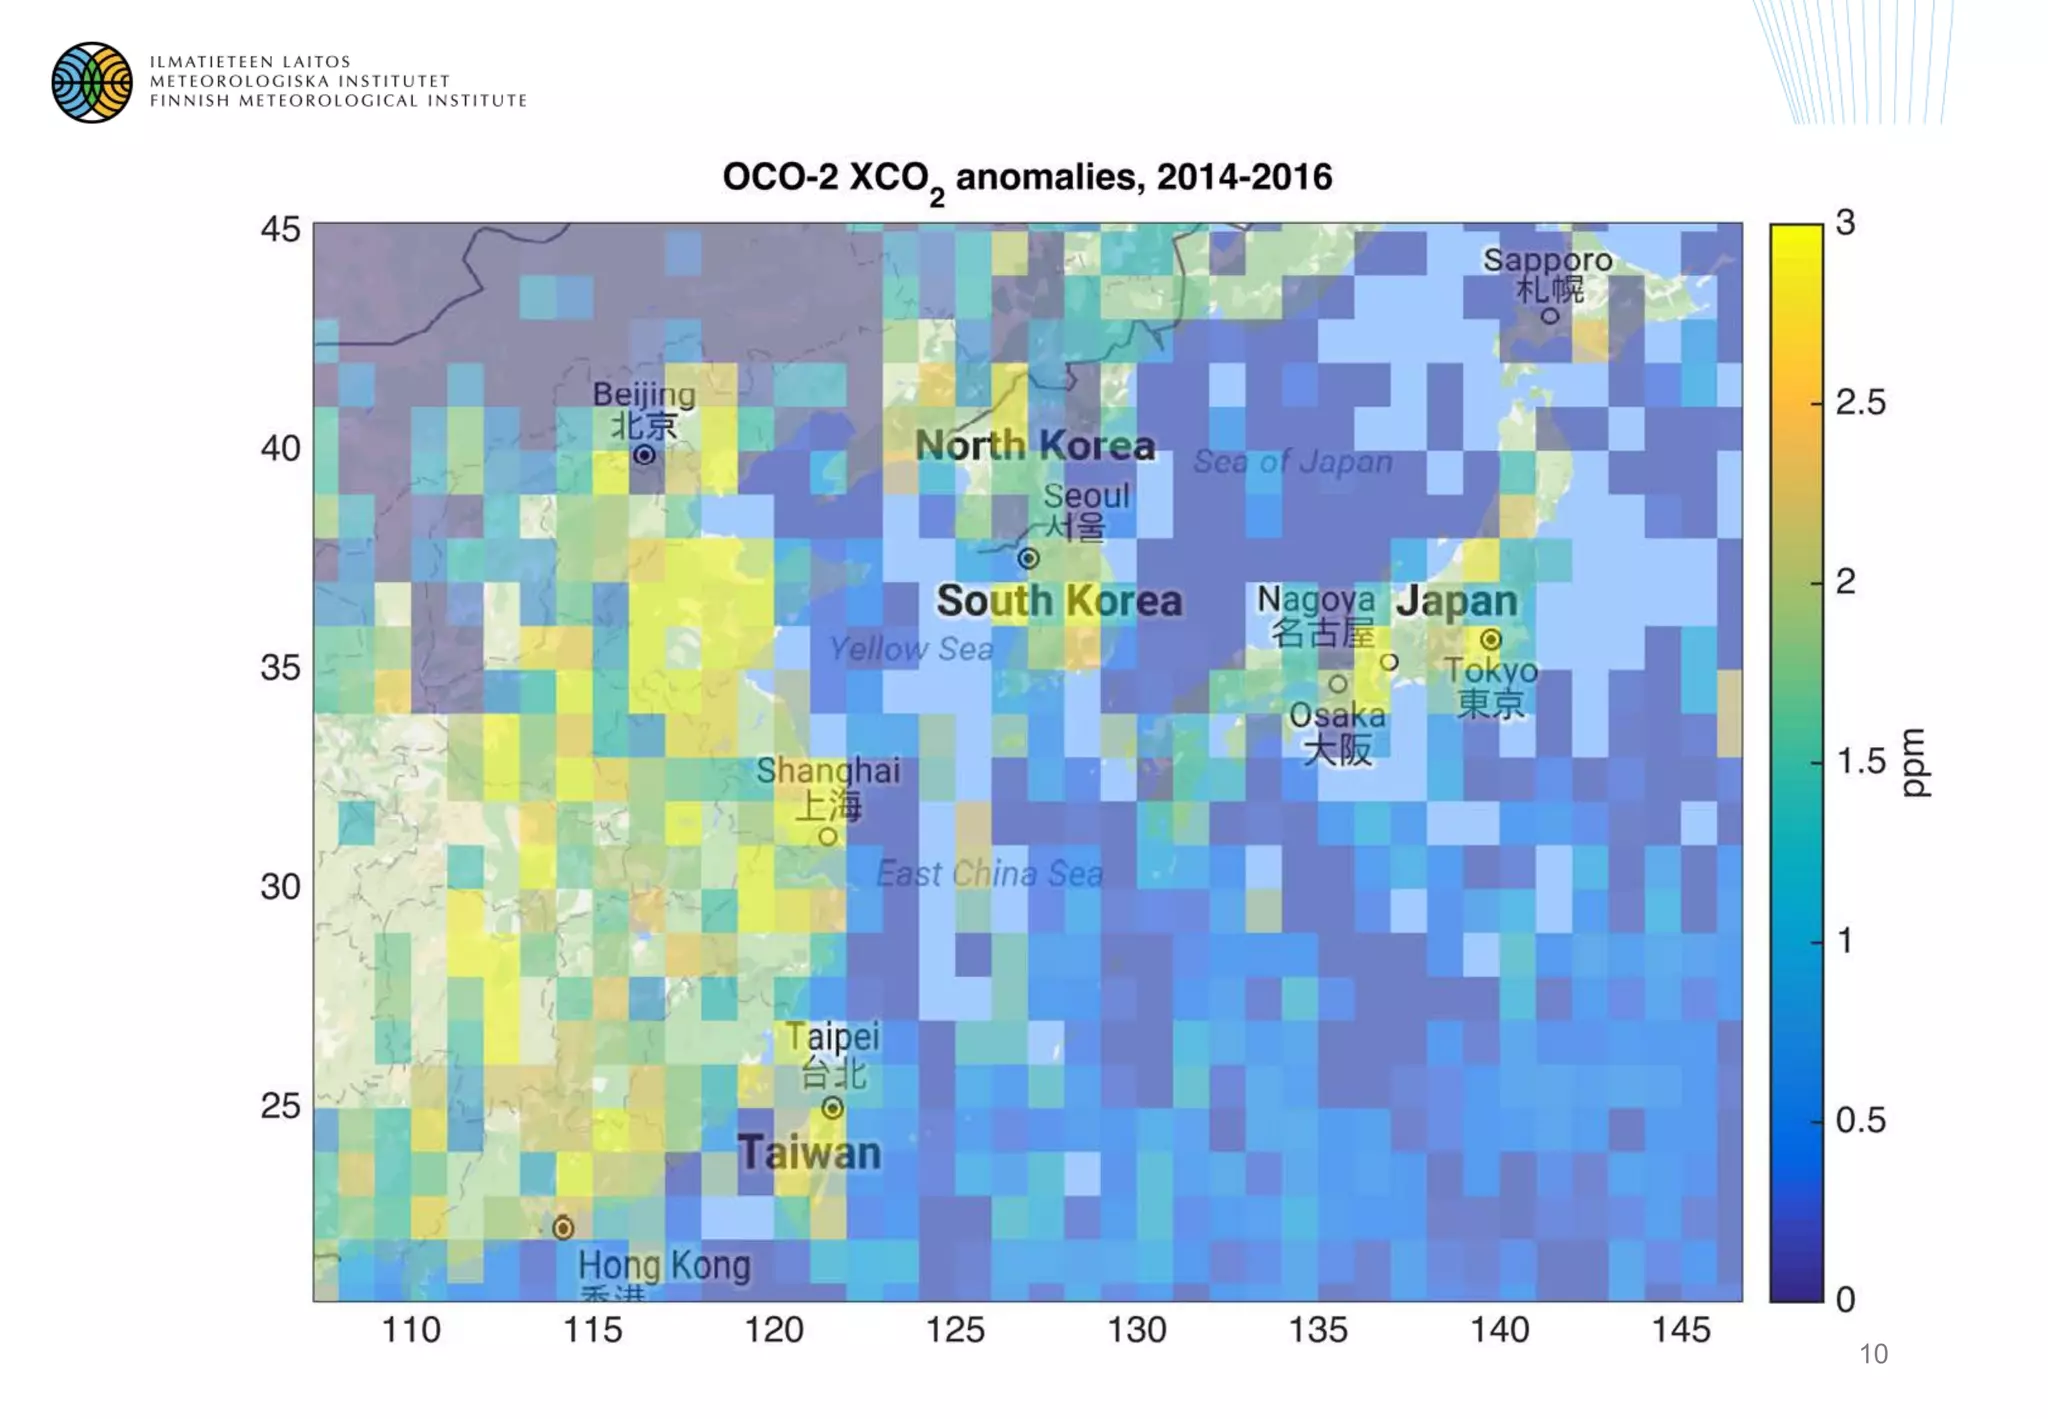
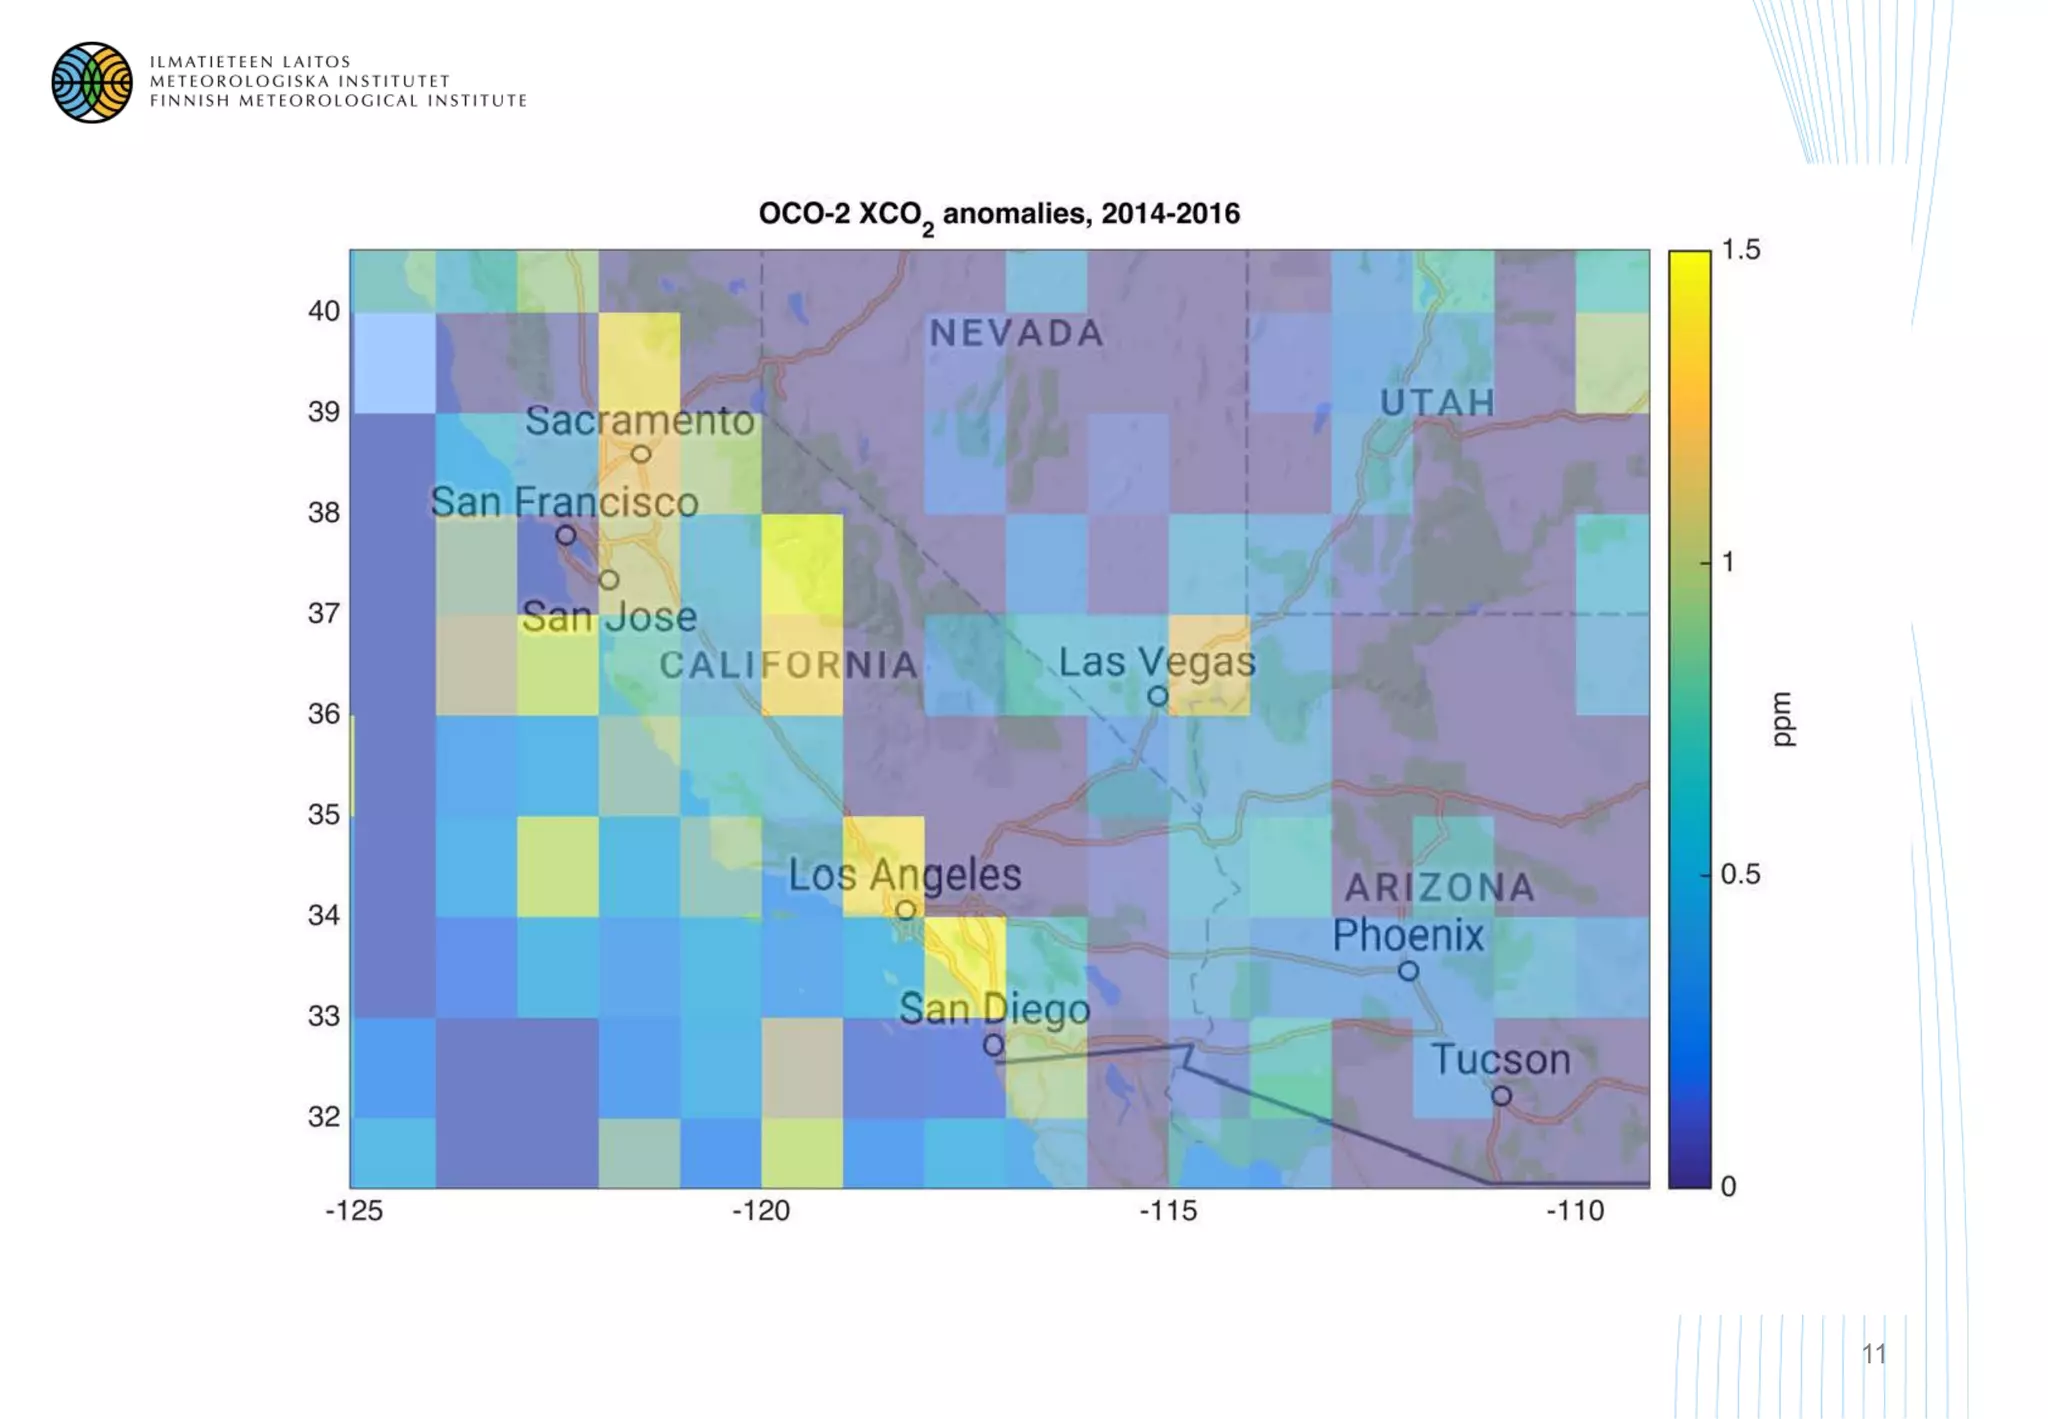
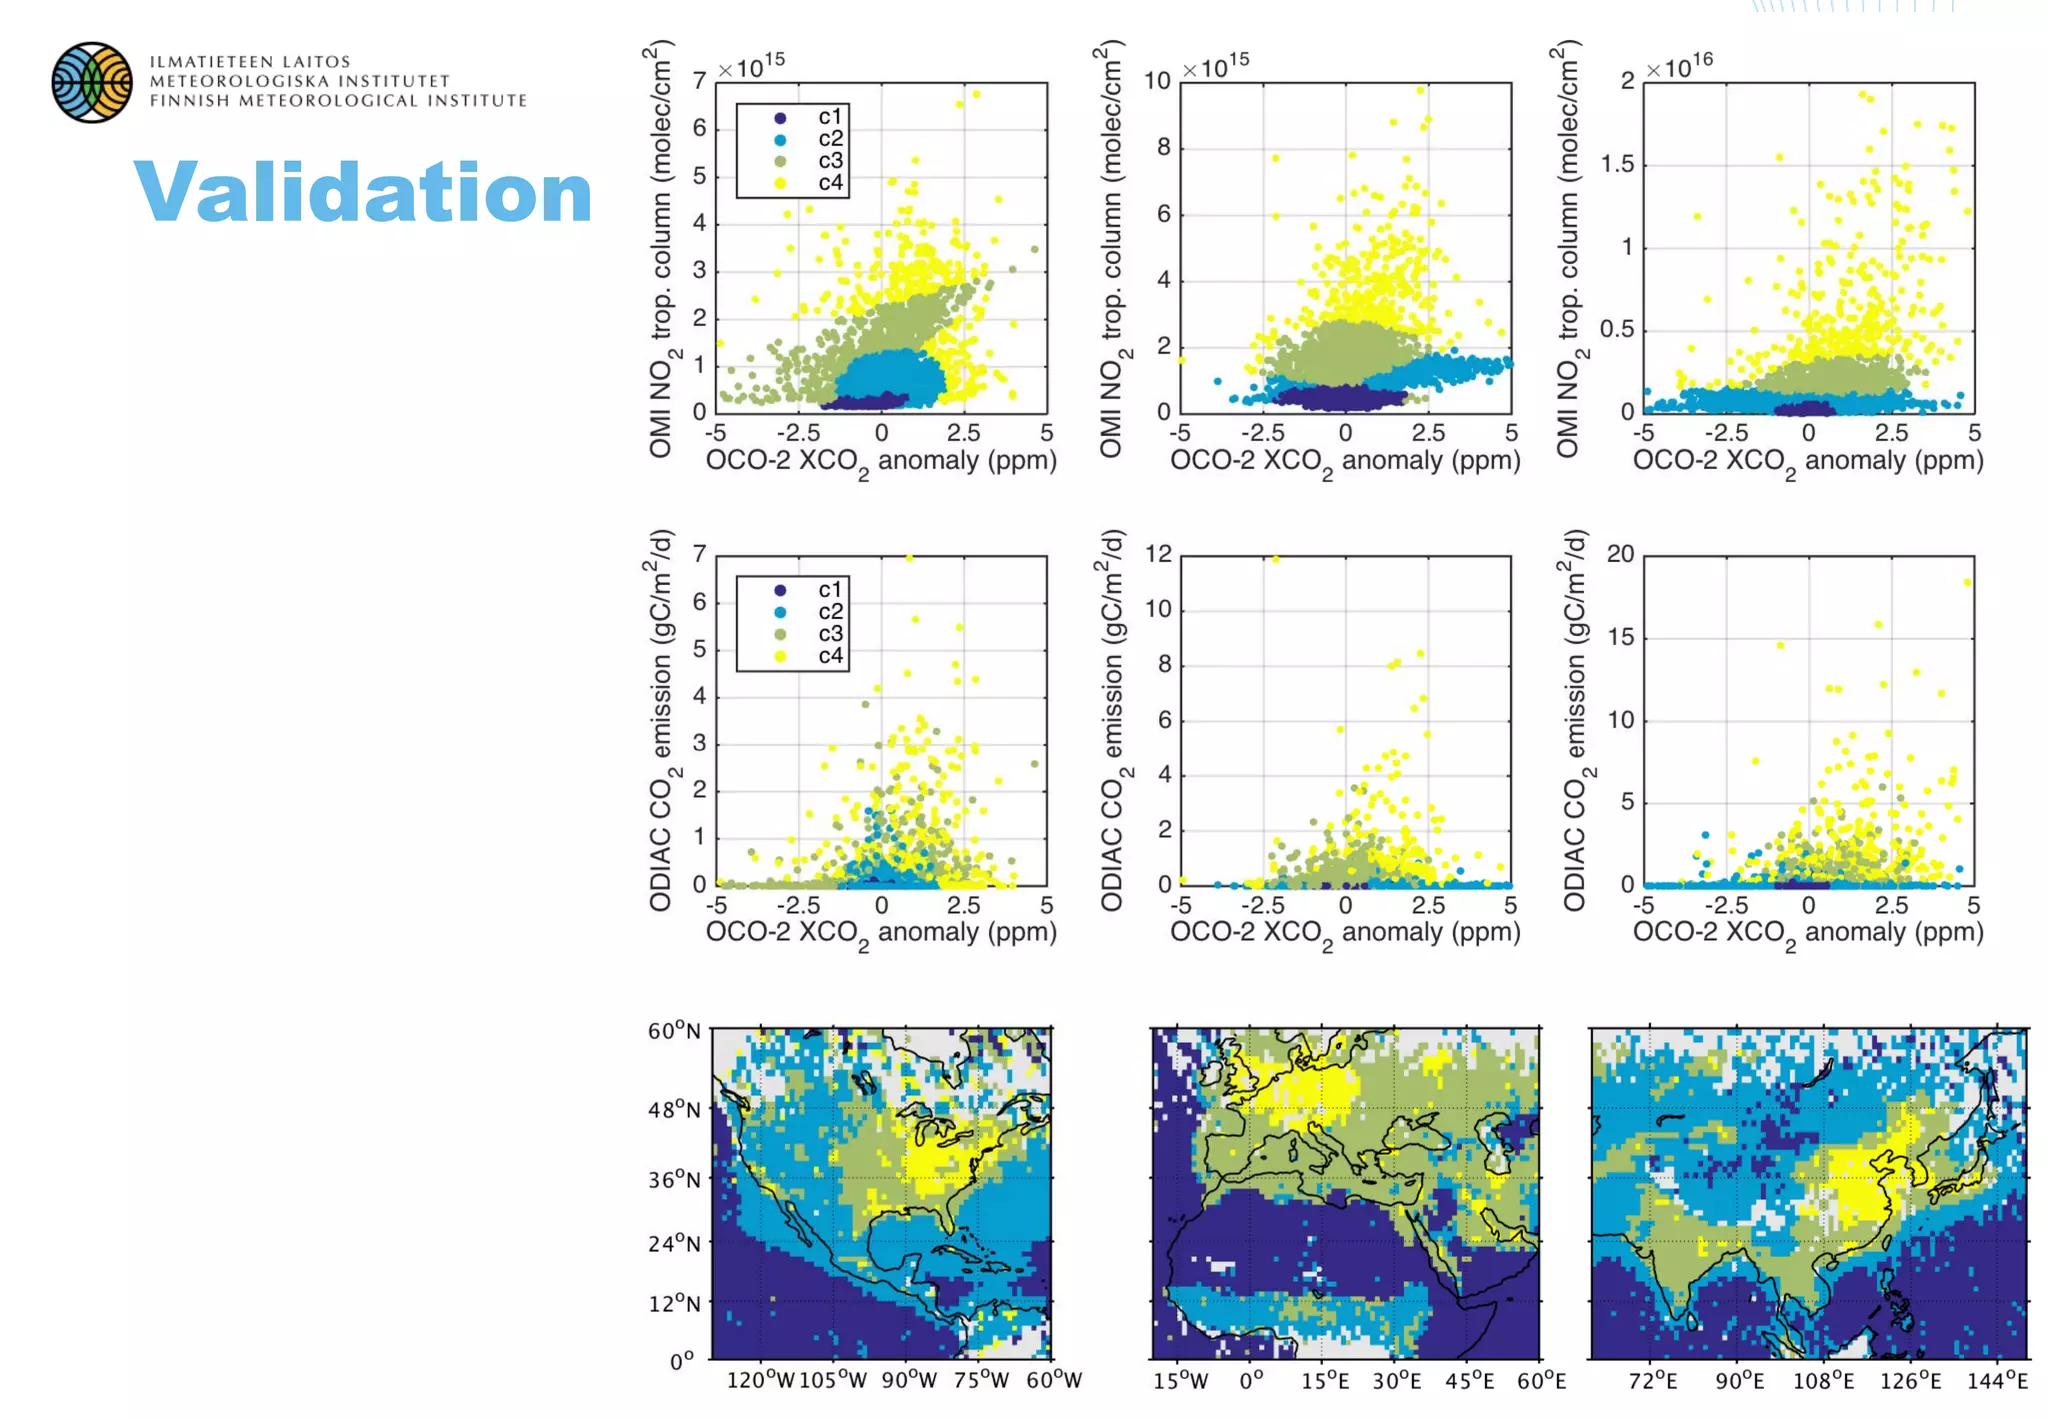
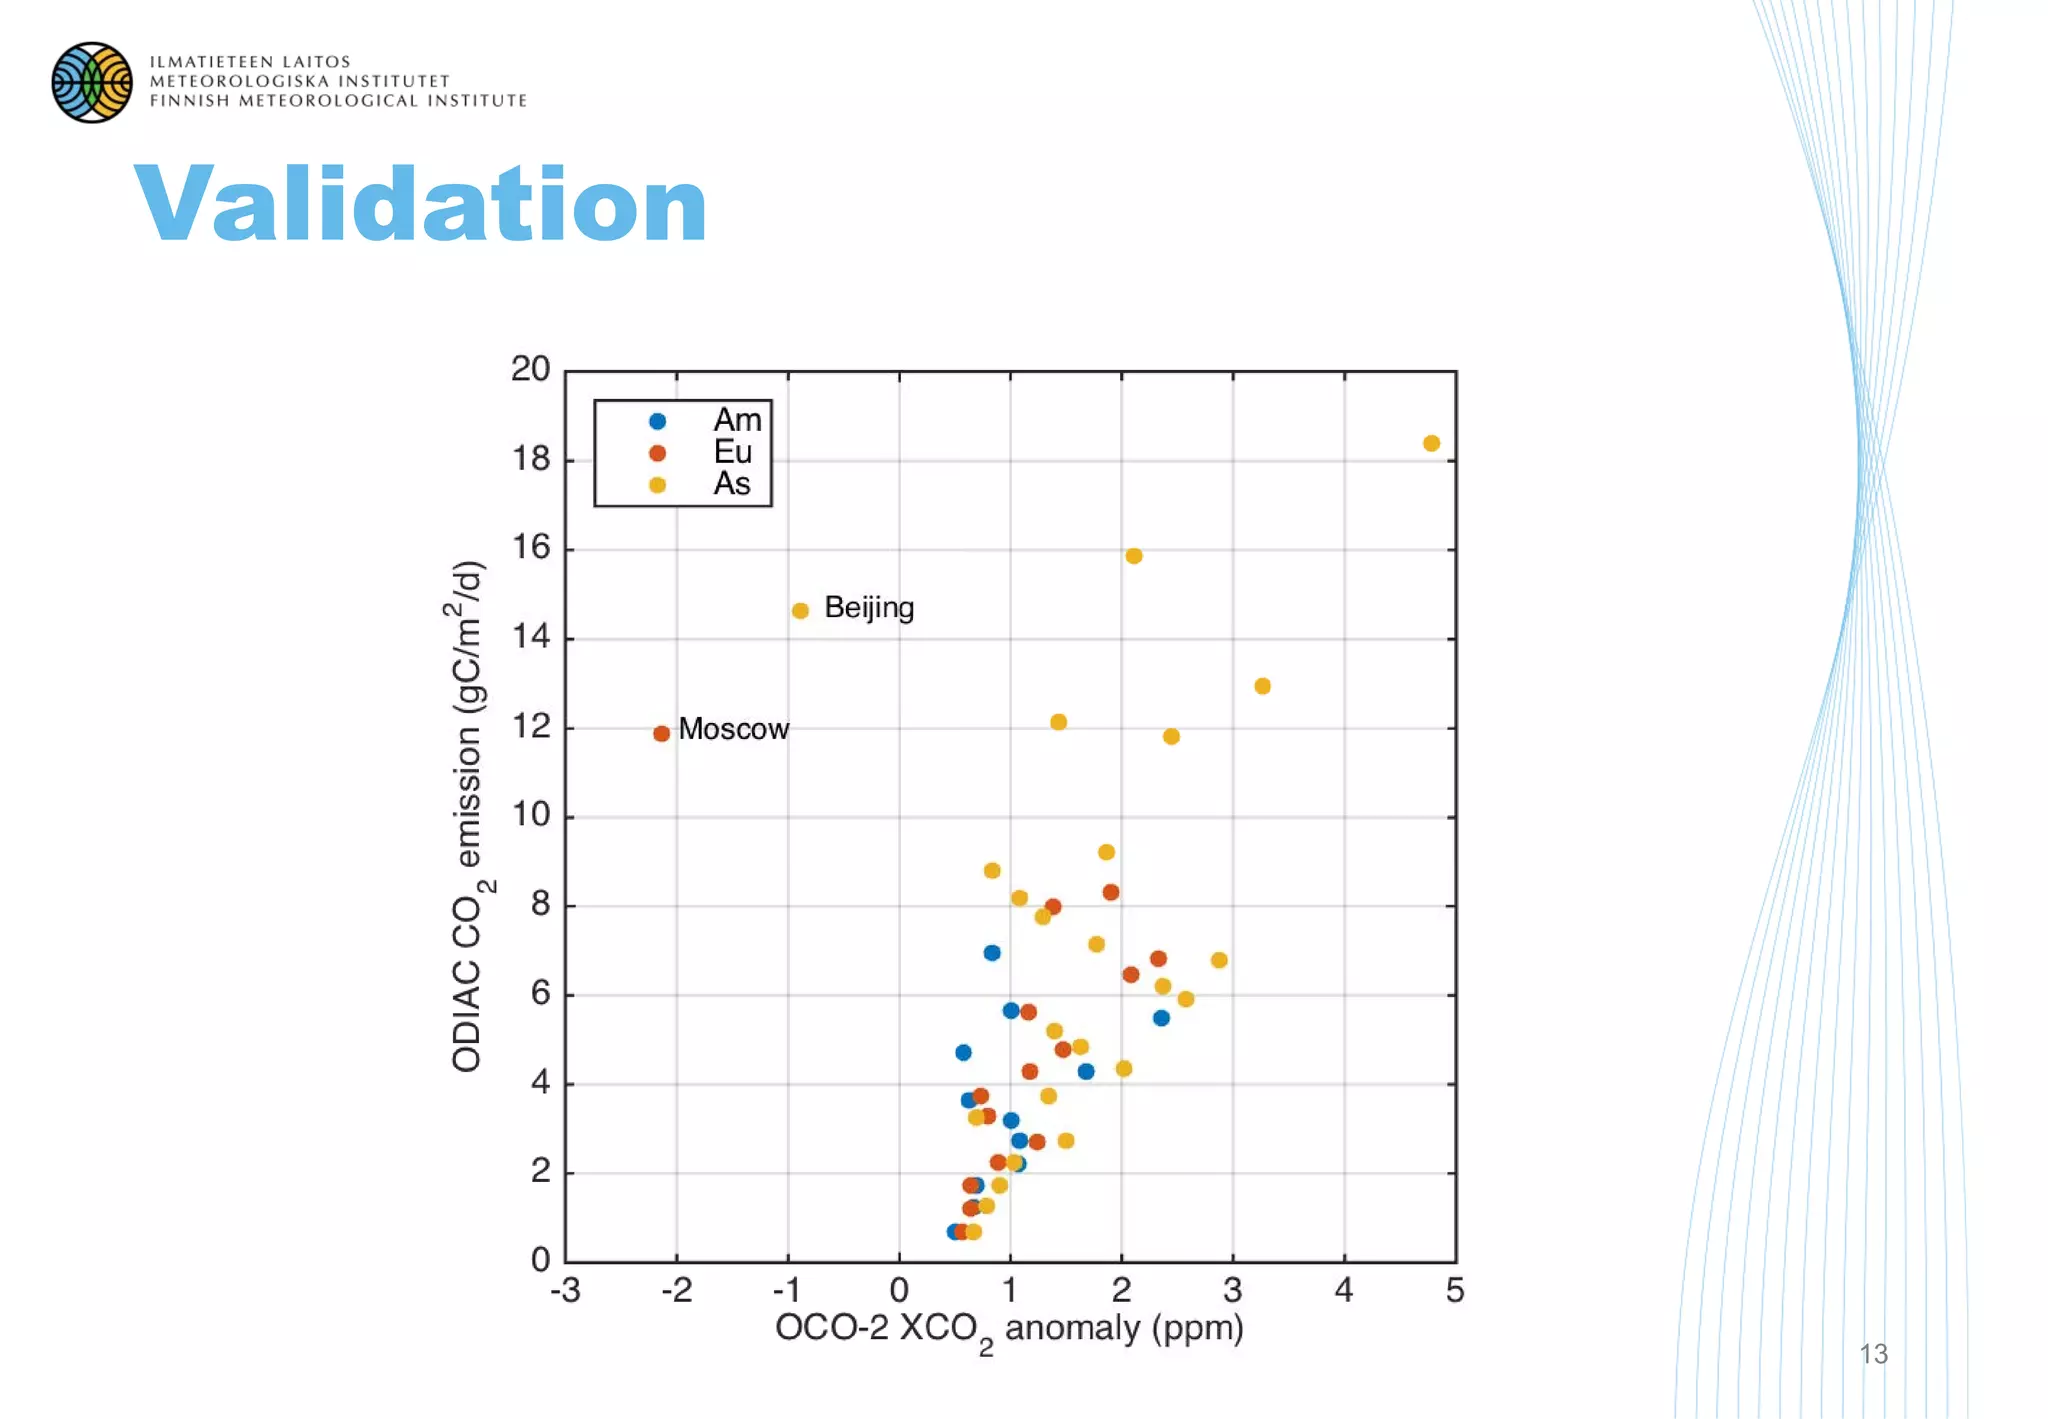

This document discusses the innovative methodology developed for direct space-based observations of anthropogenic CO2 emissions using data from NASA's Orbiting Carbon Observatory-2 (OCO-2). The study successfully identifies major emission areas, such as Europe, the USA, and China, as well as smaller isolated emissions in cities, demonstrating a strong correlation with existing CO2 emission maps. Future research aims to utilize an expanded OCO-2 dataset to further refine the analysis of CO2 emissions.


