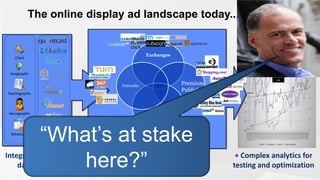
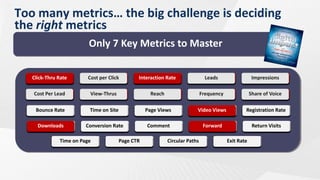
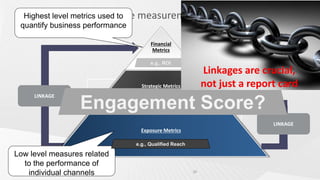
Geoffrey Ramsey
     TWITTER:
    @geofframsey

                       #digitalimpact
                       #imediasummit
September 12, 2011
Can you identify with these two
    fundamental problems?:
• Lack of adequate metrics and measurement systems to
  drive marketing performance
        Secret #1 is all
•   Frustration withneed for
     about the how to effectively engage online
    consumers, who have short attention spans, face
         Performance
    abundant choices and are increasingly resistant
    to Measurement…
       advertising messages
Marketers view of performance
“The challenge is – „Prove to me that
 measurement
marketing works‟… that the
investments are paying back in both
short- and long-term deliverables.”
--Bob Liodice, CEO, ANA
The online display ad landscape today...


                                         Exchanges
    Client


 Geographic


                              Networks
                                                           Premium
                                                           Publishers
Psychographic


 Demographic
                                     Mid/Tail Publishers


  Behavioral
                “What‟s at stake
Integration of many
    data sources    here?”      + real time
                                placement
                                                                         + Complex analytics for
                                                                        testing and optimization
Internet as “Hub”
            $1 Trillion
        Total Marketing
           Myers, PwC, etc)
         (VSS, Consumer time and engagement
           Huge purchase influence
           Now 20% of total media spend
      $368 Billion
“Advertising &and surpassing all print in 2012
                Marketing”
           Media measurement “hook”
         (Outsell)
           Power of One media to rule them all!
 $157 Billion
  Advertising
   (eMarketer)


  $31 B
  Digital

(eMarketer)
Deutsche Bank……. 18.0%
           Barclays................... 16.5%
        “Where‟s all this
           MAGNAGLOBAL….. 15.6%
           PwC…………………. 15.5%
        digital money
           Morgan Stanley……. 14.8%
           Citi…………….......... 14.6%
        coming from?”
           Winterberry Group…. 14.0%
           IDC…………………… 13.8%
           WARC…..….. ………. 12.7%

20.2%      ZenithOptimedia……. 12.6%
           GroupM……………… 12.0%
65%
+1.4%
  eMARKETER FLASH Poll:
 “What % of YOUR digital ad spend
     comes from traditional?”
Secret #2 gets at the
     problem of
 engagement with
 digital consumers
of consumers say they ignore
or disregard banner ads more
  than any other type of ad.


Source: AdweekMedia/Harris Poll,
The classic interruption/disruption
  model of advertising is waning…


 “Advertising is no longer about blasting the most
  “We need most people. creating Magnetic
“Marketers areto create experiences,
 messages to the focusing on Instead, it’s about
Content –this: entertaining, relevant, informative
            so Ideas that spread, win.”
       not just sponsor content.”
    or useful – it demands the consumer‟s
            --Frank --Seth Godin Pepsi
                 timeCooper, CMO,
                      and attention.”
“It‟s more about ATTRACTION,
  rather than DISTRACTION.”
The Magnetic
Content approach
turns targeting on
its head.
What
       Does content
        as marketing
          about
      Case Studythe
         work in Highlight:
     “NameB2B? example of
         B2B world?
           the best
    Magnetic Content that you‟ve
personally experienced with a brand.”
Five Criteria for Magnetic Content

1. Is the content Unique?

2. Is it Useful?

3. Is it Well Executed?
Ask yourself, “Would I personally want
to receive this content, and share it
4. Is it Fun?

with others?” use of the channel in which it appears?
5. Does it make good
IsIs it Useful?
   it working?!
Too many metrics… the big challenge is deciding
the right metrics
                         Only 7 Key Metrics to Master

   Click-Thru Rate
   Click-Thru Rate      Cost per Click
                        Cost per Click       Interaction Rate
                                             Interaction Rate              Leads
                                                                           Leads                  Impressions
                                                                                                  Impressions

   Cost Per Lead
   Cost Per Lead         View-Thrus
                         View-Thrus               Reach
                                                  Reach                Frequency
                                                                       Frequency                 Share of Voice
                                                                                                 Share of Voice

    Bounce Rate
    Bounce Rate          Time on Site
                         Time on Site            Page Views
                                                 Page Views            Video Views
                                                                       Video Views           Registration Rate
                                                                                             Registration Rate

     Downloads
     Downloads         Conversion Rate
                       Conversion Rate           Comments
                                                 Comment
                                                  Comment                  Forward
                                                                           Forward                Return Visits
                                                                                                  Return Visits

              Time on Page
              Time on Page            Page CTR
                                      Page CTR            Circular Paths
                                                          Circular Paths             Exit Rate
                                                                                     Exit Rate
Highest level metrics withto
                Start used the   measurement framework
 quantify business performance

                                       Financial
                                        Metrics                Higher level metrics related to
                                          Financial            longer-term changes in brand
                                       e.g., ROI
                                         Outcomes
                                                               Linkages health
                                                                    LINKAGE are crucial,

                                   Strategic Metrics           not just a report card
     LINKAGE                        Perceptual & Behavioral

                  Engagement Score?
                             e.g., Brand Perception Lift,
                                          Outcomes
                                 Engagement Score


                                                                                    LINKAGE
                                   Exposure Metrics
                                          Marketing
                                         Investment
                                 e.g., Qualified Reach

Low level measures related
  to the performance of
   individual channels                                    20
Engagement Score reflects a hierarchy which
        is based on the brand’s objectives
                               Assign point values to each
HIGHER                        gradated level of Engagement
VALUE
                  Advocate          Recommend , referrals

                    Create            Profiles, Upload pictures
Engagement          Share                Send to friend, Social media
Value Continuum                              Signup, Email, Coupon, WTB
                   Request
                                                                                      21
                   Respond                         Rate, Vote, Add comments

                   Interact                                 Play videos, Demos

LOWER               View                                          Content, Pictures
VALUE
Illustrative example for mapping
                 Engagement Scores
1 Point   1 Point          1 Point                                                              1 Point
                                                                            1 Point                           2 Points


                                                                                                           2 Points
                     1 Point         2 Points   2 Points          1 Point             1 Point
                                                                                                           3 Points

                                                                                                           3 Points


                                                                                                           2 Points


                    2 Points                           3 Points                                  1 Point
Applying Magnetic Content and Performance
 Measurement to the Six Digital Channels


Social

                                Display
Digital
Channel
   #1:     Social Media:
           Connections
Social     that Count
Media we
 “Can     achieve
      scale?”
232 million Americans are online today (74%)


    89%                76% are buying online
    are on             68% are watching online video
    email                 64% are social networking


                                    11%
                                  Twittering
TWITTER:@geofframsey                  Source: eMarketer, 2011
US social media spending will grow 55% this
                           11%
year to $3 billion total US online ad spend
                 of


            7% of total online ad dollars

             18% of display ad dollars


Overtaking Yahoo! this
year at only 13% share
Four best practices for Magnetizing
customers through social media
content

1. Leverage the secret ingredient: Trust

2. Listening leads to learning
                               e.g., letting your brand
                               advocates speak on your
3. Add Value to the conversation
                               behalf;
   (ala Magnetic Content!)     allowing for customer
                               ratings and reviews
4. Focus on your Core Enthusiasts
#2. Listening
leads to Learning

 A. Learn how consumers talk about your brand, product
    or service category
   •   Notice what words and language they use
   •   Learn about their interests and intentions
                                         A personal
                                        story about
 B. Discover real or perceived problems with your
    product or customer service          listening…
New strategy…


ESCALATE
Censored
Adobe, I hope you’re listening, because I’ve got a problem…
#3. Add value to the conversation…
Sometimes, the best Magnetic
Content comes from your best
         customers.
    Unique
    Useful
  Which is why you should:
    Well executed
    Fun
  #4. Focus on Your Fans.
    Great use of channel
#4. FocusWho Your Brand Fans: Nurture them
Consumers       on “Like” or Follow a Brand:
                                Prospects    carefully
• Are more likely to buy 1, 3, 4…………………. 51%
    Find them via
•   Social Media          Customers
    Tend to spend more money 2……………….. $71

                            CORE
• Are more likely to recommend 1, 3, 4……..….                        60%
                                                       CORE
                                                       FANS
• Are more likely to be loyal to the brand 3 ….                       Empower
                                                                    34%
Sources: 1) Chadwick Martin Bailey, Mar, 2010; 2) Syncapse, 2010;
3) ROI Research, June, 2011; 4) DDB Worldwide and OpionWay
Research, Oct, 2010                                                 them to share
SHARPIE: Finding Fans. Empowering
Them. Nurturing Them.


   Viewed 62 million times on
           YouTube
% of marketers saying their
                  ability to measure ROI for
                  media channel is “good”
                     Paid search                  54%
                     E-mail marketing (acq)       53%
                     Online display         37%
                     TV        21%
                     Newsp/Mags       20%
N = 567 global       Social media     19%
marketers, 2010
Applying our framework to
Conduct post-visit surveys                         social media
with an exposed vs. control
 group to determine lift in Financial
     brand perceptions       Metrics

                                    Financial
                                    Outcomes
                                                         LINKAGE

 This is not the               Strategic Metrics
  LINKAGE
  end game!                    Perceptual & Behavioral
                                      Outcomes

                                 To get to “ROI,” you need visibility into
                                             actual buying activity: LINKAGE
                               Exposure Metrics

                                     Marketing
                                    Investment
                           •    Self-stated purchases;
                           •    Matching to a transaction database;
                        37
                           •    Capturing online purchases.
Digital
Channel
   #2      Display:
           The Branding
           that Creates the
           Intent
• Influx of SMB
 display buyers due
    to self-serve
  buying platforms             24.5%
      • RTB and
exchanges creating                     MAGNAGLOBAL... 24%
  improvements in                      Barclays Capital.... 21%
  display targeting,                   Morgan Stanley..... 18%
                       % Planning to Increase Display Ad
                                       Piper Jaffray…….. 18%
 buying efficiencies
     and metrics       Spending in 2011Citi……………....... 17%
                                       ZenithOptimedia.... 15%
                                       DigitalRoute………. 14%
• Facebook creating    • Advertisers*………… 49%
                                       Deutsche Bank…… 13%
   new display ad      • Agencies*……………. 32%
    opportunities                      J.P. Morgan.………. 13%
                       • B2B Marketers**…….Co.………... 13%
                                       Caris & 13%
                                       Credit Suisse…….. &8% 2011;
  • Hockey stick                               *Econsultancy SAS,
  growth in video                              **Forrester Research, 2011
Video Ad Spending as a %
        of Total Display Advertising


17.5%                           32.3%
…There’s now plenty of data showing how online
display ads drive consumer activity

                                  Do a Search

                                 Visit Website
       “You don‟t build brands by
                        Buy Online
         optimizing for clicks!”
                                  Buy Offline
                     --John Battelle
Marketers are getting better at both the
Art and Science of display advertising:

• ART – Focusing on better creative (Magnetic Content)
  – Better ideas, execution – including video
  – Providing multiple engagement options within the banner


“Creative Using data 70% to to better target,
• SCIENCE –is about & analytics 80% of the
  deploy and measure ads (Performance Measurement)
effectiveness of advertising.”
  – Real-time bidding
  – Audience Gibs, VP media analytics, Nielsen
        --Jon targeting
  – Integration with other media
Creative execution counts

   With online video...

       • Tell a story
     • Create a laugh
• Visualize a product benefit
Home sales of blenders up Is it FUN?
  700% since the video
     series began!
Believe in the Magic of
                   “I do hope Geoff
Magnetic Content and Performance Measurement
                  realizes his time
                  is up”
“Thank you”             (www.Amazon.com)


eMail geoff@emarketer.com


Twitter @geofframsey

Digital Impact

  • 1.
    Geoffrey Ramsey TWITTER: @geofframsey #digitalimpact #imediasummit September 12, 2011
  • 2.
    Can you identifywith these two fundamental problems?: • Lack of adequate metrics and measurement systems to drive marketing performance Secret #1 is all • Frustration withneed for about the how to effectively engage online consumers, who have short attention spans, face Performance abundant choices and are increasingly resistant to Measurement… advertising messages
  • 3.
    Marketers view ofperformance “The challenge is – „Prove to me that measurement marketing works‟… that the investments are paying back in both short- and long-term deliverables.” --Bob Liodice, CEO, ANA
  • 4.
    The online displayad landscape today... Exchanges Client Geographic Networks Premium Publishers Psychographic Demographic Mid/Tail Publishers Behavioral “What‟s at stake Integration of many data sources here?” + real time placement + Complex analytics for testing and optimization
  • 5.
    Internet as “Hub” $1 Trillion Total Marketing  Myers, PwC, etc) (VSS, Consumer time and engagement  Huge purchase influence  Now 20% of total media spend $368 Billion “Advertising &and surpassing all print in 2012 Marketing”  Media measurement “hook” (Outsell)  Power of One media to rule them all! $157 Billion Advertising (eMarketer) $31 B Digital (eMarketer)
  • 6.
    Deutsche Bank……. 18.0% Barclays................... 16.5% “Where‟s all this MAGNAGLOBAL….. 15.6% PwC…………………. 15.5% digital money Morgan Stanley……. 14.8% Citi…………….......... 14.6% coming from?” Winterberry Group…. 14.0% IDC…………………… 13.8% WARC…..….. ………. 12.7% 20.2% ZenithOptimedia……. 12.6% GroupM……………… 12.0%
  • 7.
    65% +1.4% eMARKETERFLASH Poll: “What % of YOUR digital ad spend comes from traditional?”
  • 8.
    Secret #2 getsat the problem of engagement with digital consumers
  • 9.
    of consumers saythey ignore or disregard banner ads more than any other type of ad. Source: AdweekMedia/Harris Poll,
  • 10.
    The classic interruption/disruption model of advertising is waning… “Advertising is no longer about blasting the most “We need most people. creating Magnetic “Marketers areto create experiences, messages to the focusing on Instead, it’s about Content –this: entertaining, relevant, informative so Ideas that spread, win.” not just sponsor content.” or useful – it demands the consumer‟s --Frank --Seth Godin Pepsi timeCooper, CMO, and attention.”
  • 11.
    “It‟s more aboutATTRACTION, rather than DISTRACTION.”
  • 12.
  • 15.
    What Does content as marketing about Case Studythe work in Highlight: “NameB2B? example of B2B world? the best Magnetic Content that you‟ve personally experienced with a brand.”
  • 16.
    Five Criteria forMagnetic Content 1. Is the content Unique? 2. Is it Useful? 3. Is it Well Executed? Ask yourself, “Would I personally want to receive this content, and share it 4. Is it Fun? with others?” use of the channel in which it appears? 5. Does it make good
  • 18.
    IsIs it Useful? it working?!
  • 19.
    Too many metrics…the big challenge is deciding the right metrics Only 7 Key Metrics to Master Click-Thru Rate Click-Thru Rate Cost per Click Cost per Click Interaction Rate Interaction Rate Leads Leads Impressions Impressions Cost Per Lead Cost Per Lead View-Thrus View-Thrus Reach Reach Frequency Frequency Share of Voice Share of Voice Bounce Rate Bounce Rate Time on Site Time on Site Page Views Page Views Video Views Video Views Registration Rate Registration Rate Downloads Downloads Conversion Rate Conversion Rate Comments Comment Comment Forward Forward Return Visits Return Visits Time on Page Time on Page Page CTR Page CTR Circular Paths Circular Paths Exit Rate Exit Rate
  • 20.
    Highest level metricswithto Start used the measurement framework quantify business performance Financial Metrics Higher level metrics related to Financial longer-term changes in brand e.g., ROI Outcomes Linkages health LINKAGE are crucial, Strategic Metrics not just a report card LINKAGE Perceptual & Behavioral Engagement Score? e.g., Brand Perception Lift, Outcomes Engagement Score LINKAGE Exposure Metrics Marketing Investment e.g., Qualified Reach Low level measures related to the performance of individual channels 20
  • 21.
    Engagement Score reflectsa hierarchy which is based on the brand’s objectives Assign point values to each HIGHER gradated level of Engagement VALUE Advocate Recommend , referrals Create Profiles, Upload pictures Engagement Share Send to friend, Social media Value Continuum Signup, Email, Coupon, WTB Request 21 Respond Rate, Vote, Add comments Interact Play videos, Demos LOWER View Content, Pictures VALUE
  • 22.
    Illustrative example formapping Engagement Scores 1 Point 1 Point 1 Point 1 Point 1 Point 2 Points 2 Points 1 Point 2 Points 2 Points 1 Point 1 Point 3 Points 3 Points 2 Points 2 Points 3 Points 1 Point
  • 23.
    Applying Magnetic Contentand Performance Measurement to the Six Digital Channels Social Display
  • 24.
    Digital Channel #1: Social Media: Connections Social that Count Media we “Can achieve scale?”
  • 25.
    232 million Americansare online today (74%) 89% 76% are buying online are on 68% are watching online video email 64% are social networking 11% Twittering TWITTER:@geofframsey Source: eMarketer, 2011
  • 26.
    US social mediaspending will grow 55% this 11% year to $3 billion total US online ad spend of 7% of total online ad dollars 18% of display ad dollars Overtaking Yahoo! this year at only 13% share
  • 27.
    Four best practicesfor Magnetizing customers through social media content 1. Leverage the secret ingredient: Trust 2. Listening leads to learning e.g., letting your brand advocates speak on your 3. Add Value to the conversation behalf; (ala Magnetic Content!) allowing for customer ratings and reviews 4. Focus on your Core Enthusiasts
  • 28.
    #2. Listening leads toLearning A. Learn how consumers talk about your brand, product or service category • Notice what words and language they use • Learn about their interests and intentions A personal story about B. Discover real or perceived problems with your product or customer service listening…
  • 29.
  • 30.
  • 31.
    Adobe, I hopeyou’re listening, because I’ve got a problem…
  • 32.
    #3. Add valueto the conversation…
  • 33.
    Sometimes, the bestMagnetic Content comes from your best customers. Unique Useful Which is why you should: Well executed Fun #4. Focus on Your Fans. Great use of channel
  • 34.
    #4. FocusWho YourBrand Fans: Nurture them Consumers on “Like” or Follow a Brand: Prospects carefully • Are more likely to buy 1, 3, 4…………………. 51% Find them via • Social Media Customers Tend to spend more money 2……………….. $71 CORE • Are more likely to recommend 1, 3, 4……..…. 60% CORE FANS • Are more likely to be loyal to the brand 3 …. Empower 34% Sources: 1) Chadwick Martin Bailey, Mar, 2010; 2) Syncapse, 2010; 3) ROI Research, June, 2011; 4) DDB Worldwide and OpionWay Research, Oct, 2010 them to share
  • 35.
    SHARPIE: Finding Fans.Empowering Them. Nurturing Them. Viewed 62 million times on YouTube
  • 36.
    % of marketerssaying their ability to measure ROI for media channel is “good” Paid search 54% E-mail marketing (acq) 53% Online display 37% TV 21% Newsp/Mags 20% N = 567 global Social media 19% marketers, 2010
  • 37.
    Applying our frameworkto Conduct post-visit surveys social media with an exposed vs. control group to determine lift in Financial brand perceptions Metrics Financial Outcomes LINKAGE This is not the Strategic Metrics LINKAGE end game! Perceptual & Behavioral Outcomes To get to “ROI,” you need visibility into actual buying activity: LINKAGE Exposure Metrics Marketing Investment • Self-stated purchases; • Matching to a transaction database; 37 • Capturing online purchases.
  • 38.
    Digital Channel #2 Display: The Branding that Creates the Intent
  • 39.
    • Influx ofSMB display buyers due to self-serve buying platforms 24.5% • RTB and exchanges creating MAGNAGLOBAL... 24% improvements in Barclays Capital.... 21% display targeting, Morgan Stanley..... 18% % Planning to Increase Display Ad Piper Jaffray…….. 18% buying efficiencies and metrics Spending in 2011Citi……………....... 17% ZenithOptimedia.... 15% DigitalRoute………. 14% • Facebook creating • Advertisers*………… 49% Deutsche Bank…… 13% new display ad • Agencies*……………. 32% opportunities J.P. Morgan.………. 13% • B2B Marketers**…….Co.………... 13% Caris & 13% Credit Suisse…….. &8% 2011; • Hockey stick *Econsultancy SAS, growth in video **Forrester Research, 2011
  • 40.
    Video Ad Spendingas a % of Total Display Advertising 17.5% 32.3%
  • 41.
    …There’s now plentyof data showing how online display ads drive consumer activity Do a Search Visit Website “You don‟t build brands by Buy Online optimizing for clicks!” Buy Offline --John Battelle
  • 42.
    Marketers are gettingbetter at both the Art and Science of display advertising: • ART – Focusing on better creative (Magnetic Content) – Better ideas, execution – including video – Providing multiple engagement options within the banner “Creative Using data 70% to to better target, • SCIENCE –is about & analytics 80% of the deploy and measure ads (Performance Measurement) effectiveness of advertising.” – Real-time bidding – Audience Gibs, VP media analytics, Nielsen --Jon targeting – Integration with other media
  • 43.
    Creative execution counts With online video... • Tell a story • Create a laugh • Visualize a product benefit
  • 44.
    Home sales ofblenders up Is it FUN? 700% since the video series began!
  • 45.
    Believe in theMagic of “I do hope Geoff Magnetic Content and Performance Measurement realizes his time is up”
  • 46.
    “Thank you” (www.Amazon.com) eMail geoff@emarketer.com Twitter @geofframsey