SlideShare a Scribd company logo
1 of 13
BIVARIATE ANALYSIS
 Bivariate analysis is the simultaneous analysis of two variables (attributes).
 It explores the concept of relationship between two variables, whether there
exists an association and the strength of this association, or whether there are
differences between two variables and the significance of these differences.
 There are three types of bivariate analysis:
 Numerical and Numerical
 Categorical and Categorical
 Numerical and Categorical
Numerical and Numerical
 In this type, both the variables of bivariate data, independent and dependent, are having
numerical values.
It has basically two types:
Scatter Plot
Linear Correlation
Scatter Plot
 Scatter plots are the graphs that present the relationship between two variables in a data-set.
 The independent variable or attribute is plotted on the X-axis, while the dependent variable is plotted on the
Y-axis.
 Scatter plots are used in either of the following situations.
• When we have paired numerical data
• When there are multiple values of the dependent variable for a unique value of an independent variable
Linear Correlation
Linear correlation quantifies the strength of a linear relationship between two numerical
variables.
When there is no correlation between two variables, there is no tendency for the values of one
quantity to increase or decrease with the values of the second quantity.
Strength of a linear relationship is denoted by r and is always between -1 and 1 where -1 means
perfect negative linear correlation and +1 means perfect positive linear correlation and zero
means no linear correlation.
Example-
Categorical and Categorical
 In this type, both the variables of bivariate data, independent and dependent, are Categorical.
It has basically three types:
Stacked Column Chart
Combination Chart
Chi-Square Test
Stacked Column Chart
Stacked Column chart is a useful graph to visualize the relationship between two categorical
variables.
It compares the percentage that each category from one variable contributes to a total across
categories of the second variable.
Combination Chart
The combination chart is a visualization that combines the features of the bar chart and
the line chart.
 The combination chart displays the data using a number of bars and/or lines, each of
which represent a particular category.
A combination of bars and lines in the same visualization can be useful when comparing
values in different categories, since the combination gives a clear view of which category
is higher or lower.
Chi-Square Test
The chi-square test can be used to determine the association between categorical variables.
It is based on the difference between the expected frequencies (e) and the observed frequencies
(n) in one or more categories in the frequency table.
The chi-square distribution returns a probability for the computed chi-square and the degree of
freedom.
A probability of zero shows a complete dependency between two categorical variables and
a probability of one means that two categorical variables are completely independent.
Numerical and Categorical
In this type ,one of the variable is Numerical while the other one is categorical.
It has basically three types:
Line Chart with Error Bars
Z-test and T-test
Analysis of Variance (Anova)
Line Chart with Error Bars
A line chart with error bars displays information as a series of data points connected by straight
line segments.
Each data point is average of the numerical data for the corresponding category of the categorical
variable with error bar showing standard error.
 It is a way to summarize how pieces of information are related and how they vary depending on
one another.
z – test and t- test
Z-test and t-test are basically the same. They assess whether the averages of two groups are
statistically different from each other.
This analysis is appropriate for comparing the averages of a numerical variable for two categories
of a categorical variable.
t-test
• When the n1 or n2 is less than 30 we use the t-test instead of the Z-test.
Analysis of Variance(Anova)
The ANOVA test assesses whether the averages of more than two groups are statistically different
from each other.
This analysis is appropriate for comparing the averages of a numerical variable for more than two
categories of a categorical variable.

More Related Content

Similar to Bi analysis

Correlation and regression
Correlation and regressionCorrelation and regression
Correlation and regressionAntony Raj
 
Correlation analysis notes
Correlation analysis notesCorrelation analysis notes
Correlation analysis notesJapheth Muthama
 
STATISTICAL REGRESSION MODELS
STATISTICAL REGRESSION MODELSSTATISTICAL REGRESSION MODELS
STATISTICAL REGRESSION MODELSAneesa K Ayoob
 
correlationppt-111222215110-phpapp02.pdf
correlationppt-111222215110-phpapp02.pdfcorrelationppt-111222215110-phpapp02.pdf
correlationppt-111222215110-phpapp02.pdfKrishnaVamsiMuthinen
 
Unit-III Correlation and Regression.pptx
Unit-III Correlation and Regression.pptxUnit-III Correlation and Regression.pptx
Unit-III Correlation and Regression.pptxAnusuya123
 
Introduction to correlation and regression analysis
Introduction to correlation and regression analysisIntroduction to correlation and regression analysis
Introduction to correlation and regression analysisFarzad Javidanrad
 
Correlation.pptx
Correlation.pptxCorrelation.pptx
Correlation.pptxIloveBepis
 
9_Different_Statistical_Techniques.pptx
9_Different_Statistical_Techniques.pptx9_Different_Statistical_Techniques.pptx
9_Different_Statistical_Techniques.pptxVangie Esquillo
 
Linear regression
Linear regressionLinear regression
Linear regressionDepEd
 
Correlation and regression
Correlation and regressionCorrelation and regression
Correlation and regressionAntony Raj
 
Lesson 16 Data Analysis Ii
Lesson 16 Data Analysis IiLesson 16 Data Analysis Ii
Lesson 16 Data Analysis Iivinod
 

Similar to Bi analysis (20)

IDS.pdf
IDS.pdfIDS.pdf
IDS.pdf
 
2-20-04.ppt
2-20-04.ppt2-20-04.ppt
2-20-04.ppt
 
Regression
RegressionRegression
Regression
 
Regression
RegressionRegression
Regression
 
S1 pb
S1 pbS1 pb
S1 pb
 
Correlation and regression
Correlation and regressionCorrelation and regression
Correlation and regression
 
Correlation analysis notes
Correlation analysis notesCorrelation analysis notes
Correlation analysis notes
 
STATISTICAL REGRESSION MODELS
STATISTICAL REGRESSION MODELSSTATISTICAL REGRESSION MODELS
STATISTICAL REGRESSION MODELS
 
correlationppt-111222215110-phpapp02.pdf
correlationppt-111222215110-phpapp02.pdfcorrelationppt-111222215110-phpapp02.pdf
correlationppt-111222215110-phpapp02.pdf
 
Research Methodology-Chapter 14
Research Methodology-Chapter 14Research Methodology-Chapter 14
Research Methodology-Chapter 14
 
Unit-III Correlation and Regression.pptx
Unit-III Correlation and Regression.pptxUnit-III Correlation and Regression.pptx
Unit-III Correlation and Regression.pptx
 
Regression analysis
Regression analysisRegression analysis
Regression analysis
 
Correlation and Regression
Correlation and Regression Correlation and Regression
Correlation and Regression
 
Introduction to correlation and regression analysis
Introduction to correlation and regression analysisIntroduction to correlation and regression analysis
Introduction to correlation and regression analysis
 
Correlation.pptx
Correlation.pptxCorrelation.pptx
Correlation.pptx
 
Chi2 Anova
Chi2 AnovaChi2 Anova
Chi2 Anova
 
9_Different_Statistical_Techniques.pptx
9_Different_Statistical_Techniques.pptx9_Different_Statistical_Techniques.pptx
9_Different_Statistical_Techniques.pptx
 
Linear regression
Linear regressionLinear regression
Linear regression
 
Correlation and regression
Correlation and regressionCorrelation and regression
Correlation and regression
 
Lesson 16 Data Analysis Ii
Lesson 16 Data Analysis IiLesson 16 Data Analysis Ii
Lesson 16 Data Analysis Ii
 

More from KundanKumar17747

More from KundanKumar17747 (6)

ppt4.pptx
ppt4.pptxppt4.pptx
ppt4.pptx
 
ppt3.pptx
ppt3.pptxppt3.pptx
ppt3.pptx
 
ppt1.pptx
ppt1.pptxppt1.pptx
ppt1.pptx
 
Theories.pptx
Theories.pptxTheories.pptx
Theories.pptx
 
Analysis.pptx
Analysis.pptxAnalysis.pptx
Analysis.pptx
 
9781111533960_PPT_ch04.ppt
9781111533960_PPT_ch04.ppt9781111533960_PPT_ch04.ppt
9781111533960_PPT_ch04.ppt
 

Recently uploaded

Monte Carlo simulation : Simulation using MCSM
Monte Carlo simulation : Simulation using MCSMMonte Carlo simulation : Simulation using MCSM
Monte Carlo simulation : Simulation using MCSMRavindra Nath Shukla
 
MONA 98765-12871 CALL GIRLS IN LUDHIANA LUDHIANA CALL GIRL
MONA 98765-12871 CALL GIRLS IN LUDHIANA LUDHIANA CALL GIRLMONA 98765-12871 CALL GIRLS IN LUDHIANA LUDHIANA CALL GIRL
MONA 98765-12871 CALL GIRLS IN LUDHIANA LUDHIANA CALL GIRLSeo
 
Russian Faridabad Call Girls(Badarpur) : ☎ 8168257667, @4999
Russian Faridabad Call Girls(Badarpur) : ☎ 8168257667, @4999Russian Faridabad Call Girls(Badarpur) : ☎ 8168257667, @4999
Russian Faridabad Call Girls(Badarpur) : ☎ 8168257667, @4999Tina Ji
 
Enhancing and Restoring Safety & Quality Cultures - Dave Litwiller - May 2024...
Enhancing and Restoring Safety & Quality Cultures - Dave Litwiller - May 2024...Enhancing and Restoring Safety & Quality Cultures - Dave Litwiller - May 2024...
Enhancing and Restoring Safety & Quality Cultures - Dave Litwiller - May 2024...Dave Litwiller
 
Lucknow 💋 Escorts in Lucknow - 450+ Call Girl Cash Payment 8923113531 Neha Th...
Lucknow 💋 Escorts in Lucknow - 450+ Call Girl Cash Payment 8923113531 Neha Th...Lucknow 💋 Escorts in Lucknow - 450+ Call Girl Cash Payment 8923113531 Neha Th...
Lucknow 💋 Escorts in Lucknow - 450+ Call Girl Cash Payment 8923113531 Neha Th...anilsa9823
 
Monthly Social Media Update April 2024 pptx.pptx
Monthly Social Media Update April 2024 pptx.pptxMonthly Social Media Update April 2024 pptx.pptx
Monthly Social Media Update April 2024 pptx.pptxAndy Lambert
 
VIP Kolkata Call Girl Howrah 👉 8250192130 Available With Room
VIP Kolkata Call Girl Howrah 👉 8250192130  Available With RoomVIP Kolkata Call Girl Howrah 👉 8250192130  Available With Room
VIP Kolkata Call Girl Howrah 👉 8250192130 Available With Roomdivyansh0kumar0
 
Yaroslav Rozhankivskyy: Три складові і три передумови максимальної продуктивн...
Yaroslav Rozhankivskyy: Три складові і три передумови максимальної продуктивн...Yaroslav Rozhankivskyy: Три складові і три передумови максимальної продуктивн...
Yaroslav Rozhankivskyy: Три складові і три передумови максимальної продуктивн...Lviv Startup Club
 
Catalogue ONG NUOC PPR DE NHAT .pdf
Catalogue ONG NUOC PPR DE NHAT      .pdfCatalogue ONG NUOC PPR DE NHAT      .pdf
Catalogue ONG NUOC PPR DE NHAT .pdfOrient Homes
 
Eni 2024 1Q Results - 24.04.24 business.
Eni 2024 1Q Results - 24.04.24 business.Eni 2024 1Q Results - 24.04.24 business.
Eni 2024 1Q Results - 24.04.24 business.Eni
 
7.pdf This presentation captures many uses and the significance of the number...
7.pdf This presentation captures many uses and the significance of the number...7.pdf This presentation captures many uses and the significance of the number...
7.pdf This presentation captures many uses and the significance of the number...Paul Menig
 
Call Girls In Panjim North Goa 9971646499 Genuine Service
Call Girls In Panjim North Goa 9971646499 Genuine ServiceCall Girls In Panjim North Goa 9971646499 Genuine Service
Call Girls In Panjim North Goa 9971646499 Genuine Serviceritikaroy0888
 
RE Capital's Visionary Leadership under Newman Leech
RE Capital's Visionary Leadership under Newman LeechRE Capital's Visionary Leadership under Newman Leech
RE Capital's Visionary Leadership under Newman LeechNewman George Leech
 
Best VIP Call Girls Noida Sector 40 Call Me: 8448380779
Best VIP Call Girls Noida Sector 40 Call Me: 8448380779Best VIP Call Girls Noida Sector 40 Call Me: 8448380779
Best VIP Call Girls Noida Sector 40 Call Me: 8448380779Delhi Call girls
 
The Coffee Bean & Tea Leaf(CBTL), Business strategy case study
The Coffee Bean & Tea Leaf(CBTL), Business strategy case studyThe Coffee Bean & Tea Leaf(CBTL), Business strategy case study
The Coffee Bean & Tea Leaf(CBTL), Business strategy case studyEthan lee
 
Tech Startup Growth Hacking 101 - Basics on Growth Marketing
Tech Startup Growth Hacking 101  - Basics on Growth MarketingTech Startup Growth Hacking 101  - Basics on Growth Marketing
Tech Startup Growth Hacking 101 - Basics on Growth MarketingShawn Pang
 
M.C Lodges -- Guest House in Jhang.
M.C Lodges --  Guest House in Jhang.M.C Lodges --  Guest House in Jhang.
M.C Lodges -- Guest House in Jhang.Aaiza Hassan
 
BEST ✨ Call Girls In Indirapuram Ghaziabad ✔️ 9871031762 ✔️ Escorts Service...
BEST ✨ Call Girls In  Indirapuram Ghaziabad  ✔️ 9871031762 ✔️ Escorts Service...BEST ✨ Call Girls In  Indirapuram Ghaziabad  ✔️ 9871031762 ✔️ Escorts Service...
BEST ✨ Call Girls In Indirapuram Ghaziabad ✔️ 9871031762 ✔️ Escorts Service...noida100girls
 

Recently uploaded (20)

Monte Carlo simulation : Simulation using MCSM
Monte Carlo simulation : Simulation using MCSMMonte Carlo simulation : Simulation using MCSM
Monte Carlo simulation : Simulation using MCSM
 
MONA 98765-12871 CALL GIRLS IN LUDHIANA LUDHIANA CALL GIRL
MONA 98765-12871 CALL GIRLS IN LUDHIANA LUDHIANA CALL GIRLMONA 98765-12871 CALL GIRLS IN LUDHIANA LUDHIANA CALL GIRL
MONA 98765-12871 CALL GIRLS IN LUDHIANA LUDHIANA CALL GIRL
 
Russian Faridabad Call Girls(Badarpur) : ☎ 8168257667, @4999
Russian Faridabad Call Girls(Badarpur) : ☎ 8168257667, @4999Russian Faridabad Call Girls(Badarpur) : ☎ 8168257667, @4999
Russian Faridabad Call Girls(Badarpur) : ☎ 8168257667, @4999
 
Enhancing and Restoring Safety & Quality Cultures - Dave Litwiller - May 2024...
Enhancing and Restoring Safety & Quality Cultures - Dave Litwiller - May 2024...Enhancing and Restoring Safety & Quality Cultures - Dave Litwiller - May 2024...
Enhancing and Restoring Safety & Quality Cultures - Dave Litwiller - May 2024...
 
Lucknow 💋 Escorts in Lucknow - 450+ Call Girl Cash Payment 8923113531 Neha Th...
Lucknow 💋 Escorts in Lucknow - 450+ Call Girl Cash Payment 8923113531 Neha Th...Lucknow 💋 Escorts in Lucknow - 450+ Call Girl Cash Payment 8923113531 Neha Th...
Lucknow 💋 Escorts in Lucknow - 450+ Call Girl Cash Payment 8923113531 Neha Th...
 
Monthly Social Media Update April 2024 pptx.pptx
Monthly Social Media Update April 2024 pptx.pptxMonthly Social Media Update April 2024 pptx.pptx
Monthly Social Media Update April 2024 pptx.pptx
 
VIP Kolkata Call Girl Howrah 👉 8250192130 Available With Room
VIP Kolkata Call Girl Howrah 👉 8250192130  Available With RoomVIP Kolkata Call Girl Howrah 👉 8250192130  Available With Room
VIP Kolkata Call Girl Howrah 👉 8250192130 Available With Room
 
Yaroslav Rozhankivskyy: Три складові і три передумови максимальної продуктивн...
Yaroslav Rozhankivskyy: Три складові і три передумови максимальної продуктивн...Yaroslav Rozhankivskyy: Три складові і три передумови максимальної продуктивн...
Yaroslav Rozhankivskyy: Три складові і три передумови максимальної продуктивн...
 
Catalogue ONG NUOC PPR DE NHAT .pdf
Catalogue ONG NUOC PPR DE NHAT      .pdfCatalogue ONG NUOC PPR DE NHAT      .pdf
Catalogue ONG NUOC PPR DE NHAT .pdf
 
Eni 2024 1Q Results - 24.04.24 business.
Eni 2024 1Q Results - 24.04.24 business.Eni 2024 1Q Results - 24.04.24 business.
Eni 2024 1Q Results - 24.04.24 business.
 
KestrelPro Flyer Japan IT Week 2024 (English)
KestrelPro Flyer Japan IT Week 2024 (English)KestrelPro Flyer Japan IT Week 2024 (English)
KestrelPro Flyer Japan IT Week 2024 (English)
 
7.pdf This presentation captures many uses and the significance of the number...
7.pdf This presentation captures many uses and the significance of the number...7.pdf This presentation captures many uses and the significance of the number...
7.pdf This presentation captures many uses and the significance of the number...
 
Nepali Escort Girl Kakori \ 9548273370 Indian Call Girls Service Lucknow ₹,9517
Nepali Escort Girl Kakori \ 9548273370 Indian Call Girls Service Lucknow ₹,9517Nepali Escort Girl Kakori \ 9548273370 Indian Call Girls Service Lucknow ₹,9517
Nepali Escort Girl Kakori \ 9548273370 Indian Call Girls Service Lucknow ₹,9517
 
Call Girls In Panjim North Goa 9971646499 Genuine Service
Call Girls In Panjim North Goa 9971646499 Genuine ServiceCall Girls In Panjim North Goa 9971646499 Genuine Service
Call Girls In Panjim North Goa 9971646499 Genuine Service
 
RE Capital's Visionary Leadership under Newman Leech
RE Capital's Visionary Leadership under Newman LeechRE Capital's Visionary Leadership under Newman Leech
RE Capital's Visionary Leadership under Newman Leech
 
Best VIP Call Girls Noida Sector 40 Call Me: 8448380779
Best VIP Call Girls Noida Sector 40 Call Me: 8448380779Best VIP Call Girls Noida Sector 40 Call Me: 8448380779
Best VIP Call Girls Noida Sector 40 Call Me: 8448380779
 
The Coffee Bean & Tea Leaf(CBTL), Business strategy case study
The Coffee Bean & Tea Leaf(CBTL), Business strategy case studyThe Coffee Bean & Tea Leaf(CBTL), Business strategy case study
The Coffee Bean & Tea Leaf(CBTL), Business strategy case study
 
Tech Startup Growth Hacking 101 - Basics on Growth Marketing
Tech Startup Growth Hacking 101  - Basics on Growth MarketingTech Startup Growth Hacking 101  - Basics on Growth Marketing
Tech Startup Growth Hacking 101 - Basics on Growth Marketing
 
M.C Lodges -- Guest House in Jhang.
M.C Lodges --  Guest House in Jhang.M.C Lodges --  Guest House in Jhang.
M.C Lodges -- Guest House in Jhang.
 
BEST ✨ Call Girls In Indirapuram Ghaziabad ✔️ 9871031762 ✔️ Escorts Service...
BEST ✨ Call Girls In  Indirapuram Ghaziabad  ✔️ 9871031762 ✔️ Escorts Service...BEST ✨ Call Girls In  Indirapuram Ghaziabad  ✔️ 9871031762 ✔️ Escorts Service...
BEST ✨ Call Girls In Indirapuram Ghaziabad ✔️ 9871031762 ✔️ Escorts Service...
 

Bi analysis

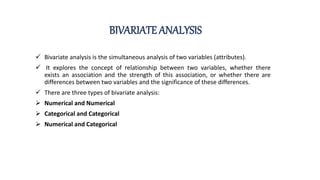
  • 1. BIVARIATE ANALYSIS  Bivariate analysis is the simultaneous analysis of two variables (attributes).  It explores the concept of relationship between two variables, whether there exists an association and the strength of this association, or whether there are differences between two variables and the significance of these differences.  There are three types of bivariate analysis:  Numerical and Numerical  Categorical and Categorical  Numerical and Categorical
  • 2. Numerical and Numerical  In this type, both the variables of bivariate data, independent and dependent, are having numerical values. It has basically two types: Scatter Plot Linear Correlation
  • 3. Scatter Plot  Scatter plots are the graphs that present the relationship between two variables in a data-set.  The independent variable or attribute is plotted on the X-axis, while the dependent variable is plotted on the Y-axis.  Scatter plots are used in either of the following situations. • When we have paired numerical data • When there are multiple values of the dependent variable for a unique value of an independent variable
  • 4. Linear Correlation Linear correlation quantifies the strength of a linear relationship between two numerical variables. When there is no correlation between two variables, there is no tendency for the values of one quantity to increase or decrease with the values of the second quantity. Strength of a linear relationship is denoted by r and is always between -1 and 1 where -1 means perfect negative linear correlation and +1 means perfect positive linear correlation and zero means no linear correlation. Example-
  • 5. Categorical and Categorical  In this type, both the variables of bivariate data, independent and dependent, are Categorical. It has basically three types: Stacked Column Chart Combination Chart Chi-Square Test
  • 6. Stacked Column Chart Stacked Column chart is a useful graph to visualize the relationship between two categorical variables. It compares the percentage that each category from one variable contributes to a total across categories of the second variable.
  • 7. Combination Chart The combination chart is a visualization that combines the features of the bar chart and the line chart.  The combination chart displays the data using a number of bars and/or lines, each of which represent a particular category. A combination of bars and lines in the same visualization can be useful when comparing values in different categories, since the combination gives a clear view of which category is higher or lower.
  • 8. Chi-Square Test The chi-square test can be used to determine the association between categorical variables. It is based on the difference between the expected frequencies (e) and the observed frequencies (n) in one or more categories in the frequency table. The chi-square distribution returns a probability for the computed chi-square and the degree of freedom. A probability of zero shows a complete dependency between two categorical variables and a probability of one means that two categorical variables are completely independent.
  • 9. Numerical and Categorical In this type ,one of the variable is Numerical while the other one is categorical. It has basically three types: Line Chart with Error Bars Z-test and T-test Analysis of Variance (Anova)
  • 10. Line Chart with Error Bars A line chart with error bars displays information as a series of data points connected by straight line segments. Each data point is average of the numerical data for the corresponding category of the categorical variable with error bar showing standard error.  It is a way to summarize how pieces of information are related and how they vary depending on one another.
  • 11. z – test and t- test Z-test and t-test are basically the same. They assess whether the averages of two groups are statistically different from each other. This analysis is appropriate for comparing the averages of a numerical variable for two categories of a categorical variable.
  • 12. t-test • When the n1 or n2 is less than 30 we use the t-test instead of the Z-test.
  • 13. Analysis of Variance(Anova) The ANOVA test assesses whether the averages of more than two groups are statistically different from each other. This analysis is appropriate for comparing the averages of a numerical variable for more than two categories of a categorical variable.