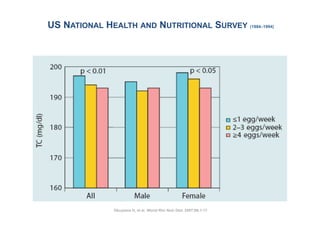
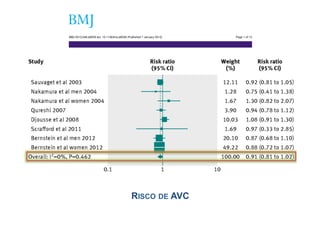
1) Higher consumption of eggs (up to one egg per day) is not associated with an increased risk of coronary heart disease or stroke according to a meta-analysis of prospective cohort studies.
2) The meta-analysis found an increased risk of coronary heart disease among diabetic patients who consumed more eggs, warranting further study.
3) The meta-analysis also found a reduced risk of hemorrhagic stroke with higher egg consumption, again warranting further study in subgroup analyses.


![24, 25]. Other cholesterol-containing foods, such as dairy fed for 4 weeks with a 1-month washout period in between.
products, also contain high concentrations of saturated fat, The participants were classified as insulin sensitive (n=65),
Curr Atheroscler Rep (2010) 12:377–383
which is a confounder for dietary cholesterol effects. This
DOI 10.1007/s11883-010-0130-7
insulin resistant (n=75), and obese insulin resistant (OIR,
might be the reason why controversial results exist n=58). Insulin-resistant and insulin-sensitive individuals had
regarding the effects of dairy products on CHD risk [26]. significant increases in LDL-C of 7.8% and 3.3%, respec-
Clinical trials conducted in children [27], younger adults tively, after consuming 4 eggs per day, whereas OIR
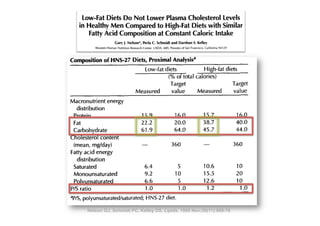
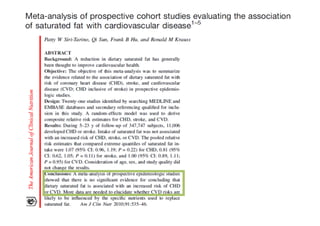
Revisiting Dietary Cholesterol Recommendations: LDL-C at any intake level.
[24, 25], and the elderly [28, 29] have clearly demonstrated individuals had no changes in
that although dietary cholesterol provided by eggs signifi-
Does the Evidence Support a LimitHDL-C was significantly increased for all groups
In contrast,
of 300 mg/d?
cantly increases LDL-C in one third of the population, those even after the consumption of only 2 eggs per day. These
individuals considered hyper-responders to & a cholesterol
Maria Luz Fernandez Mariana Calle studies suggest that dietary management of OIR individuals
challenge exhibit increases in both LDL-C and HDL-C, with need not include restrictions on eggs.
Table 2 Changes in LDL-C, HDL-C, LDL size, and HDL size as a response to dietary cholesterol provided by eggs in various populations
Published online: 4 August 2010
# Springer Science+Business Media, LLC 2010
Population Duration Additional dietary cholesterol LDL-C HDL-C LDL-C/HDL-C ratio LDL size HDL size
Children (n=54) [27] 4 Abstract The mg/d
wk 518 perceived association between Increase Introduction No change
dietary cho- Increase Increase ND
lesterol (DC) and risk for coronary heart disease (CHD) has
Women (n=51) [25] 4 resulted in recommendations of no more than 300 mg/d for Increase
wk 640 mg/d Increase The AmericanNo change
Heart Association (AHA)Increase
recommends ND
no
Men (n=28) [32••] 12 healthy 640 mg/d the United States. These change Increase 300 Decrease
wk persons in No dietary more than mg/d of dietary cholesterolIncrease healthy
(DC) for Increase
recommendations proposed in the 1960s had little scientific
Men/women (n=42) [34] 12 wk 215 mg/d No change Increaseto prevent change risk for coronary heart disease
persons
No increased Increase Increase
evidence other than the known association between (CHD) [1]. These recommendations are mostly based on
Men/women (n=34) [28] 4 saturated640 and cholesterol and animal studies where Increase
wk fat mg/d Increase No change Increase Increase
the presence of both saturated fat and cholesterol in many
Men/women (n=56) [35•] 12 wk 250 mg/d No normal foods and onDecrease
cholesterol was fed in amounts far exceeding change Increase data derived from animal studies where
ND ND
intakes. In contrast, European countries, Asian countries, supraphysiologic doses of cholesterol, ranging from the
Men/women (n=45) [33•] 12 and Canada do not have an upper limit for DC. change No changeof 1,000 mg to 20,000 mg/d for humans, were
wk 400 mg/d No Further, equivalent No change ND ND
current epidemiologic data have clearly demonstrated that fed in order to produce atherosclerosis [2].
HDL-C high-density lipoprotein increasing concentrations of DC arelipoprotein cholesterol; ND not determined. that many other countries do not
cholesterol; LDL-C low-density not correlated with It is important to note
increased risk for CHD. Clinical studies have shown that have the same guidelines for DC. Canada [3••], Korea [4•],
even if DC may increase plasma low-density lipoprotein New Zealand [5], and India [6], for example, do not set an
(LDL) cholesterol in certain individuals (hyper-responders), upper limit for DC, focusing instead on controlling the
this is always accompanied by increases in high-density intake of saturated fat and trans fat, which are the major
lipoprotein (HDL) cholesterol, so the LDL/HDL cholesterol determinants of blood cholesterol concentrations. Similarly,
ratio is maintained. More importantly, DC reduces circu- the European guidelines on cardiovascular disease preven-
lating levels of small, dense LDL particles, a well-defined tion have the following recommendations regarding healthy
risk factor for CHD. This article presents recent evidence food choices: “consume a wide variety of foods, adjust
from human studies documenting the lack of effect of DC energy intake to maintain a healthy weight, encourage
on CHD risk, suggesting that guidelines for DC should be consumption of fruits and vegetables, replace saturated fat
revisited. with mono or polyunsaturated fatty acids and reduce salt
intake” [7]. In contrast to US policies, Europeans have no
Keywords Dietary cholesterol . LDL cholesterol . dietary guidelines for DC [7]. A summary of the dietary](https://image.slidesharecdn.com/dietaeprevencaocvdversaoslideshare-130327150722-phpapp02/85/Dieta-e-prevencao-cvd-versao-slideshare-12-320.jpg)

![dification Trial (CVD) prevention, butand some trials have linked diet needed.
Context Multiple epidemiologic studies
cation Trial disease
diovascular long-term intervention data are
with car-
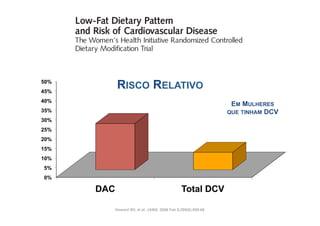
Linda Objective To test the hypothesis that a dietary intervention, intended to be low in
Context Multiple epidemiologic some trials some trials have linked diet with risk.
Context Multiple epidemiologic studies andstudies andhave linked diet with reduce CVD car-
Hsia, MD; fat and high in vegetables, fruits, and grains to reduce cancer, wouldcar-
.
D;
diovascular disease (CVD) prevention, but long-term intervention data are needed. are needed.
diovascular disease (CVD) prevention, but long-term intervention data
L. ; L. Design, Setting, and Participants Randomized controlled trial of 48 835 post-
arcia
D Objective To test the that a dietary intervention, intended to be low in
Objective To test the hypothesishypothesis that a dietary intervention, intended to be low in
menopausal women aged 50 tograins to reduce cancer, would reduce CVD risk.
79 years, of diverse backgrounds and ethnicities, who
fat and highand high in vegetables, fruits, and grains to reduce cancer, would reduce CVD risk.
s; H. fat in vegetables, fruits, and
Lewis H. participated in the Women’s Health Initiative Dietary Modification Trial. Women were
Croix, PhDDesign,Design, Setting, and Participants 541 [40%]) or of 48 835trial of 48 835 post-
PhD; ; Setting, and Participants Randomized controlled trial
an intervention (19 Randomized controlled
post-
randomly assigned to 50 to 79 years, of diverse backgrounds and ethnicities, whogroup (29 294
comparison
L. menopausal women aged
orman L. [60%]) menopausal women agedStudy79 years, of diverse backgrounds and ethnicities, who
in in the Women’s Health 50 to Dietary Modification Trial. Women 1993 and 1998 in
; , MD; participateda free-living setting.InitiativeenrollmentDietary Modification were Women were
participated in the Women’s Health Initiative
occurred between
Trial.
s 40 US clinical centers;intervention (19 541 in this 541 [40%]) orgroup (29 294 group (29 294
randomly assigned to an mean follow-up [40%]) analysis was 8.1 years.
or comparison
L.
Karen L. [60%]) in a free-living setting.to an intervention (19 between 1993 and 1998 in
randomly assigned
Study enrollment occurred
comparison
MD;
D; , MD; InterventioninIntensive behavior Study enrollment group and individual sessions de-
ysiw
. 40 US clinical centers; mean follow-up in this analysis wasin occurred between 1993 and 1998 in
[60%]) a free-living setting. modification 8.1 years.
inda M. signed to reduce total fat intake tofollow-up calories and increase intakes of vegetables/
PhD;
40 US clinical centers; mean 20% of in this analysis was 8.1 years.
Intervention Intensive behavior modification in group and individual sessions de-
Perri, PhD;fruits toInterventionand grains behavior modification inintakescomparison group received
signed to5 servings/d intake to 20% of calories and increase group of vegetables/ sessions de-
reduce total fat Intensive to at least 6 servings/d. The and individual
D; L.
oss diet-related educationgrains to at intake servings/d. The comparison group received of vegetables/
fruits to 5 servings/d and materials.
signed to reduce total fat least 6 to 20% of calories and increase intakes
bins, G. ; Main Outcome Measures grains to at least 6 servings/d. The comparison group received
fruits to 5 servings/d and
nda MD diet-related education materials.
E. Fatal and nonfatal coronary heart disease (CHD), fatal
diet-related education materials.
RISCO
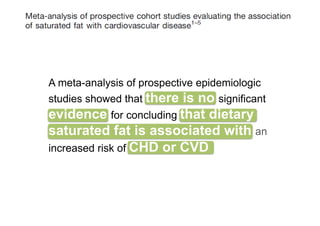
0%
5%
10%
15%
20%
25%
DAC
Total
DCV
RELATIVO
GloriaG. and nonfatal stroke, and CVD and nonfatal coronary heart disease (CHD), fatal
Linda E. Main Outcome Measures Fatal (composite of CHD and stroke).
PhD;
ns, MD; ;Linda G.nonfatal stroke, and CVD (compositeFatal and nonfatal coronary heart disease (CHD), fatal
z, PhD and Main Outcome Measures of CHD and stroke).
Results By year 6, mean fat intakeintake decreased byenergy intake in the inter- in the inter-
Resultsand nonfatal stroke, and CVD (composite of CHD and stroke). intake
Stevens, PhD; By year 6, mean fat decreased by 8.2% of 8.2% of energy
PH; ; ventionvs the comparison group, with small decreases in saturated (2.9%), monoun-
DrPH
aurizio vention Results By year 6, mean fatwith small decreases in saturated (2.9%), monoun-
vs the comparison group,
intake decreased by 8.2% of energy intake in the inter-
se R. ,
ouise R. DrPH;
tolins saturated (3.3%),the comparison group, withincreases occurred :in-intakes of veg-intakes of veg-
saturated (3.3%), and polyunsaturated (1.5%) (1.5%) fat; increases occurred in
and polyunsaturated fat; small decreases in saturated (2.9%), monoun-
TRANS 22%
D; vention vs
; Annlouiseetables/fruits (1.1(3.3%), and grains grains (0.5 serving/d). Low-density lipoprotein cholesterol
etables/fruits (1.1 servings/d)
R. (0.5 serving/d). Low-density lipoprotein cholesterol
saturated servings/d) polyunsaturated (1.5%) fat; increases occurred in intakes of veg-
and and
y R. MD; levels,diastolic blood pressure, and factor VIIc levels were+11% Low-density lipoprotein cholesterol
enry R.
ord,; levels, diastolic blood pressure, and factor VIIc levels were significantly reduced16%
HORTALIÇAS/FRUTA: +30% CEREAIS: significantly reduced by FIBRA: +
etables/fruits and 4.29%, respectively; levels of high-density lipoprotein cho-
(1.1 servings/d) and grains (0.5 serving/d).
3.55 by 3.55
PhD mg/dL, 0.31 mm Hg,
D; ; Henry mg/dL, levels, mm Hg,blood 4.29%, respectively; levels of high-density lipoprotein 3.55
hD R. 0.31 diastolic and pressure, and factor VIIc levels were significantly reduced by cho-
lesterol, triglycerides, glucose, and insulin did not significantly differ in the intervention
unner, PhDlesterol,mg/dL, 0.31 mm numbers who developed CHD,significantly differ in the intervention
ski, MD; ;vs comparison groups. The Hg, and 4.29%, respectively;stroke, of high-density lipoprotein cho-
triglycerides, glucose, and insulin did not levels and CVD (annual-
,ette; ; vs comparison groups. 1000glucose, and JAMA.developed CHD, stroke, and CVD (annual-
MD MD ized incidence rates) were The (0.63%), et al. insulin didand 1357 (0.86%)differ in the intervention
lesterol, triglycerides, numbers who 2006 Feb 8;295(6):655-66
Howard BV, 434 (0.28%), not significantly in the in-
hlebowski, ized incidence rates) were 1000 (0.63%), 434 (0.28%),CHD, 1357 (0.86%) in the in-
D; MD;
tervention and 1549 (0.65%), 642 (0.27%), and 2088 (0.88%) in the comparison group. CVD (annual-
vs comparison groups. The numbers who developed and stroke, and
ranek, MD; The diet ized no significant effects on incidence of CHD434 (0.28%), and 0.97; 95%
had incidence rates) were 1000 (0.63%), (hazard ratio [HR], 1357 (0.86%) in the in-](https://image.slidesharecdn.com/dietaeprevencaocvdversaoslideshare-130327150722-phpapp02/85/Dieta-e-prevencao-cvd-versao-slideshare-19-320.jpg)

![Based on Evolutionary, Historical,
Dietary Fat Quality and Coronary Heart
Global, and Modern ed Theory
Disease Prevention: A Unifi Perspectives
Christopher E.on Evolutionary, Historical,
Based Ramsden, MD
Global, and Modern Perspectives
Keturah R. Faurot, PA, MPH
Pedro ChristopherFaurot, PA, MPH
Carrera-Bastos, MD
Keturah R.
E. Ramsden, BA
Loren Pedro Carrera-Bastos, BA
Cordain, PhD
Loren Cordain, PhD
Michel De De Lorgeril, MD, PhD PhD
Michel
Lorgeril, MD,
Laurence S. Sperling, MD
Laurence S. Sperling, MD
Corresponding author
Corresponding author
Christopher E. Ramsden, MD
Department of Physical Medicine and Rehabilitation, Program on
Christopher E. Ramsden,University of North Carolina–Chapel Hill School
Integrative Medicine, MD
Department Medicine, CB# 7200, Chapel Hill, and Rehabilitation, Program on
of of Physical Medicine NC 27599, USA.
E-mail: cramsden@med.unc.edu
Integrative Current Treatment Options in Cardiovascular Medicine 2009, 11:289–301Hill School
Medicine, University of North Carolina–Chapel
of Medicine, CB# 7200, Chapel Hill, NC 27599, USA.
Current Medicine Group LLC ISSN 1092-8464
Copyright © 2009 by Current Medicine Group LLC
E-mail: cramsden@med.unc.edu
Current Treatmentstatement in Cardiovascular Medicine 2009, 11:289–301
Opinion Options
Current Medicine and growing body of evidence indicates that dietary fatty acids regulate
A large Group LLC ISSN 1092-8464
Copyright © 2009 by Current Medicine in the pathogenesis of coronary heart disease
crucial metabolic processes involved Group LLC
(CHD). Despite this evidence, optimal dietary fatty acid intakes for CHD preven-
tion remain unclear. Significant gaps in the modern nutrition literature and contra-
dictions in its interpretation have precluded broad consensus. These shortcomings
Opinion statement
can be addressed through the incorporation of evolutionary, historical, and global
perspectives. The objective of this review is to propose a unified theory of optimal
A large and growing bodyCHD evidence indicates that dietary fatty acids regulate
dietary fatty acid intake for of prevention that integrates critical insights from
evolutionary, historical, global, and modern perspectives. This broad approach may
crucial metabolic processesmethods to characterize optimal fatty acid intakes. coronary heart disease
be more likely than previous involved in the pathogenesis of
(CHD). Despite this evidence, optimal dietary fatty acid intakes for CHD preven-
tion remain unclear. Significant gaps in the modern nutrition literature and contra-
Introduction
dictions Coronaryinterpretation have precluded broad consensus. Thesewith increasing dura-
in its heart disease (CHD) incidence and mor- resident inhabitants, especially shortcomings
can be addressed through the incorporation tion of residence [5–7].
tality reflect complex interactions between genetic of evolutionary, historical, and global
susceptibilities and environmental factors. Although For instance, CHD is historically far more common in
perspectives. CHD susceptibility genesthis review is to the United States unified theory of men of Japa-
several The objective of have been identified propose a than in Japan [4]. Among optimal
dietary fattyrather lines genetics is the main driver environ- nese ancestry,highestriskCaliforniain[8,9]. These differences
ment
acid intake for CHD prevention Hawaii,integrates is lowest Japan, intermediate in
[1], several
than
of evidence indicate that
of CHD
that and CHD in critical insights from
evolutionary, historical, global,CHD incidence and appear to reflect This broad of traditional Japanese
risk [2]. Globally, age-adjusted and modern perspectives. the replacement approach may
be moremortality vary as previous factors arepopulations cultural traditions with Western acid [8]. Indeed, Japa-
likely than much as 10-fold across sensitive to nese Americans who maintained habits intakes. and
[3,4]. CHD incidence and risk
methods to characterize optimal fatty traditional customs
lifestyle changes. When immigrants from traditionally habits had a CHD risk similar to that of their counterparts
low-risk regions adopt the habits of high-risk popula- residing in Japan, whereas those who adopted Western cul-
tions, their CHD incidence rises to approach that of ture had a three- to fivefold excess in CHD prevalence [8].
Introduction](https://image.slidesharecdn.com/dietaeprevencaocvdversaoslideshare-130327150722-phpapp02/85/Dieta-e-prevencao-cvd-versao-slideshare-26-320.jpg)
![Orange Juice on Inflammation, Endoto
C l li in i icca l l C a rree//EEd uucca t t i o n / N u t r i t oo Expression e of cToll-Like Recept
C n a Ca d a andu the nn / P s y c h o s o c aa l R R s s e a r h h
ion/N tritii /Psychosoci i l e ear c
O R I I G I I N A LL
O R G N A
and Suppressor of Cytokine Signaling-
A R TT I I CC L L EE
A R
RUPALI DEOPURKAR, PHD PRIYA MOHANTY, MD vital to the protection fro
Differential Effects of Cream, Glucose, and
Differential Effects of Cream, Glucose, andHUSAM GHANIM, PHD
JAY FRIEDMAN, PHD
PRABHAKAR VISWANATHAN, PHD
AJAY CHAUDHURI, MD
ins and immunological
commensal and patho
Orange Juice on Inflammation, Endotoxin,
Orange Juice on Inflammation, Endotoxin,
SANAA ABUAYSHEH, BSC PARESH DANDONA, MD, PHD bacteria.
CHANG LING SIA, BSC In this context, we w
which macronutrient wa
and the Expression of Toll-Like Receptor-4
and the Expression of Toll-Like Receptor-4 the induction of oxidati
OBJECTIVE — We have recently shown that a high-fat high-carbohydrate (HFHC) meal flammation, on the one h
and Suppressor of Cytokine Signaling-3
and Suppressor of Cytokine Signaling-3
induces an increase in plasma concentrations of endotoxin (lipopolysaccharide [LPS]) and the crease in LPS concent
expression of Toll-like receptor-4 (TLR-4) and suppresser of cytokine signaling-3 (SOCS3) in
mononuclear cells (MNCs) in addition to oxidative stress and cellular inflammation. Saturated
expression of TLR-4 and
fat and carbohydrates, components of the HFHC meal, known to induce oxidative stress and tokine signaling (SOCS)
RUPALI DEOPURKAR, ,PHD
RUPALI DEOPURKAR PHD PPRIYA induce an , MD in LPS, TLR-4, and SOCS3. toto the protection from To elucidate this, we inv
inflammation, alsoMOHANTYMD
RIYA MOHANTY, increase vital the protection from bacterial tox-
vital bacterial tox-
HUSAM GHANIM, ,PHD
HUSAM GHANIM PHD PPRABHAKAR VISWANATHANPHD
RABHAKAR VISWANATHAN, , PHD ins and immunological responses glucose,
fect ofto the the most
ins and immunological responses to the
JJAYFRIEDMAN, ,PHD
AY FRIEDMAN PHD RESEARCH DESIGN AND METHODS — Fasting normal subjects were given 300- hydrate, cream, a sat
AAJAY CHAUDHURIMD
JAY CHAUDHURI, , MD commensal and pathogenic intestinal
commensal and pathogenic intestinal
SANAA ABUAYSHEH, ,BSC
SANAA ABUAYSHEH BSC calorie drinks of either glucose, saturated fat as cream, orange juice, or only water to ingest. Blood orange juice, a carbohy
PPARESH DANDONAMD, PHD
ARESH DANDONA, , MD, PHD bacteria.
CHANG LING SSIA,BSC bacteria. food product, which do
CHANG LING IA, BSC samples were obtained at 0, 1, 3, and 5 h for analysis.
InIn this context, we wanted to analyzestress or in
this context, we wanted to analyze
ther oxidative
which macronutrient was responsible for is a protein
RESULTS — Indexes of inflammation including nuclear factor-B (NF-B) binding, andwas responsible for
which macronutrient the SOCS3
the induction ofof in MNCs, stress and in-
expression of SOCS3, tumor necrosis factor-␣ (TNF-␣), and interleukin (IL)-1 oxidative
the induction oxidative stress and in-
shown to interfere with i
OBJECTIVE — We have recently shown thatsignificantly high-carbohydrate (HFHC) meal TLR-4 expressionon the one LPS signal transduction (2–
OBJECTIVE — We have recently shown thata ahigh-fat after glucose and cream intake, but flammation, and plasma hand, and the in-
increased high-fat high-carbohydrate (HFHC) meal flammation, on the one hand, and the in-
induces an increase in plasma concentrations of endotoxin (lipopolysaccharide intake. The intake of orangein LPS water did not work has shown that SO
concentrations increased only after cream [LPS]) and the
induces an increase in plasma concentrations of endotoxin (lipopolysaccharide [LPS]) and the crease juice LPS concentrations and the
expression of Toll-like receptor-4 (TLR-4) andany change inof cytokineindexes measured. crease in or concentrations and the
induce suppresser of of the signaling-3 (SOCS3) in
expression of Toll-like receptor-4 (TLR-4) and suppresser anycytokine signaling-3 (SOCS3) in expression of TLR-4 and suppresser of cy-
mononuclear cells (MNCs) in addition to oxidative stress and cellular inflammation. Saturated expression of TLR-4 and suppressercirculating mo
mononuclear cells (MNCs) in addition to oxidative stress and cellular inflammation. Saturated tokine signaling (SOCS)-3 on the other. obese hu
in the of cy-
(MNCs) of the
fat and carbohydrates, components of the HFHC meal, known toto induce oxidative stress and tokine signalingand an in- on the other.
fat and carbohydrates, components of CONCLUSIONSknown induce oxidative stress and induce NF-B binding (SOCS)-3 increased when compar
the HFHC meal, — Although both glucose and cream
To elucidate this, we investigated the ef-
inflammation, also induce an increase in LPS, the expression of SOCS3, TNF-␣, and IL-1 in MNCs, onlyelucidate this, increase normalthe ef-
inflammation, also induce an increase in LPS, inTLR-4, and SOCS3.
crease TLR-4, and SOCS3. To cream caused an we investigated subjects
fectorange juice or watermost important carbo- (6). I
in LPS concentration and TLR-4 expression. Equicaloric amounts of ofof glucose, the did not work carbo-
fect glucose, the most important demonstrated that
hydrate, cream, a a saturated fat, and
hydrate, cream, saturated fat, and
RESEARCH DESIGN AND METHODS — Fasting normal subjects were given 300-are relevant to the pathogenesis of sion in MNCs is inverse
induce a change in any of these indexes. These changes
RESEARCH DESIGN AND METHODS — Fasting normal subjects were given 300- orange juice, a carbohydrate-containing
calorie drinks of either glucose, saturatedatherosclerosisorange juice,resistance. water to ingest. Blood orange juice, a carbohydrate-containing
fat as cream, and insulin or only water to ingest. Blood
calorie drinks of either glucose, saturated fat as cream, orange juice, or only tyrosine phosphorylatio
samples were obtained at 0, 1, 3, and 55 h for analysis.
samples were obtained at 0, 1, 3, and h for analysis. food product, which does not induce and directly rel
product, which does receptor ei-
foodCare 33:991–997, 2010 not induce ei-
Diabetes
ther oxidative stress oror inflammation.
ther oxidative stress inflammation.insulin resistance (home
O
SOCS3 is is a protein that has been
RESULTS — Indexes of inflammation including nuclear factor-Bshown thatbinding, and the because the content of LPS sessment of a protein that has been insulin res
ur recent work has (NF-B) binding, and the shown to interfere with insulin and leptin
RESULTS — Indexes of inflammation including nuclear factor-B (NF-B) a great interest SOCS3
expression of SOCS3, tumor necrosis factor-␣ (TNF-␣), and interleukin (IL)-1 ininthese meals is not to interfere with insulin and leptin
MNCs, IR]), consistent with
expression of SOCS3, tumor necrosis factor-␣ (TNF-␣), and interleukin (IL)-1 in MNCs, shown significantly differ-
high-fat high-cholesterol (HFHC)
increased significantly after glucose and cream intake, but TLR-4 expression and plasma LPS signal transduction (2–5). Our recent of insulin r
increased significantly after glucose and cream intake, butoxidative and inflam- plasma LPS signal transduction (2–5). Our recent
pathogenesis
meal induces TLR-4 expression and ent, and, thus, it would appear that the
concentrations increased only after cream intake. The intake ofof orange juice or water did not work has shown that SOCS3 resistance in human obe
concentrations increased only after cream intake. The intake orange juice oran inflammatory work has shownmay lead
water did not expression
matory stress in addition to inducing nature of the meal that SOCS3 expression
induce any change in any of the indexes measured. inability of leptin to ca](https://image.slidesharecdn.com/dietaeprevencaocvdversaoslideshare-130327150722-phpapp02/85/Dieta-e-prevencao-cvd-versao-slideshare-31-320.jpg)
![(R01-D
Differential Effects of Cream, Gluco the Am
Orange Juice on Inflammation,The da End
and we
and the Expression of Toll-Likepretatio Rec
and Suppressor of Cytokine Signal investig
vestiga
RUPALI DEOPURKAR, PHD PRIYA MOHANTY, MD vitalfor the
to the pro
HUSAM GHANIM, PHD PRABHAKAR VISWANATHAN, PHD ins and immu
JAY FRIEDMAN, PHD AJAY CHAUDHURI, MD commensal p
No a
SANAA ABUAYSHEH, BSC PARESH DANDONA, MD, PHD bacteria. art
this
CHANG LING SIA, BSC In this con
Nata which macron
the induction
OBJECTIVE — We have recently shown that a high-fat high-carbohydrate (HFHC) meal flammation, on
induces an increase in plasma concentrations of endotoxin (lipopolysaccharide [LPS]) and the Referen
crease in LPS
expressionGh
1. of T
expression of Toll-like receptor-4 (TLR-4) and suppresser of cytokine signaling-3 (SOCS3) in
mononuclear cells (MNCs) in addition to oxidative stress and cellular inflammation. Saturated
fat and carbohydrates, components of the HFHC meal, known to induce oxidative stress and tokine signalin
nie
inflammation, also induce an increase in LPS, TLR-4, and SOCS3. To elucidate th
JM
fect of glucose,
RESEARCH DESIGN AND METHODS — Fasting normal subjects were given 300- tox
hydrate, crea
calorie drinks of either glucose, saturated fat as cream, orange juice, or only water to ingest. Blood orange juice,
samples were obtained at 0, 1, 3, and 5 h for analysis. Sumo de of
food product,
Laranja cyt
ther oxidative
RESULTS — Indexes of inflammation including nuclear factor-B (NF-B) binding, and the SOCS3 is
expression of SOCS3, tumor necrosis factor-␣ (TNF-␣), and interleukin (IL)-1 in MNCs,
fol
shown to inter
increased significantly after glucose and cream intake, but TLR-4 expression and plasma LPS me
signal transdu
concentrations increased only after cream intake. The intake of orange juice or water did not work has show
induce any change in any of the indexes measured. Dia
in the circul
(MNCs) ofRu
2. the
CONCLUSIONS — Although both glucose and cream induce NF-B binding and an in- increased whe
crease in the expression of SOCS3, TNF-␣, and IL-1 in MNCs, only cream caused an increase normal subje
Wh
in LPS concentration and TLR-4 expression. Equicaloric amounts of orange juice or water did not work demonstsul
induce a change in any of these indexes. These changes are relevant to the pathogenesis of sion in MNCs
atherosclerosis and insulin resistance. deg
Figure 3—Change in NFB binding activity in MNC (A) and plasma endotoxin concentrations tyrosine phosp
Diabetes Care juice (OJ, ‚),
Ch
receptor and d
(B) in normal subjects after a 300-calorie drink of cream (E), glucose (Œ), orange 33:991–997, 2010
3. Sen
insulin resistan
and ؉, P Ͻ 0.05 with a great interest because the content of LPS
or water (F). Data are means Ϯ SEM. *ur recent work has shown thatRMANOVA comparing changes in sessment of in
TA
IR]), consiste
relation to baseline after cream and glucose challenges; # andin $, P meals 0.05 significantly differ-
high-fat high-cholesterol (HFHC) these Ͻ is not with two-way](https://image.slidesharecdn.com/dietaeprevencaocvdversaoslideshare-130327150722-phpapp02/85/Dieta-e-prevencao-cvd-versao-slideshare-32-320.jpg)
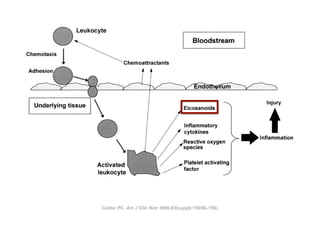
![Macronutrients, oxidative stress, and inflammation
Differential
Effects of Cream, Gluco
Orange Juice on Inflammation, Endcytok
and the Expression of Toll-Like Rec
know
and Suppressor of Cytokine Signal
anim
RUPALI DEOPURKAR, PHD PRIYA MOHANTY, MD
but
vital to the pro
HUSAM GHANIM, PHD
JAY FRIEDMAN, PHD
PRABHAKAR VISWANATHAN, PHD
AJAY CHAUDHURI, MD
creas
ins and immu
commensal a
SANAA ABUAYSHEH, BSC
CHANG LING SIA, BSC
PARESH DANDONA, MD, PHD and
bacteria.
In this con
creas
which macron
Nata SOC
the induction
OBJECTIVE — We have recently shown that a high-fat high-carbohydrate (HFHC) meal flammation, on
induces an increase in plasma concentrations of endotoxin (lipopolysaccharide [LPS]) and the
expression of Toll-like receptor-4 (TLR-4) and suppresser of cytokine signaling-3 (SOCS3) in
of in
crease in LPS
Glucose expression of T
mononuclear cells (MNCs) in addition to oxidative stress and cellular inflammation. Saturated
fat and carbohydrates, components of the HFHC meal, known to induce oxidative stress and
juice
tokine signalin
inflammation, also induce an increase in LPS, TLR-4, and SOCS3. stres
To elucidate th
fect of glucose,
RESEARCH DESIGN AND METHODS — Fasting normal subjects were given 300- Sumo de an in
hydrate, crea
orange juice,
calorie drinks of either glucose, saturated fat as cream, orange juice, or only water to ingest. Blood
samples were obtained at 0, 1, 3, and 5 h for analysis.
Laranja food product,
ther oxidative
RESULTS — Indexes of inflammation including nuclear factor-B (NF-B) binding, and the SOCS3 is
expression of SOCS3, tumor necrosis factor-␣ (TNF-␣), and interleukin (IL)-1 in MNCs, Ackn
shown to inter
increased significantly after glucose and cream intake, but TLR-4 expression and plasma LPS signal transdu
concentrations increased only after cream intake. The intake of orange juice or water did not porte
work has show
induce any change in any of the indexes measured. Flori
in the circul
(MNCs) of the
CONCLUSIONS — Although both glucose and cream induce NF-B binding and an in- supp
increased whe
crease in the expression of SOCS3, TNF-␣, and IL-1 in MNCs, only cream caused an increase
in LPS concentration and TLR-4 expression. Equicaloric amounts of orange juice or water did not (R01
normal subje
work demonst
induce a change in any of these indexes. These changes are relevant to the pathogenesis of
atherosclerosis and insulin resistance.
the A
sion in MNCs
tyrosine phosp
The
receptor and d
Diabetes Care 33:991–997, 2010
and w
insulin resistan
sessment of in
ur recent work has shown that a great interest because the content of LPS preta
IR]), consiste
high-fat high-cholesterol (HFHC) in these meals is not significantly differ-](https://image.slidesharecdn.com/dietaeprevencaocvdversaoslideshare-130327150722-phpapp02/85/Dieta-e-prevencao-cvd-versao-slideshare-35-320.jpg)
![dex diet than in the high–cereal fiber did not alter Mitchell, BASc, RD the as- been associa
Sandy the significance of
Results
n Participants With Type 2 Diabetessociation of the change in glycemic in- of diabetes
diet at week 24. Viscous fibers or diets Completing Either a High–Cereal Fibe
Azadeh Emam, MSc units (95%
Effect of a Low–Glycemic Index A. Augustin, MSc
Livia S. compared
low–glyce
Tina L. 2 Diabetes Completing Either a High–Cereal Fib
Figure 3.High–Cereal Fiber Diet on Type 2 Diabetes Parker, BASc, RD
or a Mean Study Measurements in Participants With Type A. Leiter, MD
Index Diet Lawrence
protein ch
dL) comp
A Randomizeddiet (n = 75)
High–cereal fiber Trial
T
Low–glycemic index diet (n = 80) (95% CI,
HE
High–cereal fiber diet (n = 75) NEED FOR IMPLEMENTA -
Low–glycemic index diet (n = 80) dietary gly
David J. A. Jenkins, MD Context Clinical trials using antihyperglycemic medications to improve glycemicstrate-
tion of effective dietary con- PϽ.001)
Cyril W. C. Kendall, PhD trol have not demonstrated the anticipated cardiovascular benefits. Low–glycemic in-
P=.009).
Gail McKeown-Eyssen, PhD weight dex diets may improve both glycemic control andin HbA1c
Body
HbA gies cardiovascular risk factors for pa-
diabetes prevention and
90
Robert G. Josse, MB, BS
1c
tients with type 2 diabetes but debate over their effectiveness continues due to trial
7.30 management has been empha- Conclus
146
limitations.
7.30
Jay Silverberg, MD
88 Objective To test the effectssized by the success glycemic control and
7.10 of low–glycemic index diets on of diet and life-
146 glycemic
138
cardiovascular risk factors in patients with type 2 diabetes. cereal fib
6.90 style changes in preventing diabetes in
Gillian L. Booth, MD
86
7.10
mg/dL
Design, Setting, and Participants A randomized, parallel study design at a Ca-
nadian university hospital research center of 210 patients. There is also 138
Edward Vidgen, BSc 130
Trial Reg
kg
1
high-risk participants with type 2 diabetes treatedcon-
%
84
Andrea R. Josse, MSc 6.70
with antihyperglycemic medications who were recruited by antihyperglycemic
cern that use of newspaper advertisement JAMA. 2008
6.90 122
mg/dL
Tri H. Nguyen, MSc
82 6.50
and randomly assigned to receive 1 of 2 diet treatments each for 6 months between
September 16, 2004, and Maymedications to improve glycemic con-
22, P .001 P = .0
P = .052 2007.
130
%
Sorcha Corrigan, BSc
80 6.30 114
0 6.70
Monica S. Banach, BSc 8
4 12 16 20 24 trol in 4type 8 diabetesadvice.20 always
Intervention High–cereal fiber0 low–glycemic index12
or 2 may not 24
dietary16 control
0
Sophie Ares, MA, RD, CDETime, wk significantly improve cardiovascular
Main Outcome Measures Absolute change in glycated hemoglobin A1c (HbA1c), with
Time, wk
fasting blood glucose and cardiovascular disease2-7 factors as secondary measures.
risk
density
outcomes. 122 (HDL-C
6.50
Sandy Mitchell, BASc, RD
Results In the intention-to-treat analysis, HbA1c decreased by −0.18% absolute HbA1c
Azadeh Emam, MSc
P .001 One dietary strategy aimed at im-
units (95% confidence interval [CI], −0.29% to −0.07%) in the high–cereal fiber diet
compared with −0.50% absolute HbA1c units (95% CI, −0.61% to −0.39%) in the
ide, plasm
P = .0
Livia S. A. Augustin, MSc HDL-C proving both diabetes control and114Triglycerides
car- and high
46.0 6.30
Tina L. Parker, BASc, RD
low–glycemic index diet (P Ͻ .001). There was also an increase of high-density lipo-
140 4.5
24 Lawrence A. Leiter, MD
0 4 8 12 16 20 24
diovascular risk factors is the use of
protein cholesterol in the low–glycemic index diet by 1.7 mg/dL (95% CI, 0.8-2.6 mg/
dL) compared with a decrease of high-density lipoprotein cholesterol by −0.2 mg/dL 0 (CR
tein
8-10
Time, wk low–glycemic index diets. These diets duce dia
44.0 130 4.3
T
(95% CI, −0.9 to 0.5 mg/dL) in the high–cereal fiber diet (P = .005). The reduction in
HE NEED FOR IMPLEMENTA - dietary glycemic index related positively to the reduction in HbA1c concentration (r=0.35,
have been reported to benefit the cardiova
mg/dL
mg/dL
Ratio
42.0 tion of effective dietary strate- PϽ.001) and negatively to120increase in high-density lipoprotein cholesterol (r=−0.19,
the 4.1
gies in diabetes prevention and P = .009).
40.0 management has been empha- Conclusion In patients110 2742 2 diabetes, 6-month treatment with a300, No.
with type JAMA, December 17, 2008—Vol low– 23 (Reprinted)
3.9
sized by the success of dietPand life-
= .01 glycemic index diet resulted in moderately lower HbA1c levels compared with a high–
P = .90
style changes in preventing diabetes in
38.0 cereal fiber diet. 100 3.7](https://image.slidesharecdn.com/dietaeprevencaocvdversaoslideshare-130327150722-phpapp02/85/Dieta-e-prevencao-cvd-versao-slideshare-46-320.jpg)
![dex diet than in the high–cereal fiber did notSandy the significance of the as-
alter Mitchell, BASc, RD been associa
Results
diet at week 24. Viscous fibers or diets
Triglycerides Azadeh Emam, MSc
sociation of the change in glycemic in-
Total cholesterol : HDL-C of diabetes
units (95%
Effect of a Low–Glycemic Index
140 4.5 compared
Livia S. A. Augustin, MSc
130 4.3
low–glyce
Tina L.2Parker, BASc, RD Either a High–Cereal Fib
or a High–Cereal Fiber Diet on Type 2 Diabetes
Figure 3. Mean Study Measurements in Participants With Type Diabetes Completing protein ch
mg/dL
Ratio
Index Diet
120 Lawrence A. Leiter, MD
4.1 dL) comp
A Randomized Trial
T
(95% CI,
110 3.9 dietary gly
High–cereal fiber diet (n = HE NEED FOR IMPLEMENTA -
75) Low–glycemic index diet (n = 80)
P = .90
David J. A. Jenkins, MD P = .12
100
Context Clinical trials using antihyperglycemic medications to improve glycemicstrate-
3.7 tion of effective dietary con- PϽ.001)
Cyril W. C. Kendall, PhD trol have not demonstrated the anticipated cardiovascular benefits. Low–glycemic in-
0 24 0 4 8 12 16 20 24 0 4 8 12 16 20 24 P=.009).
Gail McKeown-Eyssen,Body weight wk dex diets may improve both glycemic control andinHbA1c
PhD Time, gies cardiovascular risk factors for pa-
diabetes prevention and
Time, wk
tients with type 2 diabetes but debate over their effectiveness continues due to trial
90
Robert G. Josse, MB, BS limitations.
7.30 management has been empha- 146 Conclus
Jay Silverberg, MD
88 Objective To test the 7.10 sized by the success glycemic control and
effects of low–glycemic index diets on of diet and life-
glycemic
138
Gillian L. Booth, MD
86 130
Systolic BP style changes in preventing diabetes in cereal fib
cardiovascular risk factors in patients with type 2 diabetes.
6.90
Diastolic BP
mg/dL
Edward Vidgen, BSc 76
Design, Setting, and Participants A randomized, parallel study design at a Ca-
high-risk patients.1 There is also con- 130 Reg Trial
kg
%
84 128 nadian university hospital6.70
research center of 210 participants with type 2 diabetes treated
Andrea R. Josse, MSc with antihyperglycemic medications who were recruited by antihyperglycemic
cern that use of newspaper advertisement
74 JAMA. 2008
122
Tri H.126
82 Nguyen, MSc and randomly assigned to receive 1 of 2 diet treatments each for 6 months between
6.50
September 16, 2004, and Maymedications to improve glycemic con-
mm Hg
mm Hg
22, 2007.
P .001 P =.
124P = .052
Sorcha Corrigan, BSc 72
80 Intervention High–cereal trol in type 2 diabetes may
6.30fiber or low–glycemic index dietary advice. not always 114 control
Monica S. Banach, BSc
0
122 4 8 12 16 20 24 0 4 8 12 16 20 24 0
Sophie Ares, MA, RD, CDE Time, wk significantly Time, wksecondary measures.
70 improve cardiovascular density
Main Outcome Measures Absolute change in glycated hemoglobin A1c (HbA1c), with
120 fasting blood glucose and cardiovascular disease2-7 factors as
risk
Sandy Mitchell, = .39
P BASc, RD P = .43
outcomes.1c decreased by −0.18% absolute HbA1c (HDL-C
118 Results In the intention-to-treat 68 analysis, HbA
0 24 Azadeh Emam, MSc4
0 8 12 16 20 24 One dietary strategy aimed 20 im- ide, plasm
units (95% confidence interval [CI], −0.29% to4
0 −0.07%) in the12
8 16 at
high–cereal fiber diet 24
Livia S. A. Augustin, MSc HDL-C compared with −0.50% absolute HbA1c units (95% CI, −0.61% to −0.39%) in the
Time, wk Triglycerides wk
Time,
low–glycemic index diet (P Ͻ .001). There was also diabetesof high-density lipo-
proving both an increase control and car- and high
46.0 L. Parker, BASc, RD
Tina protein cholesterol in the 140 diovascularby 1.7 mg/dL (95% CI, 0.8-2.6use of
low–glycemic index diet risk factors is the mg/ 4.5 (CR
tein
DL-C, high-density lipoprotein cholesterol; LDL-C, low-density
Lawrence A. Leiter, MD dL) compared with lipoprotein high-density lipoprotein cholesterol by −0.2 mg/dL indi-
a decrease of cholesterol; BP, blood pressure. Error bars
8-10
(95% CI, −0.9 to 0.5 mg/dL) in the high–cereal fiber diet as change reduction diets
130 low–glycemic index diets. These in duce dia
T
ach panel indicates the comparison between high–cereal fiber diet vs a low–glycemic index diet (P = .005). Thefrom week 0 to 4.3
44.0
HE NEED FOR IMPLEMENTA - dietary glycemic index related positively to the reduction in HbA1c concentration (r=0.35,
n-to-treat analysis using an analysis of covariance model. negatively to the increase in been reportedcholesterol (r=−0.19,
have high-density lipoprotein to benefit the cardiova
mg/dL
mg/dL
PϽ.001) and
Ratio
42.0
tion of effective dietary strate- 120 4.1
gies in diabetes prevention and P = .009).
2742 JAMA, December 17, 2008—Vol low–
management has been empha- Conclusion In patients with type 2 diabetes, 6-month treatment with a300, No. 23 (Reprinted)
40.0
n. All rights reserved. 110in moderately lower HbA1c levels comparedNo. 23 2751 3.9
sized by the success of diet and life- glycemic(Reprinted) JAMA, December 17, 2008—Vol 300, with a high–
index diet resulted
P = .01
style changes in preventing diabetes in cereal fiber diet. P = .90](https://image.slidesharecdn.com/dietaeprevencaocvdversaoslideshare-130327150722-phpapp02/85/Dieta-e-prevencao-cvd-versao-slideshare-47-320.jpg)
![3
Clinical Nutrition and Metabolism, Department of Public Health and Caring Sciences, Uppsala University, 751 85 Uppsala, Sw
and 4Department of Food Science,Foods Do Not Affect Insulin (SLU), 750 07 Uppsala, Sweden
Whole-Grain the Swedish University of Agriculture Sciences
Sensitivity or Markers of Lipid Peroxidation
and Inflammation in Healthy, Moderately
1,2
Abstract Overweight Subjects
TABLE 5 BMI, blood pressure, and bloodKarlstrom,3 Afaf of all participants beforeSamar Basu,3 6 wk consuming
Agneta Andersson,3* Siv Tengblad,3 Brita
chemistry Kamal-Eldin,4 Rikard Landberg,4 and after
¨
whole-grain or refined-grain diets1
High intakesPer A
of whole grain foods
˚ man,4 and Bengt Vessby3 are inversely related to the incidence of coronary heart diseases and type 2 diabete
the mechanisms remain unclear. Our studyHealth and Caringevaluate the effectsUppsala, diet rich in whole grains compared with
Clinical Nutrition and Metabolism, Department of Public aimed to Sciences, Uppsala University, 751 85 of a Sweden
3
Whole-grain period Refined-grain period
and 4Department of Food Science, the Swedish University of Agriculture Sciences (SLU), 750 07 Uppsala, Sweden
containing the same amount of refined grains on insulin sensitivity and markers of lipid peroxidation and inflammatio
2
Before After Before After P-value treatment effect
randomized crossover study, 22 women and 8 men (BMI 28 6 2) were given either whole-grain or refined-grain pro
Abstract
n 30 30 30 30 Sem
diferenças
entre
os
grupos
(3 bread slices, intakes of whole grain foods are inversely related to the incidence of coronaryportion pasta) 2to include in their habitual daily diet for two
High
2 crisp bread slices, 1 portion muesli, and 1 heart diseases and type diabetes, but
Downloaded from jn.nutrition.org by guest on February 9, 2011
BMI, kg/m2 28.5 6 2.4 28.8 6 2.5a
the mechanisms remain unclear. Our study aimed to evaluate the effects of a6 2.1 in whole grains compared with a diet
28.4 diet rich 28.6 6 2.1 0.046
Fasting blood glucose, mmol/Linsulin sensitivity was determined5.2 6 of lipid peroxidationhyperinsulinemic 0.28
periods. Peripheralthe same amount of6 0.8 grains on 5.3 6sensitivity and markers 0.9
containing 5.2 refined insulin 0.8 by euglycemic 6 0.8 5.2 and inflammation. In a clamp tests. 8-Iso-prostagland
randomized crossover study, 22 women and 8 men (BMI 28 6 2) were given either whole-grain or refined-grain products
Fasting insulin, pmol/L breadF2-isoprostane,22.9 measured in the urine astheirmarker25.7lipid peroxidation, and highly sensitive C-re
(8-iso PGF2a), an slices, 2 crisp bread slices, was muesli, and 24.3 pasta) to include in a habitual6 of for two 6-wk
(3
56.2 6 1 portion 57.6 6 1 portion 60.4 6 30.6 57.6 daily diet 0.47
3
Insulin sensitivity, Mperiods. Peripheral insulin sensitivity was determined 6 euglycemic hyperinsulinemic clamp tests. 6 2.0
5.9 6 2.1 5.5 by 1.7 5.7 6 1.9 6.0 8-Iso-prostaglandin F2a 0.24
protein and IL-6PGF ), an Fanalyzedwas measured in the urine as a marker ofof inflammation. sensitive C-reactiveinsulin sensitivity [mg glucose Á kg
were -isoprostane, in plasma as markers lipid peroxidation, and highly Peripheral
M/I (8-iso 2a 2 6.8 6 3.0 6.5 6 2.7 6.4 6 2.9 6.9 6 3.2 0.79
21 21protein and IL-6 were analyzed in plasma as markers of inflammation. Peripheral insulin sensitivity [mg glucose Á kg body
Total cholesterol, mmol/L unit plasma insulin (mU/L) 3 100] did not improve when0.7
wt Á min per 21 5.5 6 0.7 5.5 6 0.7 5.5 6 0.8 5.5 6 subjects consumed whole-grain products (6.8
0.76
wt21 Á min per unit plasma insulin (mU/L) 3 100] did not improve when subjects consumed whole-grain products (6.8 6 3.0
HDL cholesterol, mmol/L6.5 6 2.7 2.7 after 66 wk) or refined 0.32.9 and 6.91.23.2, respectively) and 6 were no3.2, respectively) and there were no differ
at baseline and at baseline and 6.5 6 after 6 0.3
1.3 wk) or refined products6 products (6.4 6 2.9 and there 0.3 differences
1.2 (6.4 6 6 6 0.2 1.2 6.9 6 0.15
LDL cholesterol, mmol/L 3.7 6 0.8 3.7 6 0.7 3.7 6 0.8 3.6 6 0.7
between the 2 periods. Whole-grain consumption also did not affect 8-iso-PGF2a in urine, IL-6 and C-reactive protein in 0.40
between the 2 periods. Whole-grain consumption also didofnot affect 8-iso-PGF2a in urine, IL-6 and C-reactive prot c
plasma, blood pressure, or serum lipid concentrations. In conclusion, substitution whole grains (mainly based on milled
TG cholesterol, mmol/L 1.4 6 0.8 1.5 6 0.8 1.3 6 0.6 1.6 6 1.0 0.19
wheat) for refined-grain products in the habitual daily diet of healthy moderately overweight adults for 6-wk did not affect
Free fatty acid,blood pressure,markers of6 0.19
plasma, mmol/L sensitivity or or0.56 lipid peroxidation and 6 0.18
insulin
serum lipid concentrations. In137: 1401–1407, 2007.substitution of whole grains (mainly based on
0.61 inflammation. J. Nutr. conclusion, 0.18
0.63 6 0.17 0.62 6 0.99
Systolic bloodfor refined-grain products in the 129 6 15 daily diet 16 healthy 6 15
wheat) pressure, mm Hg 130 6 17 habitual 130 6 of 130 moderately overweight adults for 6-wk did not
0.35*
Diastolic blood pressure, mm Hg 81 6 9 81 6 8 80 6 10 81 6 9 0.60
insulin sensitivity or markers of lipid peroxidation and inflammation. J. Nutr. 137: 1401–1407, 2007.
8-iso-PGF2a, nmol/mmol creatinine
Introduction 0.43 6 0.14 0.43 6 0.14 0.42grain products in many 0.21
6 0.15 0.44 6 countries including the 0.48 the U.K.,
U.S.,
a-tocopherol, mmol/mmol lipid products are reported to have several positive effects and Sweden. The claims must, however, be set within the context
Whole-grain 4.68 6 0.72 4.78 6 0.61 4.38 6 1.07 4.64 6 0.61 0.08
on human health (1). An inverse, relatively strong correlation of other lifestyle factors such as exercise and healthy eating habits
g-tocopherol, mmol/mmol lipid intake of0.26 6grain foods 0.24 6 0.07 from in general (1). 0.26 6 0.10
between the whole 0.12 (2–6) and fiber 0.26 6 0.10 0.10
CRP, mg/L grains (7–10), based mainly6 1.62 and the incidence of coro-
2.03 on FFQ 2.38 6 2.29 2.86 6 2.96 2.34 6 1.57 0.55
Despite indications that whole grain foods may beneficially
nary heart disease, is consistently shown in epidemiological studies influence glucose and lipid metabolism, knowledge of how
Introduction
IL-6, ng/L of both men and women. In6 32.2 recent studies33.2 linked
14.8 addition, 15.2 6 have 15.9biological mechanisms contribute to the health effects of whole
6 32.4 15.8 6 30.9 0.79
PAI-1 activity, kU/L cereal fiber and whole-grain foods to a reduced risk of type 2 grain remain weak. Several bioactive components, such asin many countries in
24.7 6 15.8 26.9 6 20.3 24.8 6 19.9 22.1 6 19.5 grain products die- 0.26
diabetes (11–16) and of the metabolic syndrome (6,17). These tary fiber, vitamins, minerals, antioxidants, and other phyto-
1
Whole-grain products be most striking among overweightseveral positive effects mayand Sweden. lower the
relations seem to are reported to have subjects protectants in whole grain act synergistically to The claims must, howev
Data are means 6 SD.
P-values (treatment effect) for differences betweenutr.
whole-grainwhole- stress are both adjusted for changes in BMI. Differences within such as exerci
(11,18,19). The scientific evidence is considered 37:
1401–1407,
2007.
chronic diseases (20,21). Insulin resistance and oxidative
J.
N the 1 sufficient to permit risk of
2 on human health (1). An inverse, relatively strong correlation of other lifestyle factors
health claims regarding the cardio-protective effect of and refined-grain diet important factors in the pathogenesis of type 2
a b c
diabetes design, only in general (1).
groups when compared to baseline: P , 0.001; grain foods0.05. *Parallel groupand cardiovascular diseases (22–25) and may poten-
between the intake of whole P , 0.01; P , (2–6) and fiber from from 1st diet period (because carryover
effect was found). tially be affected by whole-grain intake. Induction of lipid per-](https://image.slidesharecdn.com/dietaeprevencaocvdversaoslideshare-130327150722-phpapp02/85/Dieta-e-prevencao-cvd-versao-slideshare-48-320.jpg)
![EPA
DHA
Calder PC. Biochimie. 2009 Feb 3. [Epub ahead of print]](https://image.slidesharecdn.com/dietaeprevencaocvdversaoslideshare-130327150722-phpapp02/85/Dieta-e-prevencao-cvd-versao-slideshare-68-320.jpg)