Detection of hydrogen sulfide above the clouds in Uranus’s atmosphere

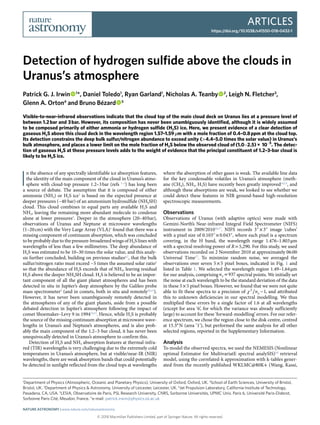
Visible-to-near-infrared observations indicate that the cloud top of the main cloud deck on Uranus lies at a pressure level of between 1.2 bar and 3 bar. However, its composition has never been unambiguously identified, although it is widely assumed to be composed primarily of either ammonia or hydrogen sulfide (H2S) ice. Here, we present evidence of a clear detection of gaseous H2S above this cloud deck in the wavelength region 1.57–1.59 μm with a mole fraction of 0.4–0.8 ppm at the cloud top. Its detection constrains the deep bulk sulfur/nitrogen abundance to exceed unity (>4.4–5.0 times the solar value) in Uranus’s bulk atmosphere, and places a lower limit on the mole fraction of H2S below the observed cloud of (1.0 2.5) × 10 5 − − . The detection of gaseous H2S at these pressure levels adds to the weight of evidence that the principal constituent of 1.2–3-bar cloud is likely to be H2S ice.

Recommended
Recommended
More Related Content
What's hot
What's hot (20)
Similar to Detection of hydrogen sulfide above the clouds in Uranus’s atmosphere
Similar to Detection of hydrogen sulfide above the clouds in Uranus’s atmosphere (20)
More from Sérgio Sacani
More from Sérgio Sacani (20)
Recently uploaded
Recently uploaded (20)
Detection of hydrogen sulfide above the clouds in Uranus’s atmosphere
- 1. Articles https://doi.org/10.1038/s41550-018-0432-1 © 2018 Macmillan Publishers Limited, part of Springer Nature. All rights reserved. 1 Department of Physics (Atmospheric, Oceanic and Planetary Physics), University of Oxford, Oxford, UK. 2 School of Earth Sciences, University of Bristol, Bristol, UK. 3 Department of Physics & Astronomy, University of Leicester, Leicester, UK. 4 Jet Propulsion Laboratory, California Institute of Technology, Pasadena, CA, USA. 5 LESIA, Observatoire de Paris, PSL Research University, CNRS, Sorbonne Universités, UPMC Univ. Paris 6, Université Paris-Diderot, Sorbonne Paris Cité, Meudon, France. *e-mail: patrick.irwin@physics.ox.ac.uk I n the absence of any spectrally identifiable ice absorption features, the identity of the main component of the cloud in Uranus’s atmo- sphere with cloud-top pressure 1.2–3 bar (refs 1–3 ) has long been a source of debate. The assumption that it is composed of either ammonia (NH3) or H2S ice3 is based on the expected presence at deeper pressures (~40 bar) of an ammonium hydrosulfide (NH4SH) cloud. This cloud combines in equal parts any available H2S and NH3, leaving the remaining more abundant molecule to condense alone at lower pressures4 . Deeper in the atmosphere (20–40 bar), observations of Uranus and Neptune at microwave wavelengths (1–20 cm) with the Very Large Array (VLA)5 found that there was a missing component of continuum absorption, which was concluded to be probably due to the pressure-broadened wings of H2S lines with wavelengths of less than a few millimetres. The deep abundance of H2S was estimated to be 10–30 times the solar value, and this analy- sis further concluded, building on previous studies6,7 , that the bulk sulfur/nitrogen ratio must exceed ~5 times the assumed solar ratio8 so that the abundance of H2S exceeds that of NH3, leaving residual H2S above the deeper NH4SH cloud. H2S is believed to be an impor- tant component of all the giant planet atmospheres and has been detected in situ in Jupiter’s deep atmosphere by the Galileo probe mass spectrometer9 (and in comets, both in situ and remotely10,11 ). However, it has never been unambiguously remotely detected in the atmospheres of any of the giant planets, aside from a possible debated detection in Jupiter’s atmosphere following the impact of comet Shoemaker–Levy 9 in 199412,13 . Hence, while H2S is probably the source of the missing continuum absorption at microwave wave- lengths in Uranus’s and Neptune’s atmospheres, and is also prob- ably the main component of the 1.2–3-bar cloud, it has never been unequivocally detected in Uranus’s atmosphere to confirm this. Detection of H2S and NH3 absorption features at thermal-infra- red (TIR) wavelengths is very challenging due to the extremely cold temperatures in Uranus’s atmosphere, but at visible/near-IR (NIR) wavelengths, there are weak absorption bands that could potentially be detected in sunlight reflected from the cloud tops at wavelengths where the absorption of other gases is weak. The available line data for the key condensable volatiles in Uranus’s atmosphere (meth- ane (CH4), NH3, H2S) have recently been greatly improved14,15 , and although these absorptions are weak, we looked to see whether we could detect these features in NIR ground-based high-resolution spectroscopic measurements. Observations Observations of Uranus (with adaptive optics) were made with Gemini-North’s Near-infrared Integral Field Spectrometer (NIFS) instrument in 2009/201016,17 . NIFS records 3″ × 3″image ‘cubes’ with a pixel size of 0.103″ × 0.043″, where each pixel is a spectrum covering, in the H band, the wavelength range 1.476–1.803 μm with a spectral resolving power of R = 5,290. For this study, we used observations recorded on 2 November 2010 at approximately 06:00 Universal Time17 . To minimize random noise, we averaged the observations over seven 5 × 5 pixel boxes, indicated in Fig. 1 and listed in Table 1. We selected the wavelength region 1.49–1.64 μm for our analysis, comprising =n 937y spectral points. We initially set the noise at each wavelength to be the standard deviation of the data in these 5 × 5 pixel boxes. However, we found that we were not quite able to fit these spectra to a precision of χ ∕ ~n 1y 2 , and attributed this to unknown deficiencies in our spectral modelling. We thus multiplied these errors by a single factor of 1.6 at all wavelengths (except for area ‘6’, for which the variance was already sufficiently large) to account for these ‘forward-modelling’ errors. For our refer- ence spectrum, we chose the region close to the disk centre, centred at 15.3° N (area ‘1’), but performed the same analysis for all other selected regions, reported in the Supplementary Information. Analysis To model the observed spectra, we used the NEMESIS (Nonlinear optimal Estimator for MultivariatE spectral analySIS)18 retrieval model, using the correlated-k approximation with k-tables gener- ated from the recently published WKLMC@80K+(Wang, Kassi, Detection of hydrogen sulfide above the clouds in Uranus’s atmosphere Patrick G. J. Irwin 1 *, Daniel Toledo1 , Ryan Garland1 , Nicholas A. Teanby 2 , Leigh N. Fletcher3 , Glenn A. Orton4 and Bruno Bézard 5 Visible-to-near-infrared observations indicate that the cloud top of the main cloud deck on Uranus lies at a pressure level of between 1.2 bar and 3 bar. However, its composition has never been unambiguously identified, although it is widely assumed to be composed primarily of either ammonia or hydrogen sulfide (H2S) ice. Here, we present evidence of a clear detection of gaseous H2S above this cloud deck in the wavelength region 1.57–1.59 μm with a mole fraction of 0.4–0.8 ppm at the cloud top. Its detection constrains the deep bulk sulfur/nitrogen abundance to exceed unity (>4.4–5.0 times the solar value) in Uranus’s bulk atmosphere, and places a lower limit on the mole fraction of H2S below the observed cloud of (1.0 2.5) × 10 5 − − . The detec- tion of gaseous H2S at these pressure levels adds to the weight of evidence that the principal constituent of 1.2–3-bar cloud is likely to be H2S ice. Nature Astronomy | www.nature.com/natureastronomy
- 2. © 2018 Macmillan Publishers Limited, part of Springer Nature. All rights reserved. Articles Nature Astronomy Leshchishina, Mondelain, Campargue line list)14 line data for CH4 and updated line data for H2S and NH3 from HITRAN2012 (HIgh- resolution TRANsmission molecular absorption database)15 . The mean absorption strengths of CH4, NH3 and H2S across the H-band wavelength range contained in these data (calculated at 100 K and 1 atm) are shown in Fig. 1. Our a priori vertical atmospheric pro- file was based on the ‘F1’ temperature profile, determined from Hubble Space Telescope/Space Telescope Imaging Spectrograph (HST/STIS) and Voyager 2 observations3 . This profile has a deep CH4 mole fraction of 4% (ref. 19 ), and has a varying relative humidity with height above the condensation level. The helium/ hydrogen (He/H2) ratio was set to 0.131, and the profile includes 0.04% mole fraction of neon3 . To this profile, we added NH3 and H2S, assuming arbitrary deep mole fractions (above the putative NH4SH cloud) of 0.1% for both, and limited their abundance to not exceed the saturated vapour pressure20 in the troposphere as the temperature falls with height, adjusting the abundance of H2 and He (keeping He/H2 = 0.131) to ensure the mole fractions summed to unity at each pressure level. Figure 2 shows the mod- elled abundance profiles of the three condensable species falling with height. We can see that the saturated vapour pressure of H2S at the pressure of the main clouds of Uranus (1.2–3 bar) is approximately 2,000 times higher than that of NH3. Hence, even though the peak NH3 absorption strength in this spectral region 0.06 0.05 0.04 Reflectivity Error 0.03 0.02 0.01 0.00 102 10–2 10–4 10–6 10–8 1.50 1.52 1.54 1.56 1.58 1.60 1.62 1.64 Absorption(10–20 cm2 permolecule) 100 1.50 1.52 1.54 1.56 Wavelength (μm) 2 a c b d 2 6 5 4 1 7 3 2 1 1 0 0 –1 –1 North–South(arcsec) East–West (arcsec) –2 –2 2 2 6 5 4 1 7 3 2 1 1 0 0 –1 –1 North–South(arcsec) East–West (arcsec) –2 –2 Wavelength (μm) CH4 NH3 H2S 1.58 1.60 1.62 1.64 Fig. 1 | The appearance and spectrum of Uranus at the near-infrared wavelengths observed by Gemini/NIFS and associated absorption spectra of CH4, NH3 and H2S. a, The appearance of Uranus at 1.55 μm (low CH4 absorption, showing reflection from cloud/haze at all vertical levels), observed with Gemini/NIFS on 2 November 2010 at approximately 06:00 Universal Time, showing the position of the seven 5 × 5 pixel test areas picked for retrieval analysis. b, The appearance of Uranus at 1.62 μm (high CH4 absorption, showing reflection from upper atmospheric haze only). c, Reference spectrum of Uranus16 analysed in this study, averaged over area ‘1’ just north of the equator, near the disk centre, with a mean latitude of 15.3° N, and error estimates (standard deviation) shown in grey. d, Mean strength listed in the k-distribution tables used in this study across the Gemini/NIFS spectral range. These absorption tables were generated from the WKLMC@80K+ (ref. 14 ) database for CH4, and from HITRAN2012 (ref. 15 ) for H2S and NH3. These mean absorption coefficients have been computed at a temperature of 100 K and pressure of 1 atm, similar to conditions found at the tops of Uranus’s main visible clouds. Note that for NH3, the line data in HITRAN2012 terminate at 1.587 μm, roughly halfway through the H2S absorption band. Table 1 | Retrieval results at all areas considered on Uranus’s disk Area no. Latitude p1 fH S2 n2 χ ∕ ny 2 χ ∕ Δχ2 xH S2 AH S2 RH 1a 15.3° N 1.99 ±113 12 1.30 1.23 367.3 0.47 2.7 2.1 2 13.8° N 2.00 ±134 19 1.04 0.99 140.7 0.58 3.3 2.3 3 15.3° S 2.10 ±123 16 1.23 1.17 225.1 0.80 4.9 2.5 4 32.5° N 1.88 ±303 45 1.31 1.24 218.7 0.82 4.4 2.6 5 44.7° N 1.66 ±474 84 1.33 1.26 172.9 0.43 2.1 2.8 6b 62.0° N 1.56 ±252 211 1.31 1.24 1.8 0.13 0.6 3.9 7 4.9° N 1.98 ±96 9 1.57 1.48 333.8 0.38 2.2 2.2 1c 15.3° N 2.28 ±16 2 1.36 1.29 292.1 0.43 2.9 2.1 p1 is the pressure (bar) where the cloud opacity to space is unity; fH2S is the retrieved H2S relative humidity (%); χ ∕n2 is the reduced chi-squared statistic of the fit when H2S is included, where = − =n n n 889y x ; χ ∕ny 2 is the chi-squared statistic of the fit when H2S is included, where =n 937y ; Δχ2 is how much the χ2 of the fit reduces when H2S absorption is included—values >9 can be considered significant; xH2S is the retrieved mole fraction of H2S (ppm) at p1; AH2S is the retrieved column amount of H2S (1019 molecules per cm2 ) above p1; RH is a haze index—the ratio of the average radiance from 1.63–1.64 μm divided by the average radiance from 1.57–1.58 μm, expressed as a percentage. a Area ‘1’ is the main area studied. b For polar area ‘6’, where the radiance is lower, the measurement errors did not need to be multiplied by 1.6 to ensure a good χ ∕n2 . c Same area as reference, but analysed using the Spitzer temperature profile rather than F1. Nature Astronomy | www.nature.com/natureastronomy
- 3. © 2018 Macmillan Publishers Limited, part of Springer Nature. All rights reserved. ArticlesNature Astronomy is, from Fig. 1, ~100 times stronger than that of H2S, we expect the absorption lines of H2S to be far more visible due to the higher likely abundance of H2S and the lines of H2S having maximum strength at wavelengths of minimum CH4 opacity (Fig. 1). The very low saturated vapour pressure of NH3 at the 1.2–3 bar level in Uranus’s atmosphere makes it likely that NH3 would not have enough abundance to condense into a cloud with sufficient opac- ity at this level as has previously been noted3 . We fitted the spectrum using a multiple-scattering model, and modelled cloud opacity with a vertically continuous profile of par- ticles (at 39 levels) with a gamma size distribution of mean radius 1.0 μm and variance 0.05. This size distribution is typical of that assumed in previous analyses2,21 , but is an assumption and is not constrained by, for example, a microphysical model. In addition, the assumption that the particles have the same size distribution at all altitudes is an oversimplification since we would expect that in real clouds the particles would be smaller at higher altitudes. However, the primary objective of this study was to search for the spectral signature of H2S gas, rather than to fit a sophisticated cloud model, and we thus chose a model that would be simple and easy to fit. Note that our simple cloud model is used to model not only the effects of the main 1.2–3-bar cloud, but also any CH4 cloud opacity and any tropospheric/stratospheric haze opacity that may be present. In addition to fitting the cloud opacity at each level in the atmosphere, we also fitted the imaginary refrac- tive index spectrum of the particles (assumed to be the same at all vertical levels) at nine wavelengths between 1.4 μm and 1.8 μm, reconstructing the real part of the refractive index spectrum using the Kramers–Kronig relation21 , assuming nreal = 1.4 at 1.6 μm. We constrained the imaginary refractive index spectrum to vary reasonably slowly with wavelength, to avoid degeneracy with the H2S signal we were trying to detect (see Methods). Self-consistent extinction cross-sections, single-scattering albedos and phase functions were then computed at all wavelengths using Mie theory, with the phase functions approximated with Henyey– Greenstein functions (see Methods). The total number of vari- able parameters in our retrieval (excluding the H2S scaling factor used later) was thus = + =n 39 9 48x , and thus the total number of degrees of freedom, = −n n ny x, was 889. Results Figure 3 shows our fit to the reference Uranus spectrum (area ‘1’ of Fig. 1 and Table 1) when H2S and NH3 absorption is neglected, using three different a priori values of the imaginary refractive index, ni, of 0.001, 0.01 and 0.1, respectively, at all wavelengths with an a priori error of ±50%. We can see that reasonably good fits are achieved for all three cases, but that better fits are achieved with higher a priori values, with similar results for ni = 0.01 and ni = 0.1 (χ ∕ ≈ .n 1 72 ). For the ni = 0.001 case, a poorer fit is achieved (χ ∕ ≈ .n 1 92 ) as the solution cannot move far enough away from the a priori to prop- erly fit the spectrum. As a result, the retrieved particles have a low imaginary refractive index and so are more scattering, necessitating the cloud profile opacity to reduce quickly at pressures greater than 2–3 bar to prevent measurable reflection from these levels. This is in stark contrast to the other two solutions, where ni is much higher ( ≈ .n 0 06i ), and where we find that the single-scattering albedo of the particles is ϖ= . − .0 7 0 8 and phase-function asymmetry is g ≈ 0.7 across the observed spectral range (Supplementary Fig. 1). These retrieved single-scattering albedo and phase-function asymmetry values agree very well with a limb-darkening analysis16 , which used these same Gemini/NIFS data smoothed to a lower resolution with a full-width at half-maximum of 0.004 μm and older lower-resolution CH4 absorption k-distribution data22 , and also with an analysis of Keck and HST images23 , which recommended ϖ= .0 75 and = .g 0 7. An important consequence of the low single-scattering albedo of the retrieved particles is that solar photons are quickly absorbed as they reach the cloud tops and so we do not see measurable reflec- tion from particles residing at pressures greater than 2–3 bar. This can be seen in the retrieved error bars for the cloud opacity profiles in Fig. 3 quickly relaxing back to their a priori value as the pressure increases and the profiles for the higher ni values tending smoothly back to their a priori opacity/bar values. As a result, although we can clearly detect the cloud-top pressure at these wavelengths, we cannot tell where the base is and thus cannot differentiate between a vertically thin cloud based at 2–3 bar and a cloud that extends verti- cally down to several bars with the same cloud-top pressure. We also note that when the particles are constrained to be more scat- tering, the peak of cloud opacity is at a lower pressure than for the case with more absorbing particles. This phenomenon may help to explain why HST/STIS retrievals3 , which assume the particles to be more scattering, find the cloud tops to be at lower pressures (1.2 bar) than retrievals near 1.5 μm (refs 1,2 ), which assume more absorbing particles and find cloud tops at 2–3 bar. Figure 4 compares our best fits with the observed reference spec- trum (area ‘1’ at 15.3° N) in the 1.56–1.60 μm region, including or excluding H2S absorption. When H2S absorption is not included, we find that there is a significant discrepancy between the measured and modelled spectra, giving χ ∕n2 = 1.71. This discrepancy is sub- stantially reduced when H2S absorption is included and NEMESIS allowed to scale the abundance of H2S, achieving a much closer fit with χ ∕n2 = 1.30. When H2S absorption is not included, there are several peaks in the difference spectrum (Fig. 4) that match per- fectly the effect of including or excluding this gas in the spectral calculation. We examined the correlation between the expected H2S signal and this difference spectrum between 1.57 μm and 1.60 μm, and found a Pearson correlation coefficient of 0.718 (indicating a strong correlation) and a Spearman’s rank correlation coefficient of 0.602, with a two-sided significance value of D = . × − 6 88 10 20 , which equates to a 9σ-level detection. We also tested the effect on the calculated spectrum of including or excluding 100% relative humidity of NH3, but found that this was completely undetectable due to extremely low abundances of NH3 at these temperatures. In case the NH3 abundance in Uranus’s atmosphere is in reality highly supersaturated, we also tested the effect on the calculated spectrum of supersaturating NH3 by a factor of 1,000, also shown in Fig. 4. However, we found that the absorption features of NH3 do not 0.1 1.0 Pressure(bar) 10.0 0.1 1.0 Pressure(bar) 10.0 50 10–10 CH4 NH3 H2S 10–8 10–6 Mole fraction 10–4 10–2100 150 Temperature (K) 200 Fig. 2 | Pressure variation of temperature and condensable abundances assumed in this study for Uranus. The temperature–pressure profile (left) is based on the 'F1' profile3 . For the condensable abundances (right), the vertical variation of the CH4 abundance is as described in the text. The abundances of NH3 and H2S have simply been limited by their saturation vapour pressures. Nature Astronomy | www.nature.com/natureastronomy
- 4. © 2018 Macmillan Publishers Limited, part of Springer Nature. All rights reserved. Articles Nature Astronomy coincide at all well with the difference spectrum, with correlation coefficients of only 0.271 (Pearson) and 0.256 (Spearman), respec- tively. We thus conclude that NH3 is not the source of the miss- ing absorption. The correlation between the spectral discrepancy of the fit, when H2S is neglected, and the differences between the modelled spectra when either H2S or NH3 absorption is added are shown in Supplementary Fig. 2. The retrieved relative humidity of the H2S profile needed to match the observed absorption features was ±113 12%. Since the mole fraction of H2S decreases rapidly with height, this scaling factor is strongly weighted by the abundance of H2S just above the cloud top, that is, at 1.99 bar in this case (Table 1), and found to be 0.47 ppm, but is consistent with the H2S profile having 100% relative humidity in this region. However, this conclusion depends on both the assumed temperature profile, which sets the saturated vapour pressure, and also the assumed CH4 profile, which affects the retrieved cloud-top pressure and thus the peak pressure level (and thus local temperature) of sensitivity to H2S. To test these effects, we repeated our retrievals using a vertical profile of tem- perature and abundance estimated from Spitzer (ref. 24 ), which has a lower CH4 abundance of 3.2%, compared with 4% for the F1 pro- file3 , but is slightly warmer at pressures greater than 1 bar, resulting in higher saturated vapour pressures of H2S. As might be expected, the lower CH4 abundance of this profile led to the retrieved cloud opacity peaking at slightly higher pressures to achieve the required column abundance of CH4 (Table 1), and the retrieved H2S rela- tive humidity at the deeper cloud tops in the warmer atmosphere was only ±16 2%. Since it is not clear which of these two profiles is more reliable (although the F1 profile was found to be inconsistent with Spitzer observations24 ), it can be seen that, although we clearly detect the presence of H2S at Uranus’s cloud tops, it is difficult to determine quantitatively its relative humidity. However, we can see from Table 1 that there is very good correspondence between the retrieved values of column abundance of H2S above the clouds for the two temperature profiles, and between the retrieved mole frac- tions of H2S at the cloud-top pressure level, of . ± . × − (4 7 0 5) 10 7 for the F1 profile and . ± . × − (4 3 0 5) 10 7 for the Spitzer profile, where we have propagated the relative-humidity retrieval errors. Table 1 and Supplementary Figs. 3–11 show our fits at the other test points on Uranus’s disk, indicated in Fig. 1. At all locations 0.06a d b c 0.01 0.10 1.00 10.00 0.05 0.04 Reflectivity 0.03 0.02 0.01 0.00 0.006 0.004 0.002 0.000 –0.002 –0.004 –0.006 1.0000 0.1000 0.0100 0.0010 0.0001 ReflectivitydifferenceImaginaryrefractiveindex 1.50 1.52 1.54 1.56 Wavelength (μm) 1.885 1.724 1.675 χ2 /(ny–nx) 1.58 1.60 1.62 1.64 Pressure(bar) 1.50 1.52 1.54 1.56 Wavelength (μm) 1.58 1.60 1.62 1.64 1.50 1.52 1.54 1.56 Wavelength (μm) 1.58 1.60 1.62 1.64 0.01 0.10 Opacity/bar 1.00 10.00 Fig. 3 | Fits to average Gemini/NIFS observation of Uranus, made on 2 November 2010 at 15.3° N, using three different assumptions for the a priori imaginary refractive index spectrum, and excluding H2S and NH3 absorption. The red lines show the results using = ±n 0.001 0.0005i , the black lines show the results using = ±n 0.01 0.005i , while the blue lines show the results using = ±n 0.1 0.05i . a, The fits to the measured spectra. b, The difference between the observed and modelled spectra. c, The fitted imaginary refractive index spectra of the cloud particles. d, The fitted cloud profiles (opacity/bar at 1.6 μm). In c,d, the a priori value and range is marked in light grey, while the error range (standard deviation) on the retrieved quantities is indicated in darker grey. The χ ∕n2 of the fits is also shown in a. Nature Astronomy | www.nature.com/natureastronomy
- 5. © 2018 Macmillan Publishers Limited, part of Springer Nature. All rights reserved. ArticlesNature Astronomy except in Uranus’s northern polar ‘cap’ feature, we found a clear improvement in our fit to the spectra when H2S absorption is included, indicating the presence of H2S at the cloud tops (Table 1), with well-defined column abundances above the cloud of − ×(2 5) 1019 molecules per cm2 and cloud-top mole fractions of 0.4–0.8 ppm. All but one of the chosen points were on the central meridian, to keep the zenith angle as low as possible to minimize the computation time of our multiple-scattering code, which uses more Fourier components in the azimuth decomposition direc- tion as the zenith angle increases, to maintain accuracy. However, point ‘2’ was chosen to be at roughly the same latitude as our ref- erence area, but off the central meridian and closer to the limb to check that our retrieval was robust against zenith angle changes, which was found to be the case. The absence of a clear H2S sig- nature near Uranus’s north pole seems to indicate lower H2S above the clouds in this region, in the same way that microwave observations found that the polar regions were depleted in micro- wave absorbers (H2S and NH3) at depth6 ; the abundance of CH4 above the clouds is also known to be reduced at these latitudes3,19 . Alternatively, it could also be that the H2S signal is masked by increased abundance of tropospheric haze, but Table 1, which lists a haze index, given by the observed radiance in a CH4-absorbing band divided by the radiance at continuum wavelengths, does not suggest that the polar region is particularly affected by overlying haze. However, to explore this further requires a detailed exami- nation of spectra in the polar regions, which is beyond the scope of this paper. Discussion If we could be sure that the main observed cloud deck was verti- cally thin and composed of H2S ice, then we could constrain the abundance of H2S below it by equating the cloud base to the con- densation level. However, the low retrieved single-scattering albedo of the cloud particles means that we cannot tell between whether we are seeing a vertically thin cloud based at 2–3 bar or just the top of a vertically extended cloud that extends to several bars. Instead, our detection of H2S can be used to give a lower limit on its abundance below the observed cloud. Assuming the main cloud is made of H2S ice, is vertically thin and is based at 3 bar, and that the STIS/Voyager 2 F1 temperature profile3 we have assumed is correct, the saturated mole fraction of H2S at the 3 bar level (where the temperature is 116.1 K) is estimated to be . × − 1 1 10 5 . Alternatively, using the Spitzer profile24 , the saturated vapour mole fraction at the 3 bar level (where the temperature is 119.5 K) is . × − 2 5 10 5 . Hence, we can conclude that the mole fraction of H2S at pressures >3 bar immediately below the clouds must be> . − . × − (1 0 2 5) 10 5 . We can compare this with the expected abundances of H2S and NH3 from microwave VLA stud- ies5–7 , which found the abundance of H2S to be 10–30 times the solar value, and the sulfur/nitrogen ratio to be greater than ~5 times the solar value, assuming solar abundances8 of H2S/H2 = 3.76 × 10⁻⁵ and NH3/H2 = 1.74 × 10⁻⁴ (giving nitrogen/sulfur = 4.6). Using these values, 10 × solar H2S and 2 × solar NH3 would give a residual mole fraction of H2S above a deeper NH4SH cloud of at least × − 3 10 5 , while for 30 × solar H2S and 6 × solar NH3, the expected residual H2S mole fraction increases to × − 9 10 5 . Both these values are 0.06 0.05 0.04 Observed + error Fit without H2S Fit without H2S – observed Fit with H2S – observed Error Calculated difference when 1 × H2S is added Calculated difference when 1,000 × NH3 is added Fit with H2S 0.03 0.02 0.01 0.00 0.010 0.005 0.000 –0.005 –0.010 1.56 1.57 1.58 1.59 1.60 Reflectivity Reflectivitydifference Wavelength (μm) 1.56 1.57 1.58 1.59 1.60 Wavelength (μm) Fig. 4 | Fits to the coadded Gemini/NIFS observation of Uranus in the wavelength range 1.56–1.6 μm. In the top plot, the observed reflectivity spectrum and estimated error (standard deviation) is shown in grey, the fitted spectrum when H2S absorption is not included is shown in red, while the fitted spectrum when H2S absorption is included is shown in black. The bottom plot shows the differences between these fits and the observed spectrum using the same colours (red when H2S absorption is not included and black when it is), with the error (standard deviation) range again shown in grey. The blue line in the bottom plot shows how the calculated spectrum for the fit when H2S absorption is not included (red line in the top plot) changes when H2S absorption is added (leaving all other fitted parameters unchanged), assuming a profile with 100% relative humidity. The cyan line shows how the calculated spectrum changes when NH3 absorption is added, leaving all other fitted parameters unchanged, assuming a profile with 1,000 times the a priori NH3 profile with 100% relative humidity. Nature Astronomy | www.nature.com/natureastronomy
- 6. © 2018 Macmillan Publishers Limited, part of Springer Nature. All rights reserved. Articles Nature Astronomy substantially greater than our estimated minimum residual abun- dance, but are consistent with it and may suggest that the base of the cloud lies at pressures greater than 3 bar. A more recent analysis of Spitzer Uranus observations24 suggests a residual H2S mole frac- tion of . × − 1 5 10 5 to reconcile the millimetre spectrum with the tem- perature profile derived from Spitzer, which is much closer to our estimate. Interpolating to the pressure levels in our assumed F1 tem- perature–pressure profile3 where the VLA and Spitzer estimates of residual H2S abundance are equal to the saturated vapour pressure abundances, we deduce that the base of the main cloud must lie at a pressure of 3.1–4.1 bar. Alternatively, if we assume the Spitzer tem- perature–pressure profile24 , we find a pressure range of 2.8–3.7 bar. The fact that we detect H2S at all at Uranus’s cloud tops confirms that the deep abundance of H2S must exceed that of NH3 and hence that the sulfer/nitrogen ratio > .4 6 times the solar value for the solar abundance ratios8 assumed by the VLA study5,6 . We note, however, that there are other, more recent estimates of the solar abundance ratios, for which the solar nitrogen/sulfur value varies from 4.4 (ref. 25 ) to 5.0 (ref. 26 ). Hence, to ensure that the deep abundance of H2S exceeds that of NH3, we conclude that the sulfur/nitrogen ratio in Uranus’s bulk atmosphere exceeds 4.4–5.0 times the solar value. The fact that the bulk sulfur/nitrogen ratio in Uranus's atmosphere seems to exceed unity is in stark contrast with the atmospheres of Jupiter and Saturn, for which the sulfur/nitrogen ratio is <1 (refs 5,7, ), leaving residual NH3 to condense at lower pressures instead of H2S; this difference points to a different formation history for Uranus compared with Jupiter and Saturn. The clear detection of gaseous H2S above Uranus’s clouds leads us to conclude that H2S ice prob- ably forms a substantial component of the main clouds at 1.2–3 bar. To our knowledge, the imaginary refractive index spectrum of H2S ice has not been measured, and hence we cannot directly verify whether our retrieved refractive index spectrum is consistent with H2S ice. However, very large imaginary refractive indices such as we retrieve are absent in the measured complex refractive index spec- tra of H2O, CH4 and NH3 ices. This suggests that, if Uranus’s main clouds are indeed formed primarily of H2S ice, the particles may not be pure condensates, but may be heavily coated or mixed with pho- tochemical products drizzling down from the stratosphere above, lowering their single-scattering albedos. Methods Spectral data sources. The main gaseous absorber in the H band (1.4–1.8 μm) in Uranus’s spectrum is CH4. The best available source of CH4 line data at low temperature in this range is the WKLMC@80K+ (ref. 14 ) line database, which contains the positions, strengths, lower-state energies and empirical estimates of the rotational quantum number J of lines measured at 80 K and 296 K. These lines are improved over the WKMC@80K (Wang, Kassi, Mondelain, Campargue line list)27 database, previously used to analyse the Gemini/NIFS observations, reanalysed here for Uranus2 as they include extra lines that were detected at 296 K but not at 80 K, and we have further improved our assignment of line widths as described below. For the lines detected at 296 K but not 80 K, lower- state energies were defined so as to yield an intensity at 80 K just below the measurement sensitivity threshold. Hence, the contribution of these lines at cold temperatures bears significant uncertainty. For the lines detected at 80 K but not 296 K, the lower-state energies were arbitrarily set to −1.0 cm−1 . These line data were converted to HITRAN format, using the listed strengths at 296 K directly for lines observed at both 80 K and 296 K, and for lines observed only at 80 K, we extrapolated their strengths to 296 K using the listed arbitrary lower-state energy of −1.0 cm−1 and total partition function (rotational + vibrational) provided as part of HITRAN2012 (ref. 15 ). The spectral range covered by these data is 5,852–7,919 cm−1 (1.262–1.709 μm). These measurements were made for ‘natural’ CH4 gas, for which the CH3D/CH4 ratio, where CH3D is deuterated methane, is estimated14 to be × − 5 10 4 . This is not suitable for calculations in Uranus’s atmosphere, for which the most precise estimate28 of CH3D/CH4 is . ×− . + . − (2 96 ) 100 64 0 71 4 (using an isotopic enrichment factor29 of = . ± .f 1 68 0 23). Hence, lines for CH3D were scaled in strength by 2.96/5. For the foreign-broadened line widths, we used J-dependent H2- and He-broadened widths30 , to which we fitted a fourth-order polynomial in J, using the widths calculated for J = 13 for higher values of J to prevent inaccurate extrapolation (ref. 31 and R.G. and P.G.J.I., manuscript in preparation). We assumed temperature-dependence coefficients of these foreign-broadened widths for H2 broadening32 and He broadening33 . For the line shape, we used a Voigt function, but with sub-Lorentzian correction far from line centre as recommended for H2-broadening conditions34 . However, we also tested the sub-Lorentzian corrections suggested for Titan spectra35 and a sub-Lorentzian correction previously suggested for modelling Uranus spectra36 . Using these three different line shapes, we took account of all lines within 250 cm−1 of each calculation wavelength. Spectroscopic line data for H2S and NH3 were taken from HITRAN2012 (ref. 15 ). The line widths and their temperature exponents were also taken from the foreign-broadened data listed in HITRAN2012. For H2S, these are γ = .0 074air cm−1 atm−1 (where γair is the half-width at half-maximum (cm−1 ) of the broadening at a pressure of 1 atm, with standard terrestrial air as the broadening gas) and a temperature exponent of 0.75, for all lines. HITRAN2012 notes that detailed laboratory investigations are needed to characterize how the line widths vary with the rotational–vibrational quantum numbers, and there appears to be no published evidence on the appropriate values for an H2/He-broadening atmosphere. Similarly, for NH3, we used the published HITRAN2012 foreign- broadening parameters. If the absorption of NH3 had proved to be important, we might have attempted to use line-broadening parameters more suited to H2/He-broadening conditions. However, as reported in our paper, the absorption of NH3 was not detected in these observations, and hence there was no error introduced by using the listed HITRAN2012 air-broadened widths. We also examined using ExoMol line data for H2S (ref. 37 ) and found negligible differences in the spectra computed at Gemini/NIFS resolution with the HITRAN2012 line data. Since the HITRAN2012 line data are much easier to handle (they contain far fewer ‘hot lines’, which are relevant only for high-temperature calculations) and probably have better constrained line frequencies, we decided to use HITRAN2012 for both NH3 and H2S line data. In both cases, in the absence of any better information and in the expectation of weak absorptions (for which the exact line widths are less important), we used the published HITRAN2012 air-broadened widths and a Voigt line shape, with a line wing cut-off of 35 cm−1 to account for typical sub-Lorentzian wing corrections. The line data were converted to k-distribution look-up tables, or k-tables, covering the Gemini/NIFS H-band spectral range, with 20 g-ordinates (that is, ordinates of the fraction of the spectral interval), 15 pressures equally spaced in log pressure between 10−4 bar and 10 bar, and 14 temperatures equally spaced between 50 K and 180 K. These tables were precomputed with the modelled instrument line shape of the Gemini/NIFS observations, set to be Gaussian with a full-width at half-maximum of 0.0003 μm, after an analysis of arc lamp calibration spectra2 . Observations and wavelength calibration. Observations of Uranus were made with the Gemini/NIFS instrument in September 2009 and October/November 201016,17 , with adaptive optics using Uranus’s nearby moons for wavefront sensing (for example, Ariel, Titania). NIFS’s H-band spectral resolution gives a Gaussian instrument function with a spectral resolution with a full-width at half-maximum of 0.0003 μm. The wavelength calibration provided by the standard pipeline of Gemini/NIFS was found to be not quite accurate enough to match the spectral features observed here. The assumed wavelength of sample i in the spectrum is set to λ λ λ= + −i i( )i 0 0 1, where i0 is the sample number of the ‘central’ wavelength, and the wavelength centre and step were initially assumed to be λ = .1 550 μm and λ = .0 0001551 μm, respectively. By comparing the measured spectrum to our initial fitted spectrum, we found that we could achieve a much better fit by modifying these values to λ = .1 549950 μm and λ = .0 000160361 μm. We used these values in the subsequent analysis. Uranus vertical profiles of temperature and gaseous abundance. The reference temperature and abundance profile used in this study (Fig. 2) is based on the F1 STIS/Voyager 2 profile3 as described in the main text. The heights in this profile were calculated from the hydrostatic equation using the local temperature, gravitational acceleration and local mean total molecular mass. For comparison, we also performed retrievals using the temperature–pressure profile determined from Spitzer observations of Uranus’s mid-IR spectrum24 , again with deep NH3 and H2S abundances of 0.001. H2 and He were assumed to be present with a ratio of 85/15, again ensuring the sum of mole fractions adds to unity at all heights. Radiative-transfer analysis. The vertical cloud structure was retrieved from the Gemini/NIFS observations using the NEMESIS (ref. 18 ) radiative-transfer and retrieval code. NEMESIS models planetary spectra either using a line-by-line model or by using the correlated-k approximation38 . For speed, these retrievals were conducted using the method of correlated-k, but we regularly checked that we obtained the same model spectra (to within error) using a line-by-line approach. To model these reflected-sunlight spectra, a matrix-operator multiple-scattering model39 was used, with five zenith angles (five upwards and five downwards) and the number of required components in the Fourier azimuth decomposition determined from the maximum of the reflected or incident-solar zenith angles. The collision-induced absorption of H2–H2 and H2–He was modelled with published coefficients40–42 . Rayleigh scattering was also included for completeness, but was found to be negligible at these wavelengths. To analyse the measured radiance spectra within our radiative-transfer model, we initially used the high-resolution CAVIAR (Continuum Absorption by Visible Nature Astronomy | www.nature.com/natureastronomy
- 7. © 2018 Macmillan Publishers Limited, part of Springer Nature. All rights reserved. ArticlesNature Astronomy and Infrared radiation and its Atmospheric Relevance) solar spectrum43 , which we smoothed to the NIFS resolution of full-width at half-maximum of Δλ = .0 0003 μm. However, we found that this spectrum (and others, for example, refs 44,45 .) contained spurious Fraunhofer lines that did not seem to correspond to features seen at these wavelengths in the Uranus spectra. We must assume that the method used to generate these extraterrestrial solar spectra, namely measuring the solar spectrum at the ground at various zenith angles and extrapolating to an airmass of zero, leads to small errors at these wavelengths. Hence, we used a smoothed version of the solar spectrum45 in our calculations, omitting the spurious Fraunhofer lines, which we found matched our observations much more closely. The observed spectrum (with =n 937y spectral points) was fitted with NEMESIS using a continuous distribution of cloud particles whose opacity at 39 levels equally spaced in log pressure between ~10 bar and ~0.01 bar was retrieved. For this cloud profile, the a priori opacity values (at 1.6 μm) were set to . ± .0 001 0 0005 g−1 cm2 at all levels (equating to opacity/bar values of ~1), with a ‘correlation length’ of 1.5 scale heights to ensure the profile was vertically smooth. NEMESIS treats cloud opacity as log values, and so the percentage error of ±50% is more relevant. The particles were assumed to have a standard gamma size distribution with mean radius 1.0 μm and variance 0.05, which are typical values assumed in previous analyses. Using a previously published technique21 , NEMESIS was used to retrieve the imaginary refractive index spectrum of these particles. The a priori imaginary refractive index spectrum was sampled at every 0.05 μm between 1.4 μm and 1.8 μm, with a correlation length of 0.1 μm set in the covariance matrix, to ensure that the retrieved spectrum varied reasonably smoothly with wavelength. At each iteration of the model, the real part of the particles’ refractive index spectrum was computed from the imaginary part using the Kramers–Kronig relation46 , fixing the real part of the refractive index of these particles to 1.4 at a wavelength of 1.6 μm. Self-consistent scattering properties were then calculated using Mie theory, but the Mie-calculated phase functions were approximated with combined Henyey–Greenstein functions at each wavelength to smooth over features peculiar to perfectly spherical scatterers, such as the ‘rainbow’ and ‘glory’. This is justified since we expect the actual aerosols in the atmosphere of Uranus to be solid condensates and thus non-spherical. However, assuming these non-spherical particles are randomly oriented with respect to each other, the bulk scattering properties such as cross-section and single-scattering albedo are reasonably approximated with Mie theory47 , especially if the phase functions are also modified as we describe. Since CH4 is the main gaseous absorber, we tested to see whether some of the approximations assumed in the WKLMC@80K+ (ref. 14 ) line database might be having an adverse effect on our calculations. We first checked whether excluding the lines observed at 296 K but not at 80 K (and which are assigned a lower-state energy high enough to reduce the computed strength at 80 K to be below the measurement noise limit) might significantly affect the calculated spectra, but found very little difference when these lines were neglected. We also checked the effect of excluding the lines observed only at 80 K as well (and which are assigned an arbitrary lower-state energy of −1 cm−1 ). In this case, the differences were larger, but on the whole, the model correctly reproduced the shape and main features of the observed spectrum. Retrieval tests. Supplementary Fig. 12 shows our fit to the Uranus spectrum, setting the a priori imaginary refractive indices to . ± .0 01 0 005 at all wavelengths and using the three different sub-Lorentzian line shapes for CH4 (neglecting H2S and NH3 absorption). We found that each assumption for the sub-Lorentzian correction gave a very similar fit to the spectrum (χ ∕ ≈n2 1.7–1.9), which was initially puzzling. However, the reason for this is easy to understand from Supplementary Fig. 12. The effect of different sub-Lorentzian corrections is most apparent on the short-wave side of the strong absorption band at 1.7–1.8 μm, and previous studies have tuned the correction to get the best match to the observed spectrum between 1.5 μm and 1.62 μm. Our current model, however, can very easily fit this region by varying the imaginary refractive index spectrum of the particles, and it can be seen that very different imaginary refractive index spectra are retrieved for the three different sub-Lorentzian corrections, but very similar vertical cloud distributions and similar spectral fits. In other words, there is a degeneracy between the sub-Lorentzian corrections and the retrieved imaginary refractive index spectrum. In fact, we had to be careful not to allow the imaginary refractive index retrieval too much freedom. Early retrievals sampled the imaginary refractive index spectrum more finely (Δλ = .0 005 μm) over the 1.56–1.6 μm range, and a substantial part of the spectral variation of reflectivity was accounted for by variations in ni, which it was difficult to justify as being realistic. We thus assumed the slow wavelength-to-wavelength variation in ni as described. Since the line shape recommended for H2–He atmospheres34 gave a good fit to the observations, we chose to use this assumption in our final analysis. Scattering properties. Since the fitted imaginary refractive index spectrum for our cloud particles has typical values of ≈ .n 0 06i , this leads the particles to be quite absorbing. This can best be seen in Supplementary Fig. 1, where we compare the computed wavelength dependence of the extinction cross-section (normalized to 1.6 μm), the single-scattering albedo and the phase-function asymmetry of the forward part of the fitted combined Henyey–Greenstein phase function for the case when the a priori imaginary refractive indices were set to . ± .0 01 0 005. We found the back-scattering part of the phase function to be negligible. As we can see, the single-scattering albedo has values of ϖ = . − .0 7 0 8, while the phase-function asymmetry, g, is ~0.7. Data availability. The data that support the plots within this paper and other findings of this study are available from the corresponding author upon reasonable request. Received: 26 October 2017; Accepted: 27 February 2018; Published: xx xx xxxx References 1. de Kleer, K., Luszcz-Cook, S., de Pater, I., Ádámkovics, M. & Hammel, H. B. Clouds and aerosols on Uranus: radiative transfer modeling of spatially- resolved near-infrared Keck spectra. Icarus 256, 120–137 (2015). 2. Irwin, P. G. J. et al. The application of new methane line absorption data to Gemini-N/NIFS and KPNO/FTS observations of Uranus’ near-infrared spectrum. Icarus 220, 369–382 (2012). 3. Sromovsky, L. A., Fry, P. M. & Kim, J. H. Methane on Uranus: the case for a compact CH4 cloud layer at low latitudes and a severe CH4 depletion at high latitudes based on a re-analysis of Voyager occultation measurements and STIS spectroscopy. Icarus 215, 292–312 (2011). 4. Weidenschilling, S. J. & Lewis, J. S. Atmospheric and cloud structures of the Jovian planets. Icarus 20, 465–476 (1973). 5. de Pater, I., Romani, P. N. & Atreya, S. K. Possible microwave absorption by H2S gas in Uranus’ and Neptune’s atmospheres. Icarus 91, 220–233 (1991). 6. de Pater, I., Romani, P. N. & Atreya, S. K. Uranus’ deep atmosphere revealed. Icarus 82, 288–313 (1989). 7. de Pater, I. & Massie, S. Models of the millimeter-centimeter spectra of the giant planets. Icarus 62, 143–171 (1985). 8. Cameron, A. G. W. in Essays in Nuclear Astrophysics (eds C. A. Barnes et al.) 23–43 (Cambridge Univ. Press, London, 1982). 9. Niemann, H. B. et al. The composition of the Jovian atmosphere as determined by the Galileo probe mass spectrometer. J. Geophys. Res. 103, 22831–22845 (1998). 10. Boissier, J. et al. Interferometric imaging of the sulfur-bearing molecules H2S, SO and CS in comet C/1995 O1 (Hale-Bopp). Astron. Astrophys. 475, 1131–1144 (2007). 11. Eberhardt, P., Meier, R., Krankowsky, D. & Hodges, P. R. Methanol and hydrogen sulfide in comet P/Halley. Astron. Astrophys. 288, 315–329 (1994). 12. Noll, K. S. et al. HST spectroscopic observations of Jupiter after the collision of comet Shoemaker-Levy 9. Science 267, 1307–1313 (1995). 13. Lellouch, E. Chemistry induced by the impacts: observations. In Proc. Space Telescope Science Institute Workshop (eds Noll, K. S. et al.) 213–242 (Vol. 156, IAU Colloquium, Cambridge Univ. Press, Cambridge, 1996). 14. Campargue, A., Leshchishina, O., Wang, L., Mondelain, D. & Kassi, S. The WKLMC empirical line lists (5852–7919 cm−1 ) for methane between 80 K and 296 K: ‘final’ lists for atmospheric and planetary applications. J. Molec. Spectrosc. 291, 16–22 (2013). 15. Rothman, L. S. et al. The HITRAN2012 molecular spectroscopic database. J. Quant. Spectrosc. Ra. 130, 4–50 (2013). 16. Irwin, P. G. J. et al. Uranus’ cloud structure and seasonal variability from Gemini-North and UKIRT observations. Icarus 212, 339–350 (2011). 17. Irwin, P. G. J. et al. Further seasonal changes in Uranus’ cloud structure observed by Gemini-North and UKIRT. Icarus 218, 47–55 (2012). 18. Irwin, P. G. J. et al. The NEMESIS planetary atmosphere radiative transfer and retrieval tool. J. Quant. Spectrosc. Ra.109, 1136–1150 (2008). 19. Karkoschka, E. & Tomasko, M. The haze and methane distributions on Uranus from HST-STIS spectroscopy. Icarus 202, 287–309 (2009). 20. Fray, N. & Schmitt, B. Sublimation of ices of astrophysical interest: a bibliographic review. Plan. Space Sci. 57, 2053–2080 (2009). 21. Irwin, P. G. J. et al. Reanalysis of Uranus’ cloud scattering properties from IRTF/SpeX observations using a self-consistent scattering cloud retrieval scheme. Icarus 250, 462–476 (2015). 22. Karkoschka, E. & Tomasko, M. Methane absorption coefficients for the jovian planets from laboratory, Huygens, and HST data. Icarus 205, 674–694 (2010). 23. Sromovsky, L. A. & Fry, P. M. Spatially resolved cloud structure on Uranus: implications of near-IR adaptive optics imaging. Icarus 192, 527–557 (2007). 24. Orton, G. S. et al. Mid-infrared spectroscopy of Uranus from the Spitzer Infrared Spectrometer: 1. determination of the mean temperature of the upper troposphere and stratosphere. Icarus 243, 494–513 (2014). 25. Grevesse, N., Asplund, M. & Sauval, A. D. The solar chemical composition. Space Sci. Rev. 130, 105–114 (2007). 26. Lodders. K. in Principles and Perspectives in Cosmochemistry (eds Goswami, A. & Reddy, B. E.) 379–417 (Astrophysics and Space Science Proc., Springer-Verlag Berlin Heidelberg, Berlin, 2010). Nature Astronomy | www.nature.com/natureastronomy
- 8. © 2018 Macmillan Publishers Limited, part of Springer Nature. All rights reserved. Articles Nature Astronomy 27. Campargue, A. et al. An empirical line list for methane in the 1.26–1.71 μm region for planetary investigations (T = 80–300 K). Application to Titan. Icarus 219, 110–128 (2012). 28. Feuchtgruber, H. et al. The D/H ratio in the atmospheres of Uranus and Neptune from Herschel-PACS observations. Astron. Astrophys. 551, A126 (2013). 29. Lécluse, C., Robert, F., Gautier, D. & Guiraud, M. Deuterium enrichment in giant planets. Planet. Space Sci. 44, 1579–1592 (1996). 30. Pine, A. S. Self-, N2-, O2-, H2-, Ar-, and He- broadening in the v3 band Q branch of CH4. J. Chem. Phys. 97, 773–785 (1992). 31. Amundsen, D. S. et al. Accuracy tests of radiation schemes used in hot Jupiter global circulation models. Astron. Astrophys. 564, A59 (2014). 32. Margolis, J. S. Hydrogen broadening and collision-induced line shifts of methane at 4200 cm−1 . J. Quant. Spectrosc. Ra. 49, 71–79 (1993). 33. Varanasi, P. & Chudamani, S. The temperature dependence of lineshifts, linewidths and line intensities of methane at low temperatures. J. Quant. Spectrosc. Ra. 43, 1–11 (1990). 34. Hartmann, J.-M. et al. A far wing lineshape for H2-broadened CH4 infrared transitions. J. Quant. Spectrosc. Ra. 72, 117–122 (2002). 35. de Bergh, C. et al. Applications of a new set of methane line parameters to the modeling of Titan’s spectrum in the 1.58 μm window. Planet. Space Sci. 61, 85–98 (2012). 36. Sromovsky, L. A., Fry, P. M., Boudon, V., Campargue, A. & Nikitin, A. Comparison of line-by-line and band models of near-IR methane absorption applied to outer planet atmospheres. Icarus 218, 1–23 (2012). 37. Azzam, A. A. A., Tennyson, J., Yurchenko, S. N. & Naumenko, O. V. ExoMol molecular line lists—XVI: the rotation-vibration spectrum of hot H2S. Mon. Not. Roy. Ast. Soc. 460, 4063–4074 (2016). 38. Lacis, A. A. & Oinas, V. A description of the correlated-k distribution method for modelling nongray gaseous absorption, thermal emission, and multiple scattering in vertically inhomogeneous atmospheres. J. Geophys. Res. 96, 9027–9063 (1991). 39. Plass, G. N., Kattawar, G. W. & Catchings, F. E. Matrix operator method of radiative transfer. 1: Rayleigh scattering. Appl. Opt. 12, 314–329 (1973). 40. Borysow, A. Modeling of collision-induced infrared absorption spectra of H2–H2 pairs in the fundamental band at temperatures from 20 to 300 K. Icarus 92, 273–279 (1991). 41. Borysow, A. New model of collision-induced infrared absorption spectra of H2–He pairs in the 2–2.5 μm range at temperatures from 20 to 300 K—an update. Icarus 96, 169–175 (1992). 42. Zheng, C. & Borysow, A. Modeling of collision-induced infrared absorption spectra of H2 pairs in the first overtone band at temperatures from 20 to 500 K. Icarus 113, 84–90 (1995). 43. Menang, K. P., Coleman, M. D., Gardiner, T. D., Ptashnik, I. V. & Shine, K. P. A high-resolution near-infrared extraterrestrial solar spectrum derived from ground-based Fourier transform spectrometer measurements. J. Geophys. Res. 118, 5319–5331 (2013). 44. Fiorenza, C. & Formisano, V. A solar spectrum for PFS data analysis. Planet. Space Sci. 53, 1009–1016 (2005). 45. Thuillier, G. et al. The solar spectral irradiance from 200 to 2400 nm as measured by the SOLSPEC spectrometer from the ATLAS and EURECA missions. Sol. Phys. 214, 1–22 (2003). 46. Sheik-Bahae, M. in Encyclopedia of Modern Optics (eds Guenther, R. D. et al.) 234–239 (Academic Press, Amsterdam, 2005). 47. Mishchenko, M. I., Travis, L. D., Khan, R. A. & West, R. A. Modeling phase functions for dustlike tropospheric aerosols using a shape mixture of randomly oriented polydisperse spheroids. J. Geophys. Res. 102, 16831–16847 (1997). Acknowledgements We are grateful to the United Kingdom Science and Technology Facilities Council for funding this research and to our support astronomers: R. McDermid and C. Trujillo. The Gemini Observatory is operated by the Association of Universities for Research in Astronomy under a cooperative agreement with the NSF on behalf of the Gemini partnership: the National Science Foundation (United States), the Science and Technology Facilities Council (United Kingdom), the National Research Council (Canada), CONICYT (Chile), the Australian Research Council (Australia), Ministério da Ciência e Tecnologia (Brazil) and Ministerio de Ciencia, Tecnología e Innovación Productiva (Argentina). We thank L. Sromovsky for providing the code used to generate our Rayleigh-scattering opacities. G.A.O. was supported by NASA funding to the Jet Propulsion Laboratory, California Institute of Technology. L.N.F. was supported by a Royal Society Research Fellowship at the University of Leicester. Author contributions P.G.J.I. wrote the proposal to make the original observations, and reduced and reanalysed the data using the NEMESIS code; B.B. and R.G. assisted in identifying and validating the line data used. G.A.O. provided the Spitzer temperature–pressure profile used. All authors contributed to the analysis and interpretation of the results, and all authors wrote the final paper. Competing interests The authors declare no competing interests. Additional information Supplementary information is available for this paper at https://doi.org/10.1038/ s41550-018-0432-1. Reprints and permissions information is available at www.nature.com/reprints. Correspondence and requests for materials should be addressed to P.G.J.I. Publisher’s note: Springer Nature remains neutral with regard to jurisdictional claims in published maps and institutional affiliations. Nature Astronomy | www.nature.com/natureastronomy