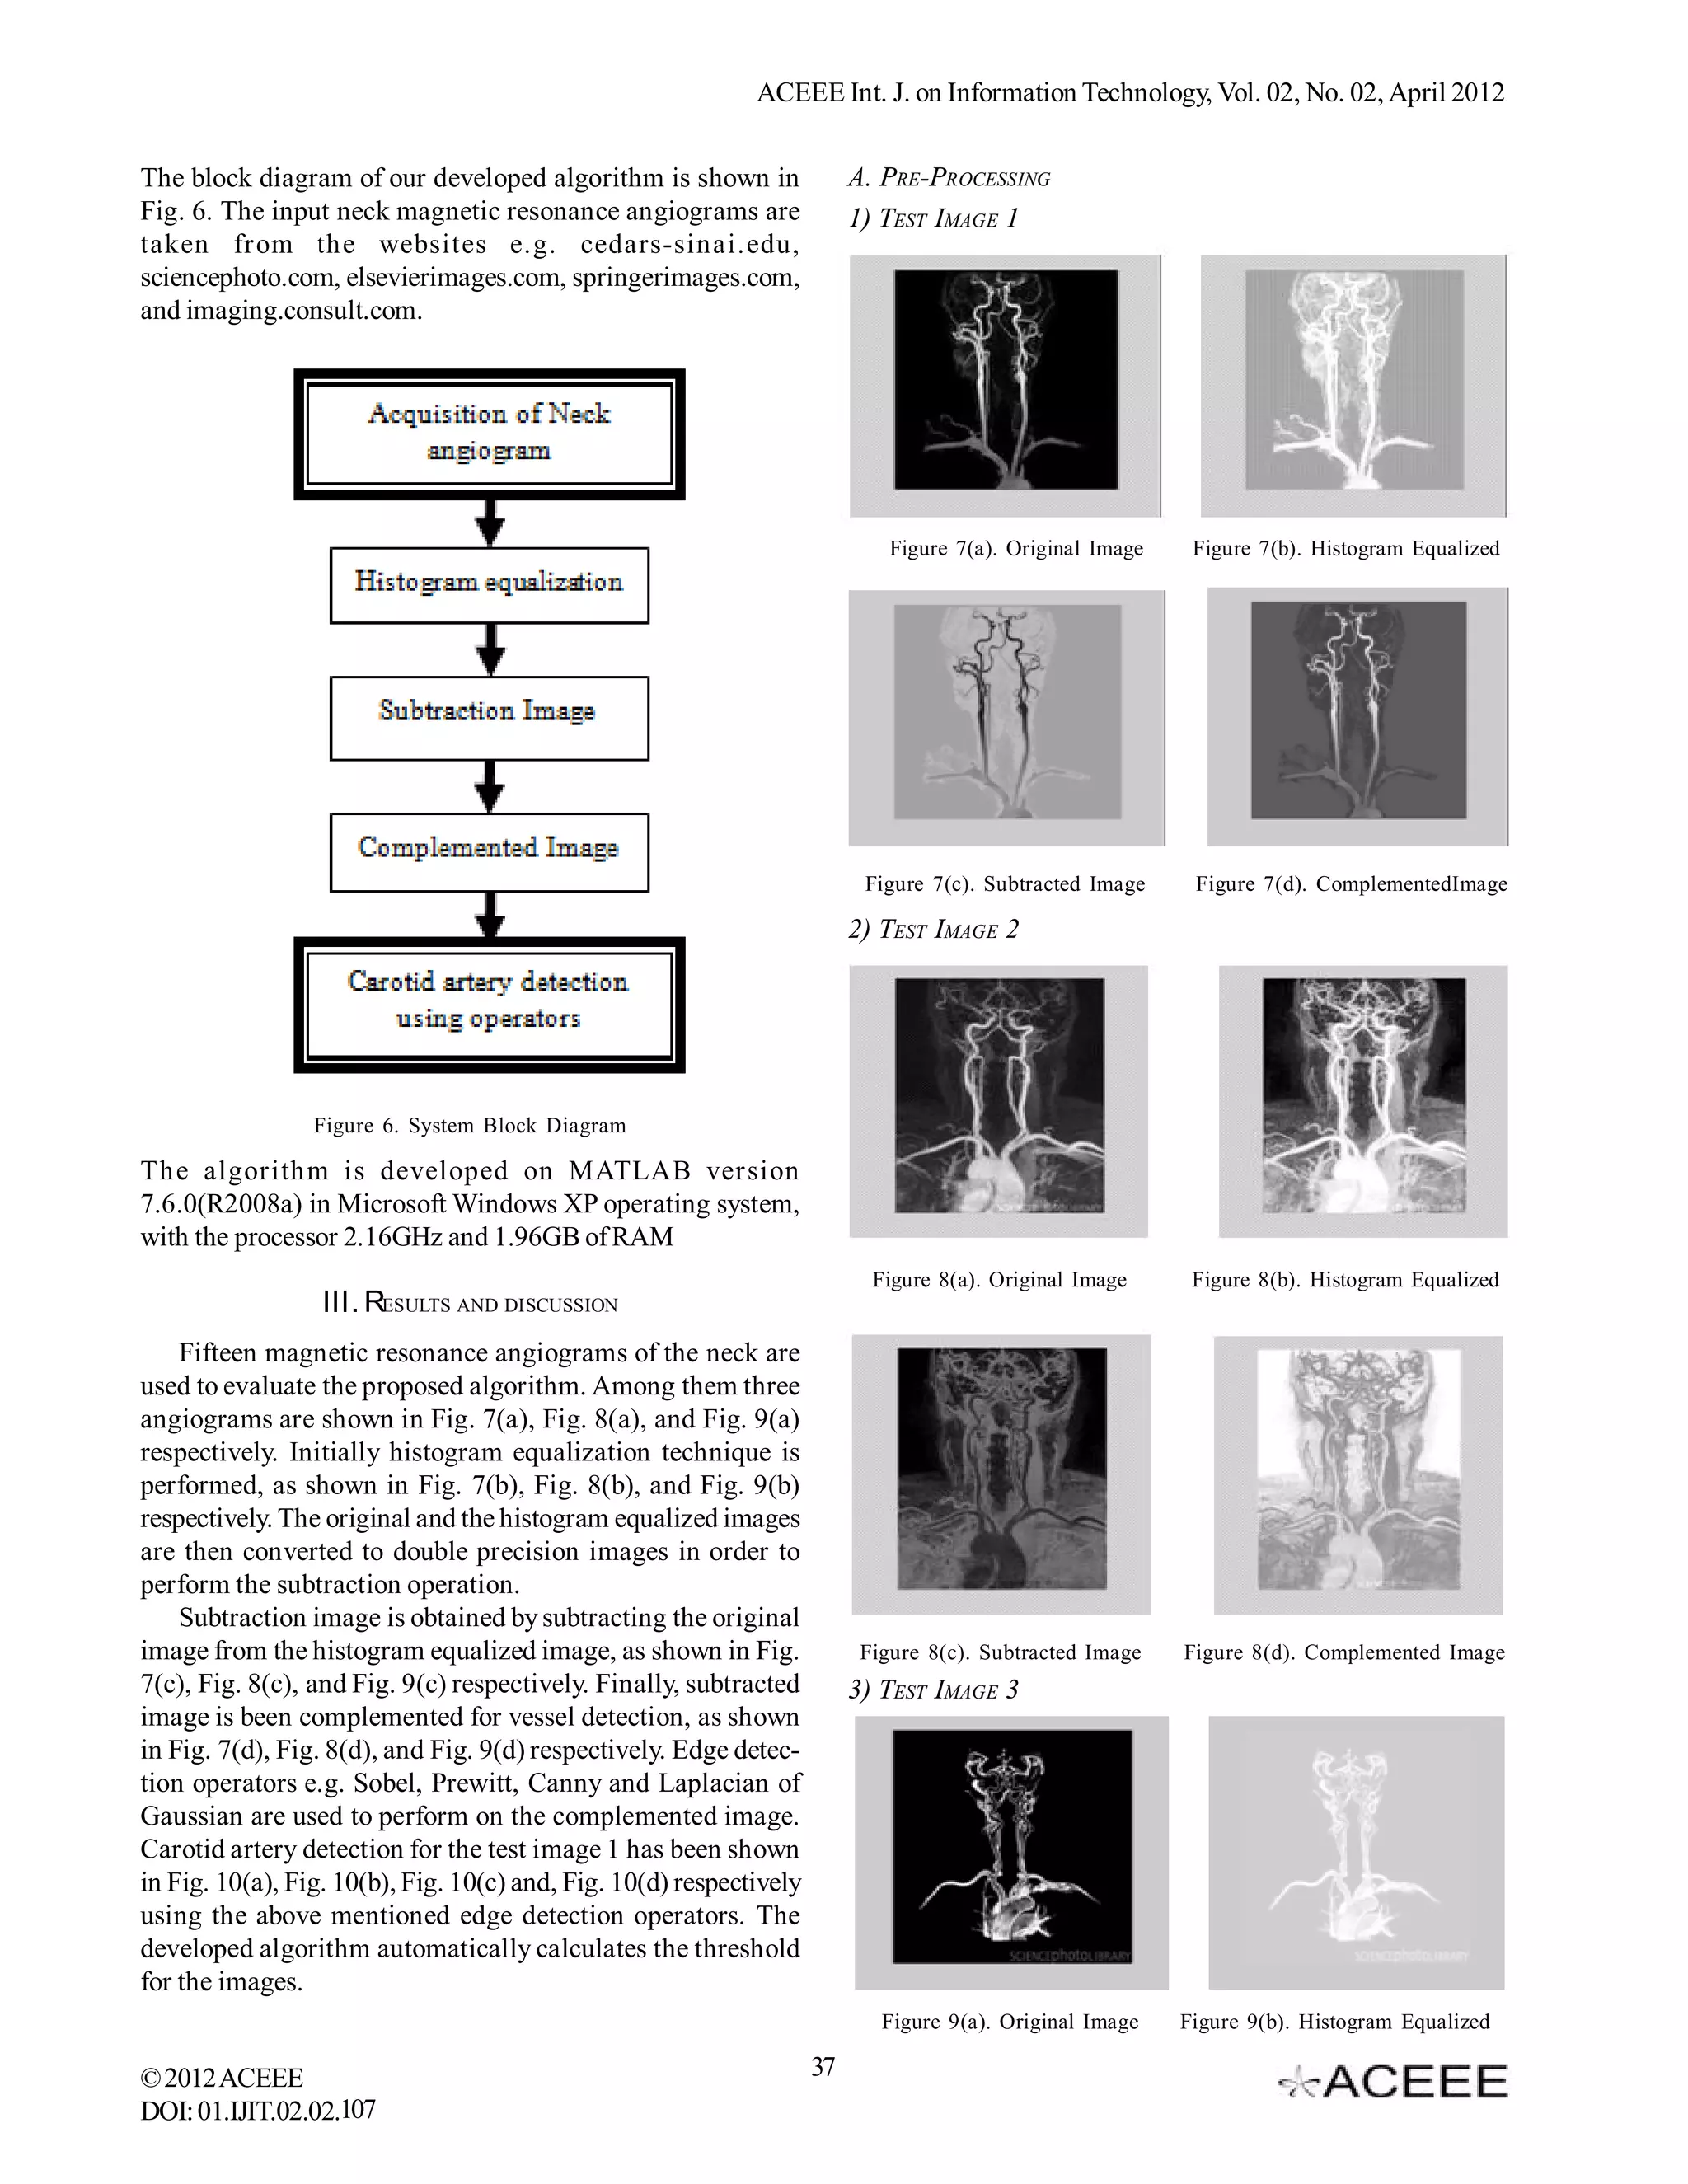
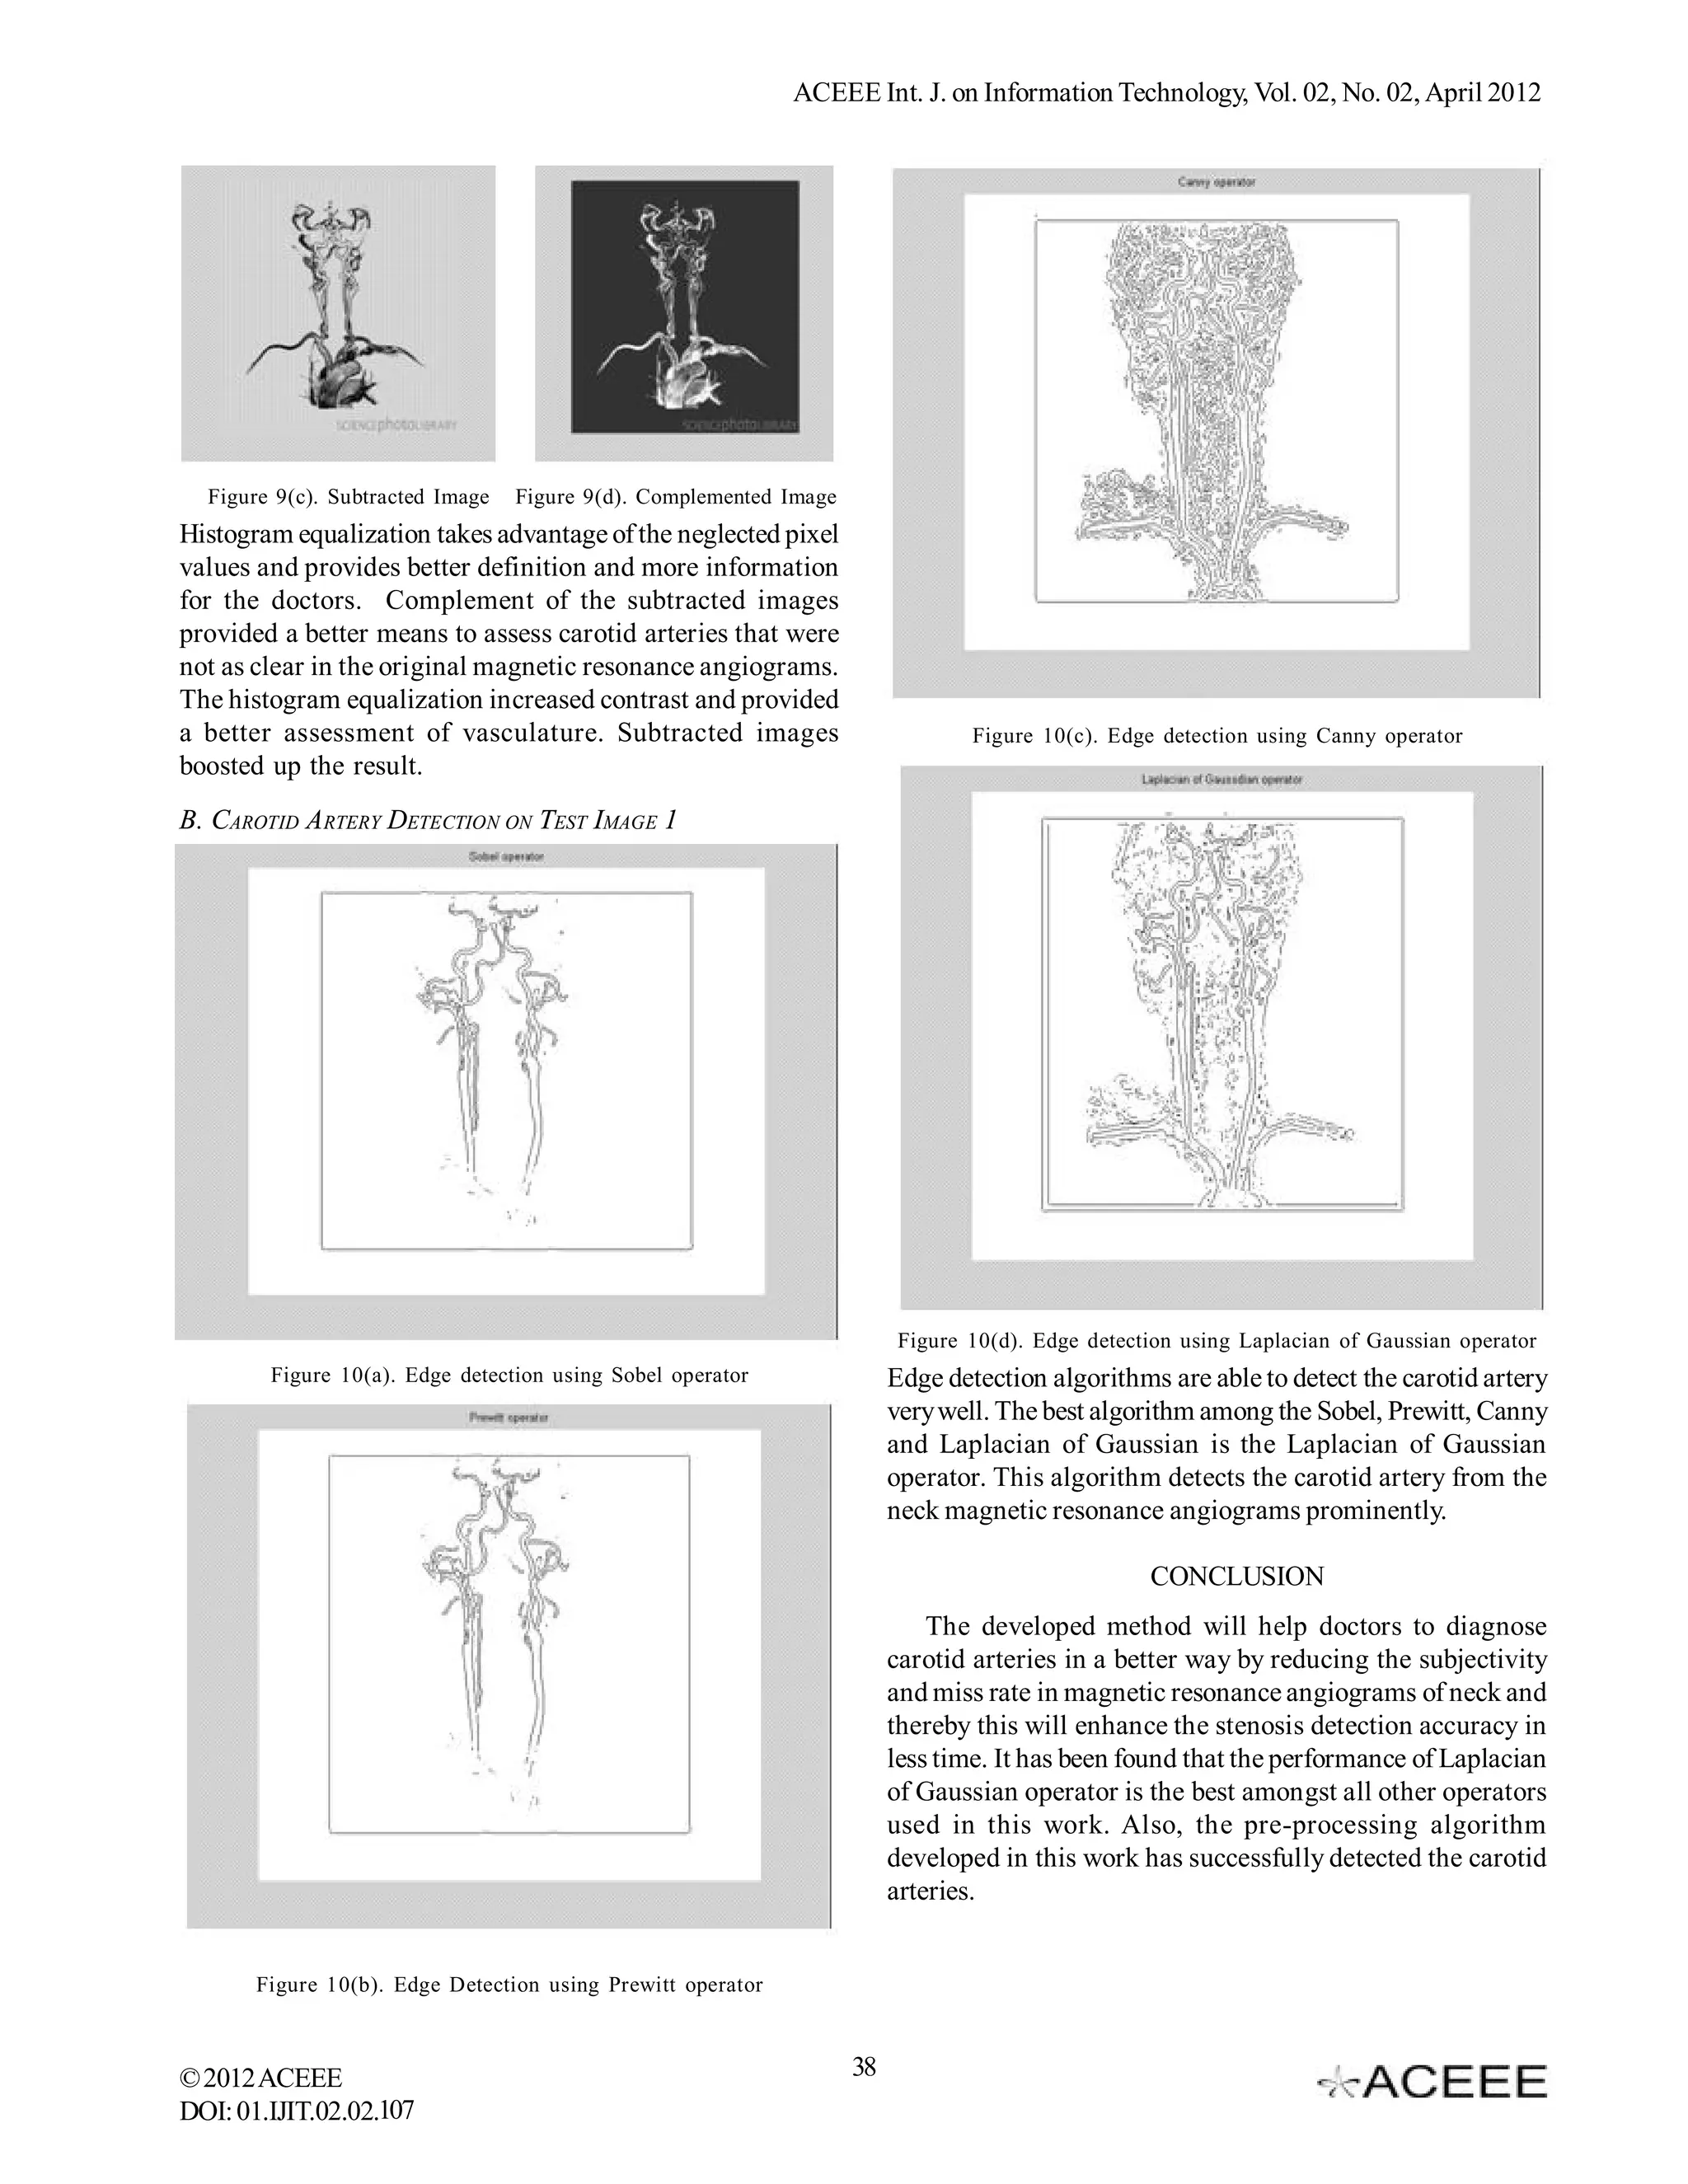
ACEEE Int. J. on Information Technology, Vol. 02, No. 02, April 2012


        Detection of Carotid Artery from Pre-Processed
               Magnetic Resonance Angiogram
                                           Sarbani Datta1, Dr. Monisha Chakraborty*,1
                    1
                      Student, School of Bio-Science and Engineering, Jadavpur University, Kolkata, India
                                                Email: sarbanidatta.ju@gmail.com
             *,1
                 Assistant Professor, School of Bio-Science and Engineering, Jadavpur University, Kolkata, India
                                              Email: monishack@school.jdvu.ac.in
                                                    *, 1
                                                         Corresponding Author

Abstract—Boundary detection is playing an important role in              narrowing of the carotid arteries [6, 7]. Our proposed algorithm
the medical image analysis. In certain cases it becomes very             significantly detects the carotid artery from the pre-processed
difficult for the doctors to assess the carotid arteries from the        magnetic resonance angiogram, which will assist the doctors
magnetic resonance angiography (MRA) of the neck. In this                to analyze the carotid arterial disease from the vasculature
paper an attempt has been made to detect carotid arteries
                                                                         detected image without any difficulty.
from the neck magnetic resonance angiograms, so as to
overcome such difficulties. The algorithm pre-processes the
magnetic resonance angiograms and subsequently detects the                                II. MATERIALS AND METHODS
carotid artery. Stenosis is expected to reduce the diameter of           A. PRE-PROCESSING TECHNIQUES
the vessel. The diameter can be measured from the vasculature
detected image. As the algorithm successfully detects the                    Histogram equalization is a spatial domain image
carotid artery from the neck magnetic resonance angiograms,              enhancement technique that modifies the distribution of the
therefore it will help doctors for diagnosis and serve as a step         pixels to become more evenly distributed over the available
in the prevention of cardiovascular diseases.                            pixel range [8]. In histogram processing, a histogram displays
                                                                         the distribution of the pixel intensity values, mimicking the
Index Terms—magnetic resonance angiogram, pre-processing,                probability density function (PDF) for a continuous function.
carotid artery detection, cardiovascular diseases, medical
                                                                         An image that has a uniform PDF will have pixel values at all
image analysis
                                                                         valid intensities. Therefore, it will show a high contrast image.
                                                                         Histogram equalization creates a uniform PDF or histogram
                         I. INTRODUCTION
                                                                         [9]. This can be accomplished by performing a global
    Magnetic resonance angiography (MRA) is a way to                     equalization that considers all the pixels in the entire image or
study vascular structures through the use of a Gadolinium                a local equalization that segments the image into regions.
based contrast agent, Gd-DTPA [1, 3]. A patient is injected                  In case of the negative of an image, enhancement of white
with contrast during scanning, and images are captured during            or gray details in a dark background occurs [9]. A negative
the arterial phase. Arteries appear bright on the image                  image is calculated using (1),
whereas other structures without the contrast appear darker.                                                                          (1)
These images are used to diagnose the vasculature diseases               Where P is the new pixel value, L is the number of new pixel
such as stenosis [1, 2]. This technique has several advantages           values and I is the original pixel intensity [8].
over conventional digital subtraction angiography (DSA).                     Subtraction images may also cause enhancement of
    The magnetic resonance angiograms of neck which is                   certain regions of an image. In contrast enhanced MRA, a
acquired for detection and diagnosis of carotid arterial disease         mask image is used and subtracted from a contrast enhanced
is also called carotid artery stenosis. The term refers to the           image to boost up the contrast [10].
narrowing of carotid arteries due to deposition of fatty
substances and cholesterol. The stenosis or occlusion refers             B. EDGE DETECTION
to the blockage of the artery. When the carotid arteries are                 The edge detection process detects outline of an object
obstructed, it leads to increased risk for a stroke [4]. A stroke        and boundaries between objects and the background in the
may occur if the artery becomes extremely narrowed or                    image. The edge-detection operation is performed by forming
breakage of a piece of plaque and travels to the smaller arteries        a matrix centered on a pixel chosen as the center of the matrix
of the brain or even formation of clot which may block a                 area [11]. If the value of this matrix area is above a given
narrowed artery. A stroke is similar to a heart attack, which            threshold value, then the middle pixel is considered to be as
occurs when the brain cells are devoid of oxygen and sugar               an edge. Examples of gradient based edge detectors are Sobel
carried to them by blood. If the lack of blood flow lasts for 3          and Prewitt operators. The gradient-based algorithms have
to 6 hours, the damage is permanent [5]. There may be no                 kernel operators that calculate the strength of the slope in
symptoms for carotid artery disease.                                     directions which are orthogonal to each other, commonly
    A magnetic resonance angiography (MRA) of the neck                   vertical and horizontal. Later, the different components of
inthe non-invasive mode is performed to identify the                     the slopes are combined to give the total value of the edge
© 2012 ACEEE                                                        35
DOI: 01.IJIT.02.02.107
ACEEE Int. J. on Information Technology, Vol. 02, No. 02, April 2012


strength [8].The first-order derivative of an intensity, f(x, y),
of an image is the gradient. The gradient is defined as the
vector as shown in (2).
                                                                         In the mentioned formulation, the difference between the first
                                                                         and third rows of the 3x3 image region as show in Fig. 1
                                                                         approximates the derivative in the x-direction, and the
                                                                         difference between the third and first columns approximates
The magnitude of the vector is given in (3).                             the derivative in the y-direction [8, 11, 12]. The Prewitt masks
                                                                         as shown in Fig. 3 are used to implement Gx and Gy.


The gradient vector, points in the direction of the maximum
rate of change of the 2-D function f(x, y), of an image. The
angle at which this maximum rate of change occurs is
mathematically shown in (4).                                                                  Figure3. Prewitt masks
                                                                         II1) CANNY OPERATOR
                                                                              The Canny edge detection algorithm is known as an
                                                                         optimal edge detector based on a set of criteria which include
                                                                         finding the most edges by minimizing the error rate, marking
There are various approaches as mentioned in this section to             edges as closely as possible to the actual edges to maximize
determine the derivatives Gx and Gy digitally. The second-               localization, and marking edges only once when a single edge
order derivatives of the intensity, f(x, y), of an image are             exists for minimal response [13].
computed using the Laplacian equation as given in (5).                        The first stage involves smoothing the image by
                                                                         convolving with a Gaussian filter. This is followed by
                                                                         computing the gradient of the image by feeding the smoothed
                                                                         image through a convolution operation with the derivative
1) SOBEL OPERATOR
                                                                         of the Gaussian in both the vertical and horizontal directions
    The Sobel operator performs a 2-D spatial gradient                   [8, 11].
measurement on an image. It is used to find the approximate
absolute gradient magnitude at each point in an input
grayscale image [12]. Fig. 1 shows the 3x3 area representing
the gray levels of an image. The operator consists of a pair of
3×3 convolution masks as shown in Fig. 2. One mask is simply
the other rotated by 90° [8, 11-12].
                                                                                        Figure4. Canny convolution masks
                                                                         1V) LAPLACIAN OF GAUSSIAN OPERATOR
                                                                             The Laplacian of an image highlights regions of rapid
                                                                         intensity change and is therefore often used for edge
                  Figure1. Image Neighborhood                            detection [8]. The Laplacian is applied to an image that has
                                                                         first been smoothed with Gaussian filter in order to reduce its
                                                                         sensitivity to noise. The operator takes a single gray level
                                                                         image as input and produces another gray level image as
                                                                         output.

                Figure2. Sobel convolution masks

The detector uses the masks to compute the first order
derivatives Gx and Gy, as shown in (6).
                                                                                       Figure5. Laplacian of Gaussian kernels

                                                                         The kernels that are mentioned in Fig. 5 are used as discrete
II) PREWITT OPERATOR                                                     approximations to the Laplacian filter [8, 12]. The 2-D LoG
    The Prewitt operator as similar to the Sobel measures two            function centered on zero and with Gaussian standard
components. The vertical edge component is calculated with               deviation ó has the form as shown in (9).
kernel Gx and the horizontal edge component is calculated
with kernel Gy, as shown in (7).
© 2012 ACEEE                                                        36
DOI: 01.IJIT.02.02.107
ACEEE Int. J. on Information Technology, Vol. 02, No. 02, April 2012


The block diagram of our developed algorithm is shown in                  A. PRE-PROCESSING
Fig. 6. The input neck magnetic resonance angiograms are                  1) TEST IMAGE 1
taken from the websites e.g. cedars-sinai.edu,
sciencephoto.com, elsevierimages.com, springerimages.com,
and imaging.consult.com.


                                                                              Figure 7(a). Original Image    Figure 7(b). Histogram Equalized


                                                                           Figure 7(c). Subtracted Image     Figure 7(d). ComplementedImage

                                                                          2) TEST IMAGE 2


                 Figure 6. System Block Diagram

The algorithm is developed on MATLAB version
7.6.0(R2008a) in Microsoft Windows XP operating system,
with the processor 2.16GHz and 1.96GB of RAM
                                                                            Figure 8(a). Original Image      Figure 8(b). Histogram Equalized
                  III. RESULTS AND DISCUSSION
    Fifteen magnetic resonance angiograms of the neck are
used to evaluate the proposed algorithm. Among them three
angiograms are shown in Fig. 7(a), Fig. 8(a), and Fig. 9(a)
respectively. Initially histogram equalization technique is
performed, as shown in Fig. 7(b), Fig. 8(b), and Fig. 9(b)
respectively. The original and the histogram equalized images
are then converted to double precision images in order to
perform the subtraction operation.
    Subtraction image is obtained by subtracting the original
image from the histogram equalized image, as shown in Fig.                 Figure 8(c). Subtracted Image    Figure 8(d). Complemented Image
7(c), Fig. 8(c), and Fig. 9(c) respectively. Finally, subtracted          3) TEST IMAGE 3
image is been complemented for vessel detection, as shown
in Fig. 7(d), Fig. 8(d), and Fig. 9(d) respectively. Edge detec-
tion operators e.g. Sobel, Prewitt, Canny and Laplacian of
Gaussian are used to perform on the complemented image.
Carotid artery detection for the test image 1 has been shown
in Fig. 10(a), Fig. 10(b), Fig. 10(c) and, Fig. 10(d) respectively
using the above mentioned edge detection operators. The
developed algorithm automatically calculates the threshold
for the images.
                                                                             Figure 9(a). Original Image    Figure 9(b). Histogram Equalized

© 2012 ACEEE                                                         37
DOI: 01.IJIT.02.02.107
ACEEE Int. J. on Information Technology, Vol. 02, No. 02, April 2012


  Figure 9(c). Subtracted Image   Figure 9(d). Complemented Image
Histogram equalization takes advantage of the neglected pixel
values and provides better definition and more information
for the doctors. Complement of the subtracted images
provided a better means to assess carotid arteries that were
not as clear in the original magnetic resonance angiograms.
The histogram equalization increased contrast and provided
a better assessment of vasculature. Subtracted images                            Figure 10(c). Edge detection using Canny operator
boosted up the result.
B. CAROTID A RTERY DETECTION ON TEST IMAGE 1


                                                                          Figure 10(d). Edge detection using Laplacian of Gaussian operator
        Figure 10(a). Edge detection using Sobel operator                Edge detection algorithms are able to detect the carotid artery
                                                                         very well. The best algorithm among the Sobel, Prewitt, Canny
                                                                         and Laplacian of Gaussian is the Laplacian of Gaussian
                                                                         operator. This algorithm detects the carotid artery from the
                                                                         neck magnetic resonance angiograms prominently.

                                                                                                   CONCLUSION
                                                                             The developed method will help doctors to diagnose
                                                                         carotid arteries in a better way by reducing the subjectivity
                                                                         and miss rate in magnetic resonance angiograms of neck and
                                                                         thereby this will enhance the stenosis detection accuracy in
                                                                         less time. It has been found that the performance of Laplacian
                                                                         of Gaussian operator is the best amongst all other operators
                                                                         used in this work. Also, the pre-processing algorithm
                                                                         developed in this work has successfully detected the carotid
                                                                         arteries.


       Figure 10(b). Edge Detection using Prewitt operator


© 2012 ACEEE                                                        38
DOI: 01.IJIT.02.02.107
ACEEE Int. J. on Information Technology, Vol. 02, No. 02, April 2012


                          REFERENCES                                          on statistical mixture modeling and local phase coherence,” IEEE
                                                                              Transactions on Medical Imaging, vol. 23, no. 12, pp. 1490-1507,
[1] T.K.Mittal, C.Evans, T.Perkins, and A.M.Wood, “Renal                      December 2004.
arteriography using gadolinium enhanced 3D MR angiography-                    [7] J.S.Suri and S.Laxminarayan, Angiography and plaque imaging:
clinical experience with the technique, its limitations and pitfalls”,        advanced segmentation techniques, CRC Press, 2003.
The British Journal of Radiology, pp.495-502, 2001.                           [8] R. C. Gonzalez and R. E. Woods, Digital Image Processing,
[2] Y. Sun and D. Parker, “Small vessel enhancement in MRA images             Prentice Hall, pp. 711-791, 2001.
using local maximum mean processing,” IEEE Trans. on Image                    [9] Y.H.Hu, ECE 533 Image Processing Lecture Notes: Image
Processing, vol. 10, pp. 1687-1699, 2001.                                     Enhancement by Modifying Gray Scale of Individual Pixels, 2002-
[3] A.A.Braidot, G.M.Peltzer, J.O.Romagnoli, A.J.Sattler, and                 2003.
C.E.Schira, “Pre-processing in three-dimensional magnetic resonance           [10] M.Prince, T.M.Grist, and J.F.Debatin, 3D Contrast MR
angiography (MRA) images,” Journal of Physics, 2007.                          Angiography, Springer-Verlag, NY, 1999.
[4] P.Yan and A.A.Kassim, “MRA image segmentation with                        [11] E.Nadernejad, S.Sharifzadeh,, and H. Hassanpour, “Edge
capillary active contour,” Proceedings of the International Conf.             detection techniques: evaluation and comparisons,” Applied
on Medical Image Computing and Computer Assisted Intervention,                Mathematical Sciences, vol.2, pp. 1507-1520, 2008.
vol. 1, pp. 51-58, 2005.                                                      [12] A.A. Moustafa and Z.A. Alqadi, “A practical approach of
[5] N.Passat, C.Ronse, J.Baruthio, J.P.Armspach, and C.Maillot,               selecting the edge detector parameters to achieve a good edge map
“Magnetic resonance angiography: from anatomical knowledge                    of the gray image,” J. Comput. Sci., vol. 5, pp. 355-362, 2009.
modeling to vessel segmentation,” Medical Image Analysis, pp.                 [13] J.Canny, “A computational approach to edge detection,” IEEE
259-274, 2006.                                                                Trans. Pattern Analysis and Machine Intelligence, vol. 8, pp.679-
[6] A. C. S. Chung, J, A. Noble, and P. Summers, “Vascular                    714, November 1986.
segmentation of phase contrast magnetic resonance angiograms based


© 2012 ACEEE                                                             39
DOI: 01.IJIT.02.02.107

Detection of Carotid Artery from Pre-Processed Magnetic Resonance Angiogram

  • 1.
    ACEEE Int. J.on Information Technology, Vol. 02, No. 02, April 2012 Detection of Carotid Artery from Pre-Processed Magnetic Resonance Angiogram Sarbani Datta1, Dr. Monisha Chakraborty*,1 1 Student, School of Bio-Science and Engineering, Jadavpur University, Kolkata, India Email: sarbanidatta.ju@gmail.com *,1 Assistant Professor, School of Bio-Science and Engineering, Jadavpur University, Kolkata, India Email: monishack@school.jdvu.ac.in *, 1 Corresponding Author Abstract—Boundary detection is playing an important role in narrowing of the carotid arteries [6, 7]. Our proposed algorithm the medical image analysis. In certain cases it becomes very significantly detects the carotid artery from the pre-processed difficult for the doctors to assess the carotid arteries from the magnetic resonance angiogram, which will assist the doctors magnetic resonance angiography (MRA) of the neck. In this to analyze the carotid arterial disease from the vasculature paper an attempt has been made to detect carotid arteries detected image without any difficulty. from the neck magnetic resonance angiograms, so as to overcome such difficulties. The algorithm pre-processes the magnetic resonance angiograms and subsequently detects the II. MATERIALS AND METHODS carotid artery. Stenosis is expected to reduce the diameter of A. PRE-PROCESSING TECHNIQUES the vessel. The diameter can be measured from the vasculature detected image. As the algorithm successfully detects the Histogram equalization is a spatial domain image carotid artery from the neck magnetic resonance angiograms, enhancement technique that modifies the distribution of the therefore it will help doctors for diagnosis and serve as a step pixels to become more evenly distributed over the available in the prevention of cardiovascular diseases. pixel range [8]. In histogram processing, a histogram displays the distribution of the pixel intensity values, mimicking the Index Terms—magnetic resonance angiogram, pre-processing, probability density function (PDF) for a continuous function. carotid artery detection, cardiovascular diseases, medical An image that has a uniform PDF will have pixel values at all image analysis valid intensities. Therefore, it will show a high contrast image. Histogram equalization creates a uniform PDF or histogram I. INTRODUCTION [9]. This can be accomplished by performing a global Magnetic resonance angiography (MRA) is a way to equalization that considers all the pixels in the entire image or study vascular structures through the use of a Gadolinium a local equalization that segments the image into regions. based contrast agent, Gd-DTPA [1, 3]. A patient is injected In case of the negative of an image, enhancement of white with contrast during scanning, and images are captured during or gray details in a dark background occurs [9]. A negative the arterial phase. Arteries appear bright on the image image is calculated using (1), whereas other structures without the contrast appear darker. (1) These images are used to diagnose the vasculature diseases Where P is the new pixel value, L is the number of new pixel such as stenosis [1, 2]. This technique has several advantages values and I is the original pixel intensity [8]. over conventional digital subtraction angiography (DSA). Subtraction images may also cause enhancement of The magnetic resonance angiograms of neck which is certain regions of an image. In contrast enhanced MRA, a acquired for detection and diagnosis of carotid arterial disease mask image is used and subtracted from a contrast enhanced is also called carotid artery stenosis. The term refers to the image to boost up the contrast [10]. narrowing of carotid arteries due to deposition of fatty substances and cholesterol. The stenosis or occlusion refers B. EDGE DETECTION to the blockage of the artery. When the carotid arteries are The edge detection process detects outline of an object obstructed, it leads to increased risk for a stroke [4]. A stroke and boundaries between objects and the background in the may occur if the artery becomes extremely narrowed or image. The edge-detection operation is performed by forming breakage of a piece of plaque and travels to the smaller arteries a matrix centered on a pixel chosen as the center of the matrix of the brain or even formation of clot which may block a area [11]. If the value of this matrix area is above a given narrowed artery. A stroke is similar to a heart attack, which threshold value, then the middle pixel is considered to be as occurs when the brain cells are devoid of oxygen and sugar an edge. Examples of gradient based edge detectors are Sobel carried to them by blood. If the lack of blood flow lasts for 3 and Prewitt operators. The gradient-based algorithms have to 6 hours, the damage is permanent [5]. There may be no kernel operators that calculate the strength of the slope in symptoms for carotid artery disease. directions which are orthogonal to each other, commonly A magnetic resonance angiography (MRA) of the neck vertical and horizontal. Later, the different components of inthe non-invasive mode is performed to identify the the slopes are combined to give the total value of the edge © 2012 ACEEE 35 DOI: 01.IJIT.02.02.107
  • 2.
    ACEEE Int. J.on Information Technology, Vol. 02, No. 02, April 2012 strength [8].The first-order derivative of an intensity, f(x, y), of an image is the gradient. The gradient is defined as the vector as shown in (2). In the mentioned formulation, the difference between the first and third rows of the 3x3 image region as show in Fig. 1 approximates the derivative in the x-direction, and the difference between the third and first columns approximates The magnitude of the vector is given in (3). the derivative in the y-direction [8, 11, 12]. The Prewitt masks as shown in Fig. 3 are used to implement Gx and Gy. The gradient vector, points in the direction of the maximum rate of change of the 2-D function f(x, y), of an image. The angle at which this maximum rate of change occurs is mathematically shown in (4). Figure3. Prewitt masks II1) CANNY OPERATOR The Canny edge detection algorithm is known as an optimal edge detector based on a set of criteria which include finding the most edges by minimizing the error rate, marking There are various approaches as mentioned in this section to edges as closely as possible to the actual edges to maximize determine the derivatives Gx and Gy digitally. The second- localization, and marking edges only once when a single edge order derivatives of the intensity, f(x, y), of an image are exists for minimal response [13]. computed using the Laplacian equation as given in (5). The first stage involves smoothing the image by convolving with a Gaussian filter. This is followed by computing the gradient of the image by feeding the smoothed image through a convolution operation with the derivative 1) SOBEL OPERATOR of the Gaussian in both the vertical and horizontal directions The Sobel operator performs a 2-D spatial gradient [8, 11]. measurement on an image. It is used to find the approximate absolute gradient magnitude at each point in an input grayscale image [12]. Fig. 1 shows the 3x3 area representing the gray levels of an image. The operator consists of a pair of 3×3 convolution masks as shown in Fig. 2. One mask is simply the other rotated by 90° [8, 11-12]. Figure4. Canny convolution masks 1V) LAPLACIAN OF GAUSSIAN OPERATOR The Laplacian of an image highlights regions of rapid intensity change and is therefore often used for edge Figure1. Image Neighborhood detection [8]. The Laplacian is applied to an image that has first been smoothed with Gaussian filter in order to reduce its sensitivity to noise. The operator takes a single gray level image as input and produces another gray level image as output. Figure2. Sobel convolution masks The detector uses the masks to compute the first order derivatives Gx and Gy, as shown in (6). Figure5. Laplacian of Gaussian kernels The kernels that are mentioned in Fig. 5 are used as discrete II) PREWITT OPERATOR approximations to the Laplacian filter [8, 12]. The 2-D LoG The Prewitt operator as similar to the Sobel measures two function centered on zero and with Gaussian standard components. The vertical edge component is calculated with deviation ó has the form as shown in (9). kernel Gx and the horizontal edge component is calculated with kernel Gy, as shown in (7). © 2012 ACEEE 36 DOI: 01.IJIT.02.02.107
  • 3.
    ACEEE Int. J.on Information Technology, Vol. 02, No. 02, April 2012 The block diagram of our developed algorithm is shown in A. PRE-PROCESSING Fig. 6. The input neck magnetic resonance angiograms are 1) TEST IMAGE 1 taken from the websites e.g. cedars-sinai.edu, sciencephoto.com, elsevierimages.com, springerimages.com, and imaging.consult.com. Figure 7(a). Original Image Figure 7(b). Histogram Equalized Figure 7(c). Subtracted Image Figure 7(d). ComplementedImage 2) TEST IMAGE 2 Figure 6. System Block Diagram The algorithm is developed on MATLAB version 7.6.0(R2008a) in Microsoft Windows XP operating system, with the processor 2.16GHz and 1.96GB of RAM Figure 8(a). Original Image Figure 8(b). Histogram Equalized III. RESULTS AND DISCUSSION Fifteen magnetic resonance angiograms of the neck are used to evaluate the proposed algorithm. Among them three angiograms are shown in Fig. 7(a), Fig. 8(a), and Fig. 9(a) respectively. Initially histogram equalization technique is performed, as shown in Fig. 7(b), Fig. 8(b), and Fig. 9(b) respectively. The original and the histogram equalized images are then converted to double precision images in order to perform the subtraction operation. Subtraction image is obtained by subtracting the original image from the histogram equalized image, as shown in Fig. Figure 8(c). Subtracted Image Figure 8(d). Complemented Image 7(c), Fig. 8(c), and Fig. 9(c) respectively. Finally, subtracted 3) TEST IMAGE 3 image is been complemented for vessel detection, as shown in Fig. 7(d), Fig. 8(d), and Fig. 9(d) respectively. Edge detec- tion operators e.g. Sobel, Prewitt, Canny and Laplacian of Gaussian are used to perform on the complemented image. Carotid artery detection for the test image 1 has been shown in Fig. 10(a), Fig. 10(b), Fig. 10(c) and, Fig. 10(d) respectively using the above mentioned edge detection operators. The developed algorithm automatically calculates the threshold for the images. Figure 9(a). Original Image Figure 9(b). Histogram Equalized © 2012 ACEEE 37 DOI: 01.IJIT.02.02.107
  • 4.
    ACEEE Int. J.on Information Technology, Vol. 02, No. 02, April 2012 Figure 9(c). Subtracted Image Figure 9(d). Complemented Image Histogram equalization takes advantage of the neglected pixel values and provides better definition and more information for the doctors. Complement of the subtracted images provided a better means to assess carotid arteries that were not as clear in the original magnetic resonance angiograms. The histogram equalization increased contrast and provided a better assessment of vasculature. Subtracted images Figure 10(c). Edge detection using Canny operator boosted up the result. B. CAROTID A RTERY DETECTION ON TEST IMAGE 1 Figure 10(d). Edge detection using Laplacian of Gaussian operator Figure 10(a). Edge detection using Sobel operator Edge detection algorithms are able to detect the carotid artery very well. The best algorithm among the Sobel, Prewitt, Canny and Laplacian of Gaussian is the Laplacian of Gaussian operator. This algorithm detects the carotid artery from the neck magnetic resonance angiograms prominently. CONCLUSION The developed method will help doctors to diagnose carotid arteries in a better way by reducing the subjectivity and miss rate in magnetic resonance angiograms of neck and thereby this will enhance the stenosis detection accuracy in less time. It has been found that the performance of Laplacian of Gaussian operator is the best amongst all other operators used in this work. Also, the pre-processing algorithm developed in this work has successfully detected the carotid arteries. Figure 10(b). Edge Detection using Prewitt operator © 2012 ACEEE 38 DOI: 01.IJIT.02.02.107
  • 5.
    ACEEE Int. J.on Information Technology, Vol. 02, No. 02, April 2012 REFERENCES on statistical mixture modeling and local phase coherence,” IEEE Transactions on Medical Imaging, vol. 23, no. 12, pp. 1490-1507, [1] T.K.Mittal, C.Evans, T.Perkins, and A.M.Wood, “Renal December 2004. arteriography using gadolinium enhanced 3D MR angiography- [7] J.S.Suri and S.Laxminarayan, Angiography and plaque imaging: clinical experience with the technique, its limitations and pitfalls”, advanced segmentation techniques, CRC Press, 2003. The British Journal of Radiology, pp.495-502, 2001. [8] R. C. Gonzalez and R. E. Woods, Digital Image Processing, [2] Y. Sun and D. Parker, “Small vessel enhancement in MRA images Prentice Hall, pp. 711-791, 2001. using local maximum mean processing,” IEEE Trans. on Image [9] Y.H.Hu, ECE 533 Image Processing Lecture Notes: Image Processing, vol. 10, pp. 1687-1699, 2001. Enhancement by Modifying Gray Scale of Individual Pixels, 2002- [3] A.A.Braidot, G.M.Peltzer, J.O.Romagnoli, A.J.Sattler, and 2003. C.E.Schira, “Pre-processing in three-dimensional magnetic resonance [10] M.Prince, T.M.Grist, and J.F.Debatin, 3D Contrast MR angiography (MRA) images,” Journal of Physics, 2007. Angiography, Springer-Verlag, NY, 1999. [4] P.Yan and A.A.Kassim, “MRA image segmentation with [11] E.Nadernejad, S.Sharifzadeh,, and H. Hassanpour, “Edge capillary active contour,” Proceedings of the International Conf. detection techniques: evaluation and comparisons,” Applied on Medical Image Computing and Computer Assisted Intervention, Mathematical Sciences, vol.2, pp. 1507-1520, 2008. vol. 1, pp. 51-58, 2005. [12] A.A. Moustafa and Z.A. Alqadi, “A practical approach of [5] N.Passat, C.Ronse, J.Baruthio, J.P.Armspach, and C.Maillot, selecting the edge detector parameters to achieve a good edge map “Magnetic resonance angiography: from anatomical knowledge of the gray image,” J. Comput. Sci., vol. 5, pp. 355-362, 2009. modeling to vessel segmentation,” Medical Image Analysis, pp. [13] J.Canny, “A computational approach to edge detection,” IEEE 259-274, 2006. Trans. Pattern Analysis and Machine Intelligence, vol. 8, pp.679- [6] A. C. S. Chung, J, A. Noble, and P. Summers, “Vascular 714, November 1986. segmentation of phase contrast magnetic resonance angiograms based © 2012 ACEEE 39 DOI: 01.IJIT.02.02.107