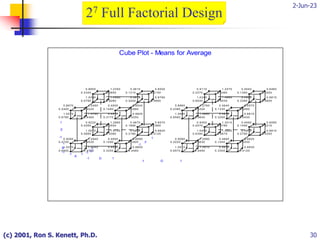
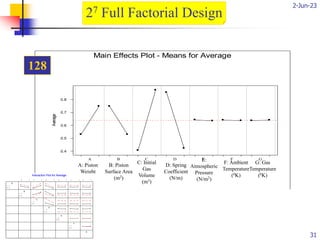
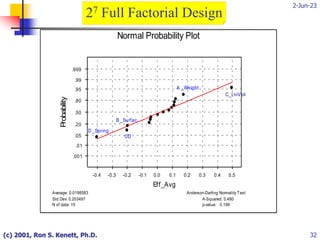
This document provides an overview of design of experiments (DOE). It discusses key concepts like factors, responses, experimental design, and the four basic steps of DOE: plan, collect, analyze, and present. Examples are given to illustrate different types of experimental designs like full factorial designs, fractional factorial designs, and split lot designs. The document also discusses how to identify important factors, characterize relationships, and optimize responses through experimentation.


![2-Jun-23
(c) 2001, Ron S. Kenett, Ph.D. 48
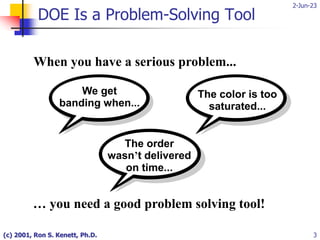
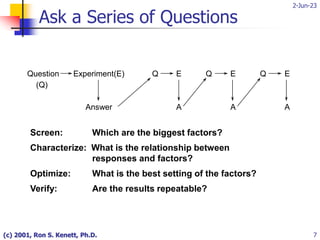
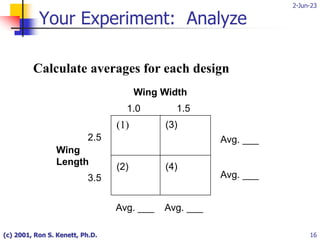
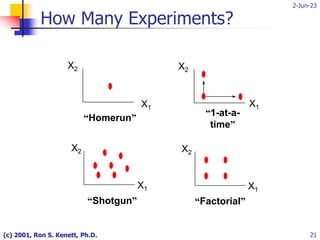
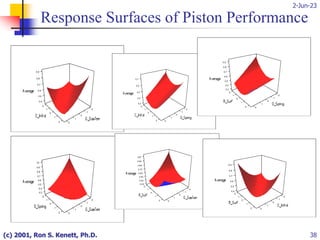
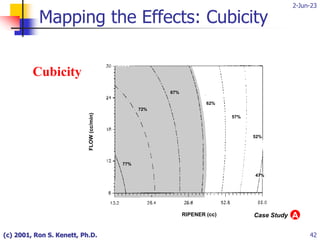
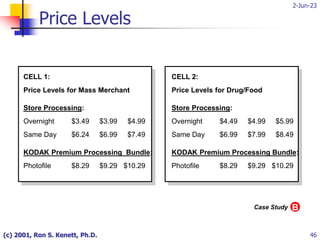
Results: Mass Merchant
57%
63%
63%
34%
23%
26%
10% 10% 14%
0%
20%
40%
60%
80%
100%
$8.29 $9.29 $10.29
Price of KPP
Next Day KPP Same Day
B
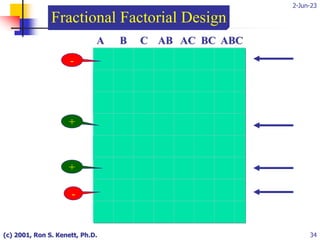
Case Study
Cell 1 - Mass Merchant
(Same Day =$6.99 [median] and Next Day = $3.99 [median])](https://image.slidesharecdn.com/designofexperiments-230602070500-f9289c7b/85/Design_of_Experiments-ppt-48-320.jpg)
![2-Jun-23
(c) 2001, Ron S. Kenett, Ph.D. 49
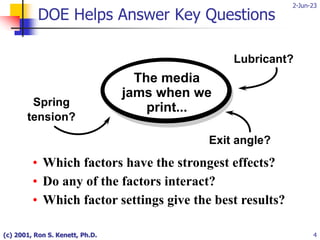
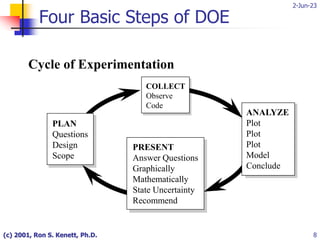
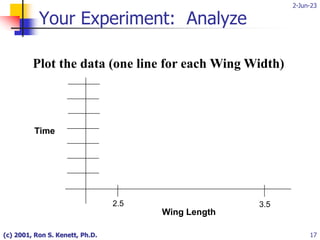
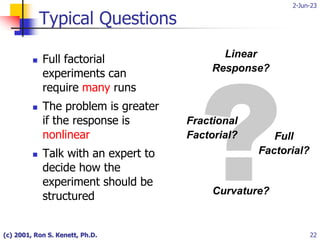
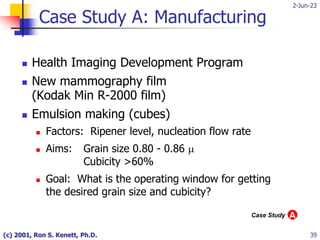
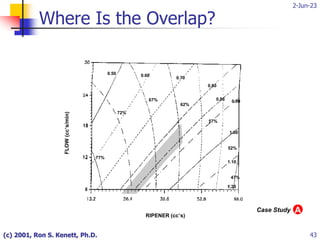
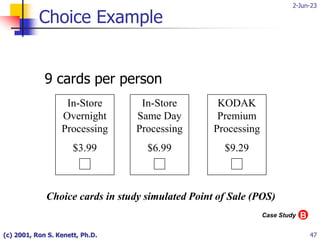
Cell 2 - Drug/Food
(Same Day =$7.99 [median] and Next Day = $4.99 [median])
Results: Drug/Food
58%
67%
60%
35%
22%
26%
7%
14% 11%
0%
20%
40%
60%
80%
100%
$8.29 $9.29 $10.29
Price of KODAK Premium Processing
Next Day KODAK Premium Processing Same Day
B
Case Study](https://image.slidesharecdn.com/designofexperiments-230602070500-f9289c7b/85/Design_of_Experiments-ppt-49-320.jpg)
![2-Jun-23
(c) 2001, Ron S. Kenett, Ph.D. 50
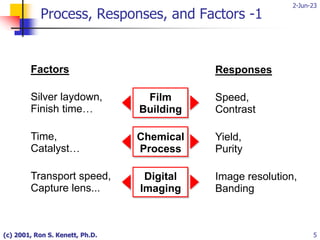
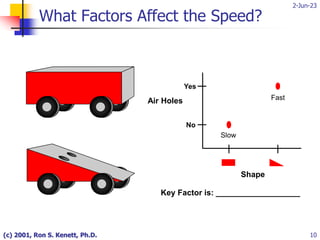
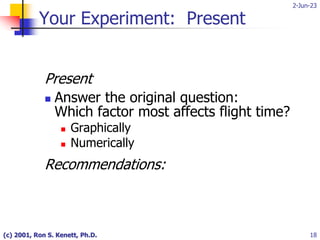
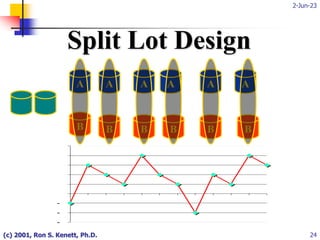
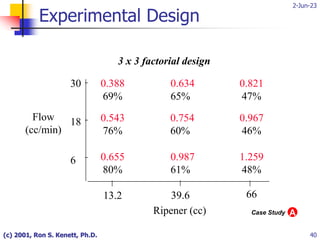
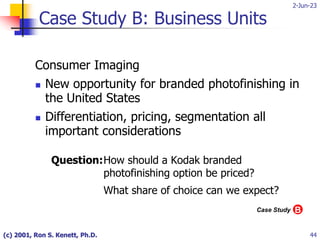
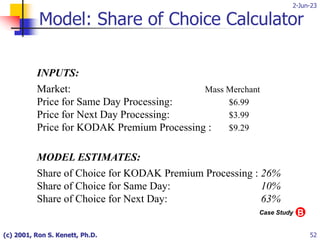
Cell 1 - Mass Merchant
(Same Day =$6.24 [low] and Next Day = $3.49 [low])
Results: Mass Merchant
58%
63%
64%
29%
19%
22%
13% 14% 18%
0%
20%
40%
60%
80%
100%
$8.29 $9.29 $10.29
Price of KODAK Premium Processing
Next Day KODAK Premium Processing
Same Day
B
Case Study](https://image.slidesharecdn.com/designofexperiments-230602070500-f9289c7b/85/Design_of_Experiments-ppt-50-320.jpg)
![2-Jun-23
(c) 2001, Ron S. Kenett, Ph.D. 51
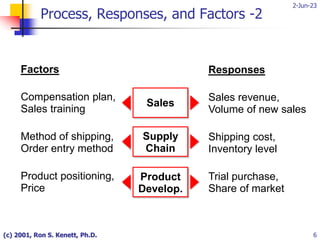
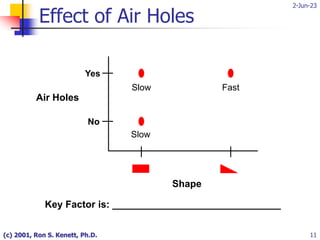
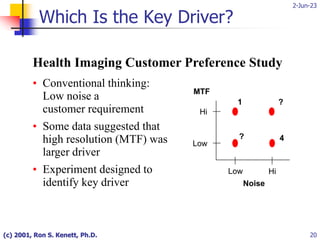
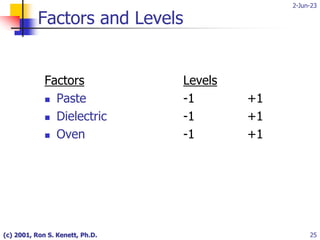
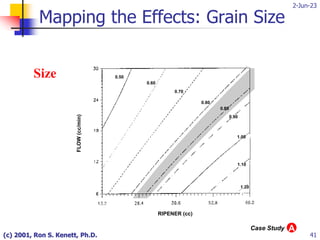
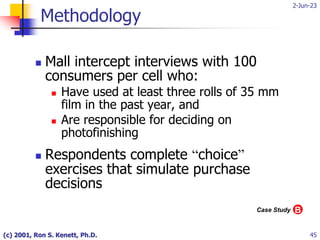
Cell 2 - Drug/Food
(Same Day =$6.99 [low] and Next Day = $4.49 [low])
Results: Drug/Food
61%
69%
62%
31%
19%
22%
8%
16% 13%
0%
20%
40%
60%
80%
100%
$8.29 $9.29 $10.29
Price of KODAK Premium Processing
Next Day KODAK Premium Processing
Same Day
B
Case Study](https://image.slidesharecdn.com/designofexperiments-230602070500-f9289c7b/85/Design_of_Experiments-ppt-51-320.jpg)


![PERI-PROSTHETIC FRACTURE NAIL-PLATE CONSTRUCT [NPC].pptx](https://cdn.slidesharecdn.com/ss_thumbnails/drarunkumardrmohamedashrafperiprostheticfrasturenail-plateconstructnpc-260209164459-7e9d15a1-thumbnail.jpg?width=640&height=640&fit=bounds)


