Download to read offline

![Design and Implementation of High Resolution Data Acquisition System
(IJSRD/Vol. 1/Issue 7/2013/0011)
All rights reserved by www.ijsrd.com 1418
Vin Iin VSUP COM
Measured
Data
Output
CHANNEL
0
1 2 17 18
AC
Voltage(V)
0-20
mA
CHANNEL
1
3 4 19 20
AC
Current(A)
0-20
mA
CHANNEL
2
5 6 21 22
DC Voltage
(V)
0-5 V
CHANNEL
3
7 8 23 24
DC Current
(A)
0-5 V
CHANNEL
4
9 10 25 26 Flow Rate 0-10 V
CHANNEL
5
11 12 27 28
Thermo
couple (F)
0-10V
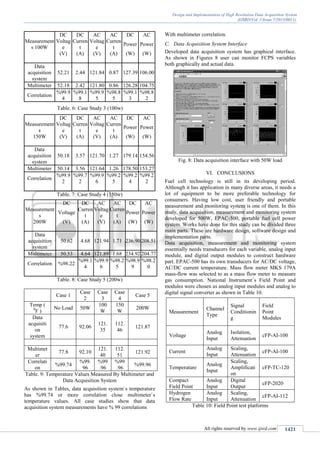
Table. 1: Demonstration of DAQ system channels
Fig. 2: EPAC-500 hydrogen fuel cell power system
application. In LabVIEW, a user interface can be built by
using a set of tools and objects
After making sure that whole system parameters work
successfully, an experimental procedure on the system is
done. The following procedure is outlined for the test–set
system. The photograph of the overall hydrogen fuel cell
data acquisition system is depicted in Figure 2.
DATA ACQUISITION SYSTEMII.
The analog and continuous time signals measured by the
transducers must be converted into the form that a computer
can understand. This is what is referred to as data
acquisition as shown in Figure 3. Conventionally,
measurements are done by various types of stand-alone
instruments like oscilloscopes, digital and analog multi
meters, counters etc. However, the necessity to save the
measurements and process the gathered data for
visualization has become very important for reliable and
efficient fuel cell power station (FCPS) operations.
Fig. 3: Data acquisition system
A. Number of Input channels
The Field Point gives out 8 channel of information. So a
data acquisition (DAQ) board with 6 input channels was
selected. Channels start from 0 to 5. Table 1 shows
measured data and other characteristics of data for each
channel.
And corresponding data information used in the FCPS data
acquisition
B. Hardware Selection
Data acquisition cards that can be connected to PC-
computer provide cost-effective high-speed multi-channel
analogue inputs. The Compact Field Point is suitable for
measuring voltages in ranges ±0.05V to ±42V. The
sampling rate is 1.25Ms/channel with a 16-bit resolution.
C. MKS 179A Mass-Flo Type Mass Flow Meter
The MKS Instruments 179A Mass-Flo® All-Metal Mass
Flow Meter (MFM) as seen in Figure 4 is a mass flow meter
(MFM) designed to measure the flow of gases in a wide
variety of applications.
SOFTWARE DESINGIII.
The DAQ hardware without appropriate software is of little
use. The purpose of having appropriate software is the
following:
1. Acquire Monitoring and simultaneously processing
data in real time.
2. Controlling the test
3. Generating reports in variety of graphical formats
4. Stream data to and from storage device.
5. Use various functions of a DAQ board from a
single user interface
6. Real Time Display
A. Software Tools under consideration.
1 Microsoft’s Visual C++ environment
2 Matlab
3 Nation Instruments LabVIEW
The advantages and disadvantages of which are listed in
Table 2
Comparison
Characteristic
Matlab® VC++ LabVIEW
Hardware
Support
Needs Third
Party
Drivers
Interface
libraries
provided
Direct
Support
Speed
Slower than
VC++ but
faster than
LabVIEW
Fastest Slowest
User
Interface
Easy, Drag
and Drop
Very
Complicated
Easy, Drag
and
Drop
Modular
Programming
Possible, with
little
Tweaking
Possible,
with
little
tweaking
Easiest
Learning
Curve
Slow Slow Fast
Table 2. Comparison of various software design
environments
NI LabVIEW, short for Laboratory Virtual Instrument
Engineering Workbench, is a programming environment.
National Instruments LabVIEW is a graphical programming
language that has been widely adopted throughout industry,
academia, and research labs as the standard for data
acquisition and instrument control software [1]. LabVIEW
departs from the sequential nature of traditional
programming languages and features an easy –to-use
graphical programming environment, including all of the
tools necessary for data acquisition (DAQ), data analysis,](https://image.slidesharecdn.com/ijsrdv1i7011-140806061420-phpapp02/85/Design-and-Implementation-of-High-Resolution-Data-Acquisition-System-2-320.jpg)
![Design and Implementation of High Resolution Data Acquisition System
(IJSRD/Vol. 1/Issue 7/2013/0011)
All rights reserved by www.ijsrd.com 1419
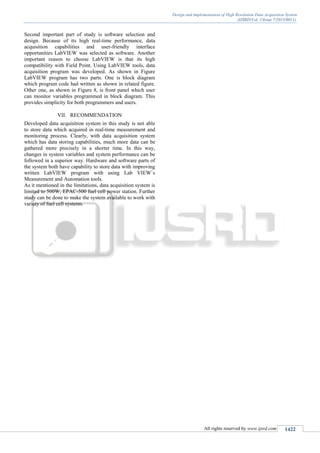
and presentation of results [2]. The LabVIEW data logging
and supervisory control module from NI meet the needs of
fuel cell researchers with its built-in high-channel-count data
acquisition, data logging, interface, and security capabilities
[3]. Fuel cell test systems may require many data acquisition
sensors and controls for temperature, humidity, atmospheric
pressure, oxygen, and other parameters. Figure 5 and 6
depict the interface and the automation software block
diagram of the LabVIEW respectively. NI Field Point
measurement and automation explore software to collect
data from channels in the DAQ board of the FCPS. The NI
data acquisition modules are placed between computer and
fuel cell system to convert analog input to digital output for
the field point measurement. NI measurement and
automation software recognizes channels of the data
acquisition models such as voltage, current, temperature,
and mass gas flow.
OVERALL SYSTEM FUNCTIONAL DIAGRAMIV.
H2 PEM fuel cell stacks are fed by hydrogen (H2) metal
hydride storage container as shown Figure 7. H2 inlet has a
pressure regulator installed in the container. This regulator
adjusts the incoming hydrogen pressure. Between fuel cell
stacks and H2 inlet there is a H2 mass flow meter. An
External power supply provides electricity to the flow meter
at 15 V voltage range. Mass flow meter obtains analog data
about gas consumption and transmits data to the AC/DC
analog module (cFPAI-100). The Oxygen (O2) amount
required for fuel cell system is provided directly from air.
For this purpose, the system has 3-6 psi DC air pump as
seen in Figure. The fuel cell stack is equipped with a low
pressure particulate filter on the reactant air inlet to prevent
airborne materials and contaminants from entering the stack.
Hydrogen fuel cell system shown Figure 7 has three outlets.
These are H2 O outlet, H2 outlet, and purge outlet. H2O
outlet drains water vapor which is formed from chemical
reaction between H2 and O2. H2 outlet ventilates over-
pressed gas.
Fig. 5: Fuel cell data acquisition system LabVIEW interface
There is a H2 recirculation system between H2 outlet and
H2 inlet which gathers unused H2 and conveys to the fuel
cell stacks. As the hydrogen is used within the fuel cell,
water and other contamination build up until they block the
hydrogen flow to the stack. Periodically a solenoid valve is
opened to allow the water and any contaminations to be
purged from the fuel cell stack by purge outlet. The fuel cell
system is equipped with cooling fans. The operation of fuel
cell generates heat. If this heat is not removed, the operation
of the stack may will become inefficient and leading the
overall system to halt.
Fig.6 Fuel Cell data acquisition system LabVIEW block
diagram
Fig.7 Hydrogen fuel cell system functional block diagram](https://image.slidesharecdn.com/ijsrdv1i7011-140806061420-phpapp02/85/Design-and-Implementation-of-High-Resolution-Data-Acquisition-System-3-320.jpg)
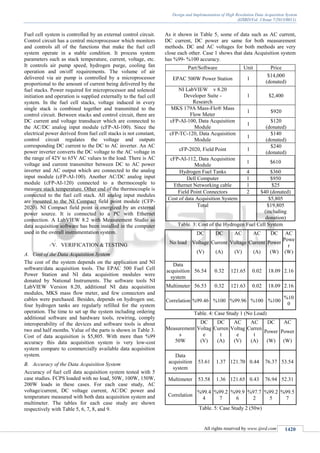

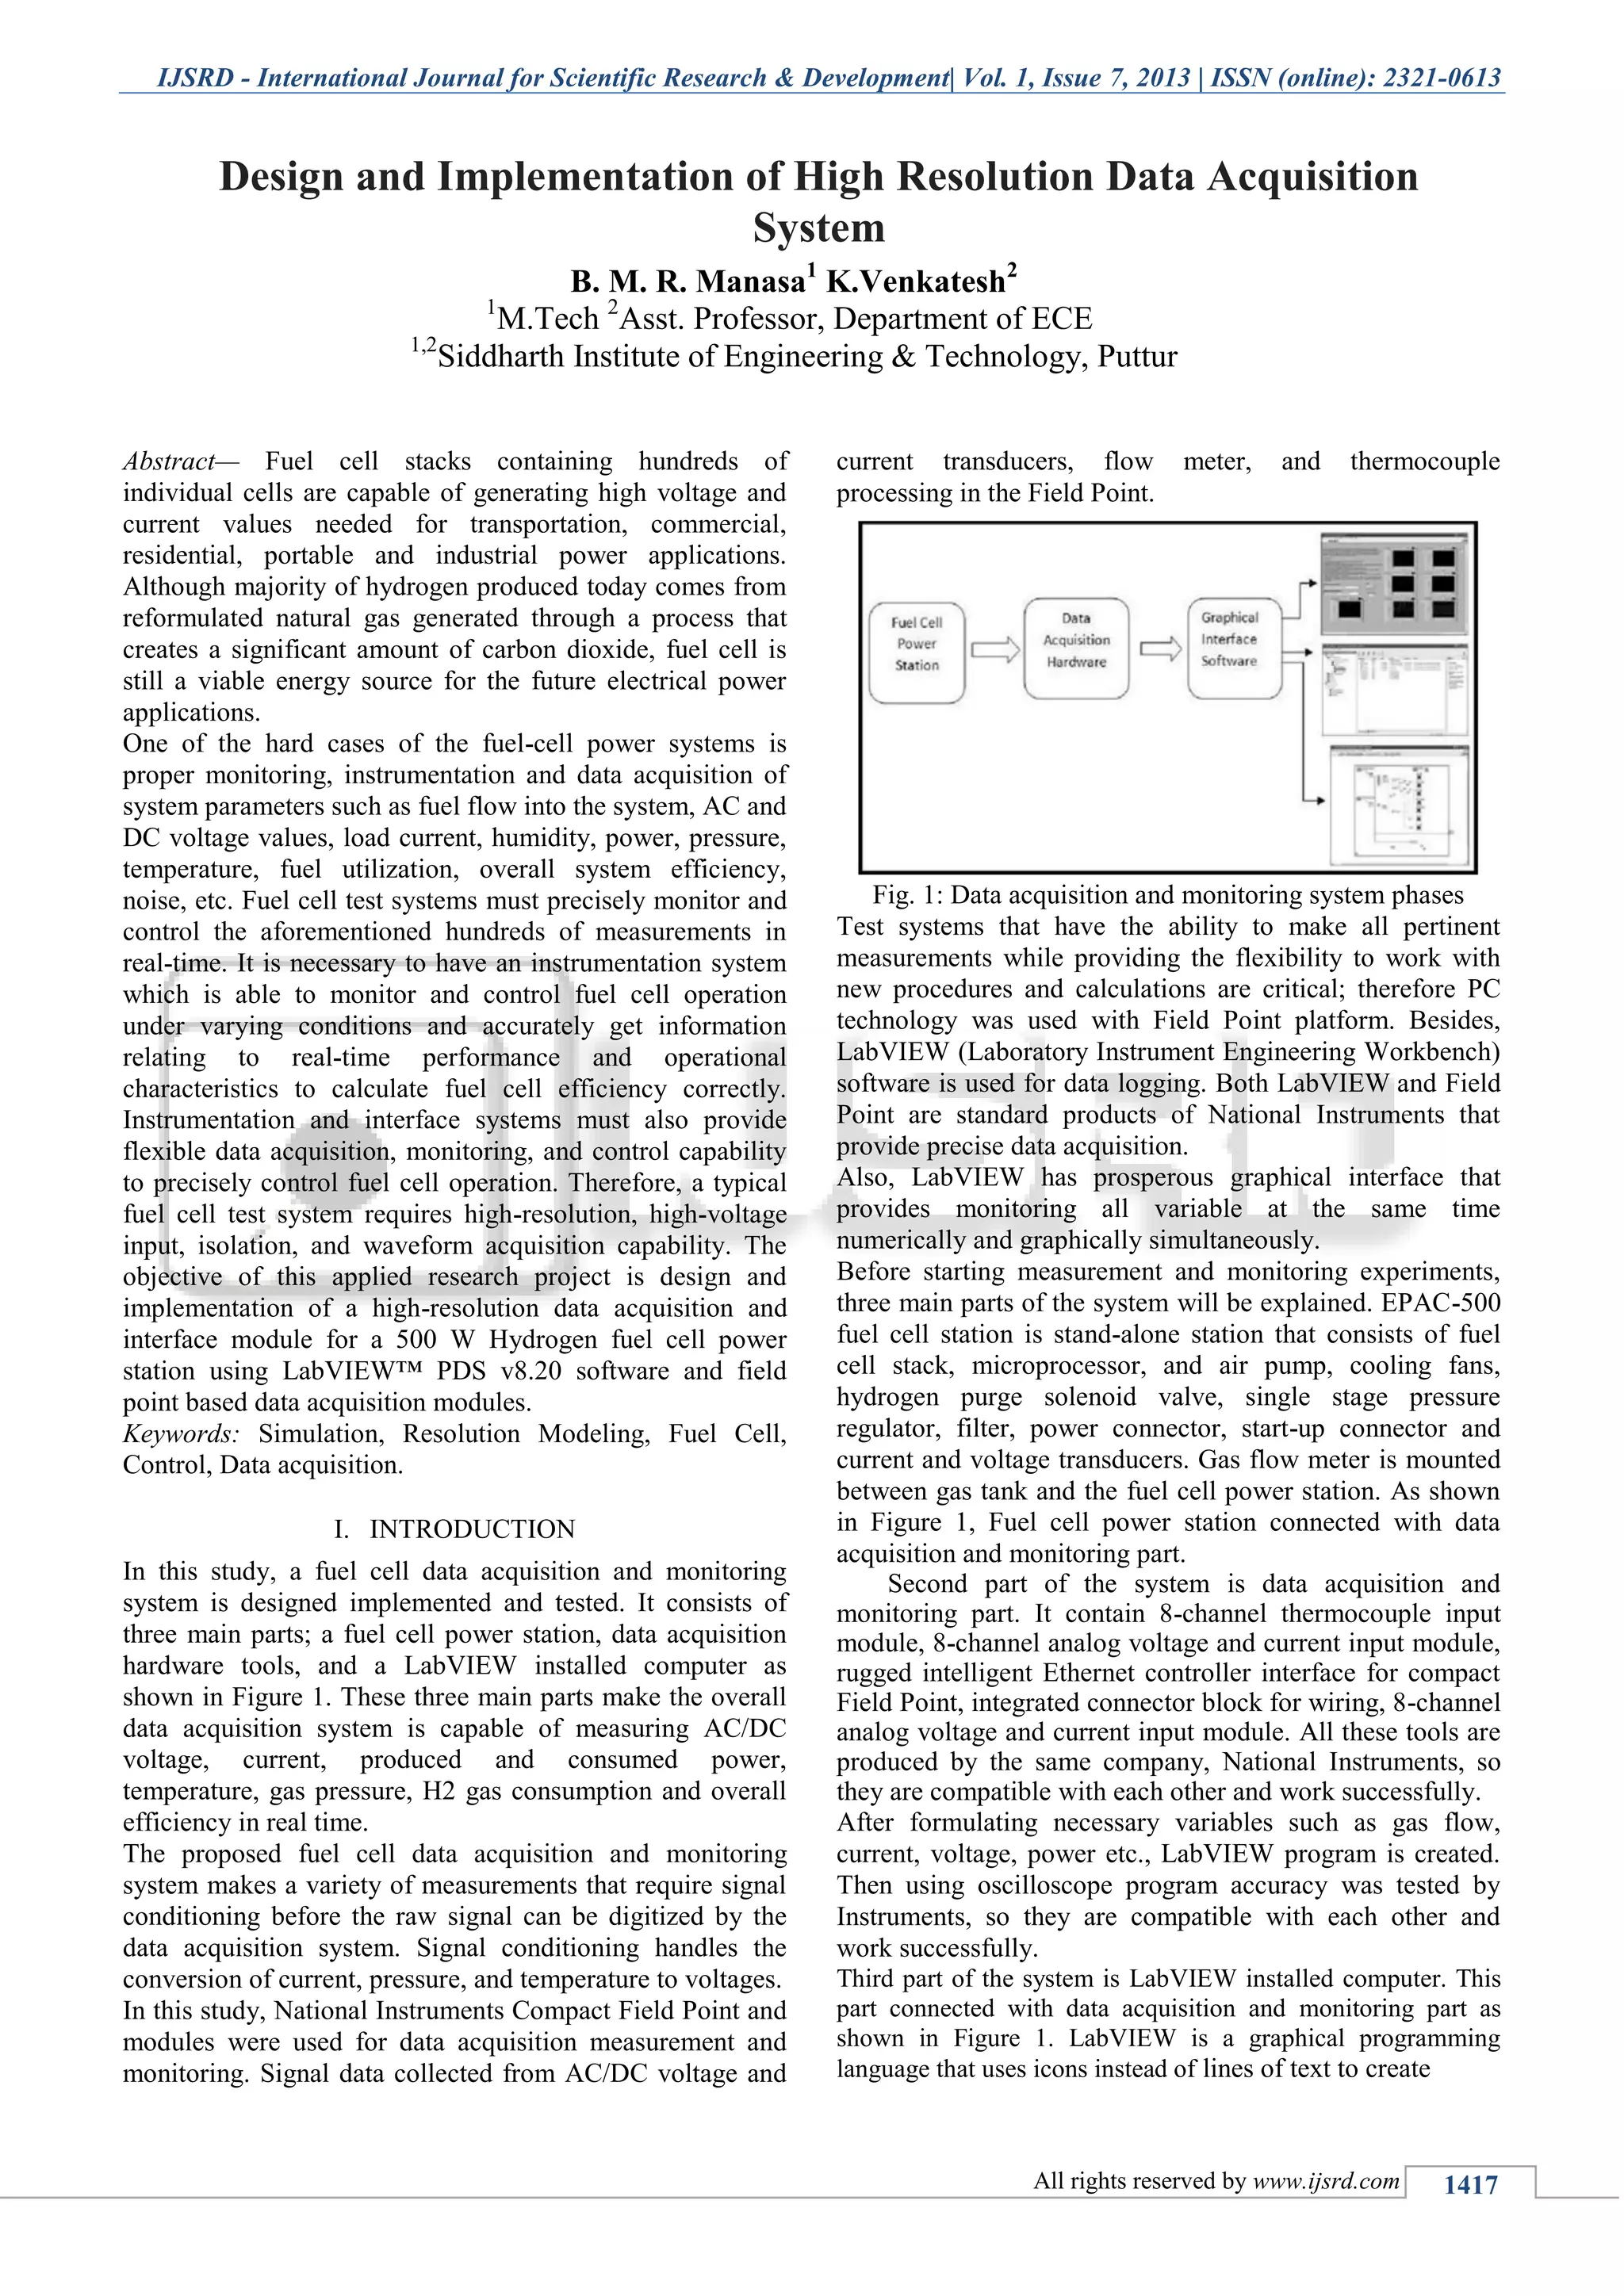
The document details the design and implementation of a high-resolution data acquisition and monitoring system for a 500W hydrogen fuel cell power station using LabVIEW software and National Instruments hardware. It outlines the system components, including fuel cell stacks, data acquisition modules, and signal conditioning processes necessary for real-time monitoring of various operational parameters. Accuracy tests show that the data acquisition system achieves over 99% accuracy compared to traditional measurement methods.