SlideShare a Scribd company logo
DERİNER DAM GEOMETRY SOFTWARE by TANER ÇİĞDEM
Deriner dam is the 3rd biggest arch dam in the world according to its height and excavation quantity (by year 2001)
Maximum flood water level 395.00 m
Maximum operation water level 392.00 m
Minimum operation water level 347.83 m
Thalweg level 195.00 m
Type of dam Double curvature arch dam
Crest level 397.00 m
Height from thalweg 202.00 m
Height from foundation 253.00 m
Crest length 706.00 m
Crest width 12.00 – 21.00 m
Concrete volume 3.50 hm3
Type of Powerhouse Underground
Number of turbines 4
Installed capacity 670.00 MW
Total energy 2 117 75 GWH
GEOMETRICAL DEFINITION OF THE FINAL OPTIMISED DAM DESIGN
DAM AXIS LOCATION
The dam geometry is defined with respect to (w.r.t.) a local co-ordinate system (U, V), where U is positive in the upstream – downstream direction and V is
positive in the left – right bank cross-valley direction. These co-ordinates may be transformed to a global (Y, X) system that is equivalent to the country co-
ordinate system (N, E).
The origin of the local co-ordinate system has the following local and global co-ordinates:
UO = 0.0000; YO = 4559061.9870
VO = 0.0000; XO = 488293.7154
Where subscript "o" represents "Origin".
The orientation of the dam within the valley is defined by the global azimuth Az (grad) where:
Az = 369.44444g
The global azimuth is measured w.r.t. the global N or Y axis in a clockwise direction to the local U axis.
A key point in the geometrical definition of the dam is the point P, which defines the intersection of the crest elevation arch and the crown cantilever section.
The co-ordinates of this point are given by:
UP = 200.0000; YP = 4559701.1378
VP = 1000.0000; XP = 489088.3765
Where subscript "p" represents the "Dam Reference Point" P.
LOCAL – GLOBAL TRANSFORMATION SYSTEM
All co-ordinates can be described in both the local and global co-ordinate systems (N, E) using the following transformation equations:
Local to Global
Y = YO + U cos (Az) – V sin (Az) (2.1)
X = XO + U sin (Az) + V cos (Az) (2.2)
Global to Local
U = (YO – Y) cos (Az) + (XO – X) sin (Az) (2.3)
V = -(YO – Y) sin (Az) + (XO – X) cos (Az) (2.4)
DAM GEOMETRY
The dam geometry is split into two main parts. The first defines the main dam arches without thickening using horizontal parabolas and the second defines
abutment thickening using horizontal side parabolas.
DEFINITION OF MAIN SECTIONS USING PARABOLAS
The definition of the dam geometry involves firstly defining an appropriate crown cantilever section, which in turn defines thickening and mid-surface curves
as presented in figure 1. In the case where abutment thickening is not required, both the upstream and downstream faces of the dam are defined using
simple parabolic formulas. The parabola parameters Pi, (i = 1 (upstream face), i = 2 (downstream face)), which are based on the definition of the main axis
line Uo, vary over the height of the dam as indicates in figure 1.
The following notation is used:
U0 = Local U co-ordinate of the centre of curvature of the main parabola.
U1 = Local U co-ordinate of the apex of the upstream parabola.
U2 = Local U co-ordinate of the apex of the downstream parabola.
P1 = Main upstream parabola parameter.
P2 = Main downstream parabola parameter.
t = dam thickness.
k = dam mid-surface axis at the main section.
z = height (elevation (m.a.s.l.) – 146 (m.a.s.l.).)
Figure 1. Definition of Main Parabolas and Crown Cantilever Section
DEFINITION OF ABUTMENT THICKENING USING SIDE PARABOLAS
Abutment thickening is added to the main downstream parabolas using side parabolas. The objective is to define a side parabola, which is tangent to the
main parabola and gives a uniform increase in abutment thickening over the entire height of the dam. Figure 2 presents the basic concept of the side
parabolas along with the notation used in geometrical equations. The following notation applies in figure 2:
C0 (U0, V0) = Co-ordinate of the centre of the circle of curvature of the main parabola.
CR (UCR, VCR)= Co-ordinate of the centre of the circle of curvature of the right bank side parabola.
CL (UCL, VCL)= Co-ordinate of the centre of the circle of curvature of the left bank side parabola.
TR (UTR, VTR)= Co-ordinate of the point of contact between the main downstream parabola and the right bank side parabola.
TL (UTL, VTL)= Co-ordinate of the point of contact between the main downstream parabola and the left bank side parabola.
PL = Left bank side parabola parameter. PL = (UCL – U3)
PR = Left bank side parabola parameter. PR = (UCR – U4)
Figure 2. Definition of Side Parabolas for Abutment Thickening
OVERVIEW OF THE SOFTWARE
The geometry of the dam is defined between el. 146 and 397 and the concreting lifts are as follows:
- 146 - 147
- Intermediate lifts every 3 m from 147 to 393.
- 393 - 395
- 395 - 397
The program has 4 sections:
1. Horizontal
2. Vertical
3. Block
4. Formwork
General Notes:
 Before using any section, the user should decide which coordinate system to use. It is done by the "Dam Locals" and "Global" option buttons. And right of
the "Global" option is the "Zoom Method" box, which is used for defining the zoom method when the user presses the "Zoom" button.
 When the user uses "Block" or "Formwork" sections the program draws the geometry and in the mean time it makes all necessary calculations for the
dam, the user can then save this data to an Excel File by pressing the "Save" button.
 Anytime the user wants to erase the objects in AutoCAD, can press the "Erase" button.
 After using the program the user can apply standard AutoCAD commands to the drawings, like changing the views, 3D orbiting, rotating, …
1. Horizontal
This section is intended for producing horizontal sections. Figure 3 shows a typical section for a given elevation, the parabola is formed by given
"Number of Points". After producing the cross section the user can press the datum button to indicate the centre, tangent and apex points of the parabolas.
"Draw 3 More Joints" checkbox is for the decision stage of the dam blocks for each elevation.
Figure 3. Typical horizontal section
2. Vertical
This section is intended for producing vertical sections. Figure 4 shows a typical plane section for a given joint. Joint numbers are between 1 and 40 from
left to right. If the user wants a 3D vertical section, he can check the "Draw 3D" checkbox. Figure 5 shows all the vertical cross sections of the dam in a 3D
view.
Figure 4. Plane vertical section of joint 21
Figure 5. 3D vertical sections of all joints
3. Block
This section is intended for drawing near theoretical blocks, finding the areas of each sides of the blocks, the corner and origin coordinates and the
concrete volumes of the blocks. If both "All Elevations" and "All Blocks" boxes are unchecked, the user has to define the "Lower Elevation" and "Block No"
textboxes. The program finds the upper elevation of the block according to the concreting lifts mentioned above. And this will draw a specific bay for the given
data (Figure 6). "All Elevations" option is for drawing a specific block in all elevations from the excavation surface to the crest elevation (Figure 7). "All Blocks"
option is for drawing all blocks for a given elevation (Figure 8). If both of these boxes are checked the program will draw all dam (Figure 9). "Last elevation"
textbox is for restricting the stop elevation in whole-drawing options, "Lower Elevation" textbox can also affect the start elevation in whole-drawings. "No of
Points" defines the vertex number of both upstream and downstream parabolas, higher values approach to the theoretical parabola.
Figure 6.
Figure 7.
Figure 8.
Figure 9.
4. Formwork
This section works like the "Block" section. The difference is, "Block" section draws the parabolas by dividing them into fac e divisions by the given "No of
Points" and the "Formwork" section works based on the given "Form Length" in meters. This section draws the formworks from left to right for blocks >= 21
and from right to left for the others. Its working structure is to find the intersection points of the formworks with the parabolas and to cross to the other corner
of the block by placing each formwork like that. The "All Elevations" and the "All Blocks" checkboxes work the same as "Block" section. And if the user wants
to draw all formworks, he can check the "Draw Formworks" checkbox (Figure 10), then the user can easily "Shade" and "Render" the drawings in AutoCAD.
The "Max" notation shows the maximum openings of the formworks from the parabolas for each face and elevation for that bay. The user can restrict the
maximum opening by entering in the "Tolerance" textbox in "cm". When the program finds a face exceeding this value it draws the same bay with the given
"Alternative Form Length" and of a different colour. The program is now adjusted to use "Alternative Form Length" in bays where parabolas are tangent, the
others are eliminated. The user should check the Excel File to see if there still exist some bays exceeding the "Tolerance" value, if so he has to change the
standard form lengths by trying. This is useful for finding the optimal form length of the dam. If the user wants to see the parabolas and the formworks
together he can leave the "Erase Parabolas" checkbox unchecked. The save data includes all faces form lengths, maximum openings, block areas and real
concrete volumes.
Figure 10.
Formworks
Maximum Openings
Figure 11. A rendered view of the dam from downstream
This software was initially designed as standard executable and was connecting to the AutoCAD by Automation, and has been converted to AutoCAD macro
for better and faster performance.
Output:
Deriner Arch Dam Geometry Solution with a software developed by Taner Cigdem

More Related Content

What's hot

Ring Spinning - flexible shaft couplings for energy management - POLAND 2016
Ring Spinning - flexible shaft couplings for energy management - POLAND 2016Ring Spinning - flexible shaft couplings for energy management - POLAND 2016
Ring Spinning - flexible shaft couplings for energy management - POLAND 2016
Debashish Banerjee
 
4. static and_dynamic_analysis.full
4. static and_dynamic_analysis.full4. static and_dynamic_analysis.full
4. static and_dynamic_analysis.full
Vivek Fegade
 
Mechanism Design and Kinematics Analysis of Display Bracket Based on Adams
Mechanism Design and Kinematics Analysis of Display Bracket Based on AdamsMechanism Design and Kinematics Analysis of Display Bracket Based on Adams
Mechanism Design and Kinematics Analysis of Display Bracket Based on Adams
IJRESJOURNAL
 

What's hot (20)

Numerical Solution for the Design of a Ducted Axisymmetric Nozzle using Metho...
Numerical Solution for the Design of a Ducted Axisymmetric Nozzle using Metho...Numerical Solution for the Design of a Ducted Axisymmetric Nozzle using Metho...
Numerical Solution for the Design of a Ducted Axisymmetric Nozzle using Metho...
 
Ijmet 06 07_004
Ijmet 06 07_004Ijmet 06 07_004
Ijmet 06 07_004
 
Ring Spinning - flexible shaft couplings for energy management - POLAND 2016
Ring Spinning - flexible shaft couplings for energy management - POLAND 2016Ring Spinning - flexible shaft couplings for energy management - POLAND 2016
Ring Spinning - flexible shaft couplings for energy management - POLAND 2016
 
Ch 4
Ch 4Ch 4
Ch 4
 
Microsoft word paper.op
Microsoft word   paper.opMicrosoft word   paper.op
Microsoft word paper.op
 
Datum systems-DFMA- in precision engg
Datum systems-DFMA- in precision enggDatum systems-DFMA- in precision engg
Datum systems-DFMA- in precision engg
 
Effect of angle
Effect of angleEffect of angle
Effect of angle
 
Frank smith final presentation
Frank smith final presentationFrank smith final presentation
Frank smith final presentation
 
Advanced mathematical analysis of chassis integrated platform designed for un...
Advanced mathematical analysis of chassis integrated platform designed for un...Advanced mathematical analysis of chassis integrated platform designed for un...
Advanced mathematical analysis of chassis integrated platform designed for un...
 
A Fast and Economical Method to Measure Force Distribution over Radial Tires ...
A Fast and Economical Method to Measure Force Distribution over Radial Tires ...A Fast and Economical Method to Measure Force Distribution over Radial Tires ...
A Fast and Economical Method to Measure Force Distribution over Radial Tires ...
 
Wall Station Surveys
Wall Station SurveysWall Station Surveys
Wall Station Surveys
 
3 d
3 d3 d
3 d
 
3-D Sight Distance Assessment in Road Design
3-D Sight Distance Assessment in Road Design3-D Sight Distance Assessment in Road Design
3-D Sight Distance Assessment in Road Design
 
Performance prediction of a turboshaft engine by using of one dimensional ana...
Performance prediction of a turboshaft engine by using of one dimensional ana...Performance prediction of a turboshaft engine by using of one dimensional ana...
Performance prediction of a turboshaft engine by using of one dimensional ana...
 
4. static and_dynamic_analysis.full
4. static and_dynamic_analysis.full4. static and_dynamic_analysis.full
4. static and_dynamic_analysis.full
 
Atmospheric turbulent layer simulation for cfd unsteady inlet conditions
Atmospheric turbulent layer simulation for cfd unsteady inlet conditionsAtmospheric turbulent layer simulation for cfd unsteady inlet conditions
Atmospheric turbulent layer simulation for cfd unsteady inlet conditions
 
KOBA Step Gage, Artifact
KOBA Step Gage, ArtifactKOBA Step Gage, Artifact
KOBA Step Gage, Artifact
 
CAE_s1233587
CAE_s1233587CAE_s1233587
CAE_s1233587
 
Mechanism Design and Kinematics Analysis of Display Bracket Based on Adams
Mechanism Design and Kinematics Analysis of Display Bracket Based on AdamsMechanism Design and Kinematics Analysis of Display Bracket Based on Adams
Mechanism Design and Kinematics Analysis of Display Bracket Based on Adams
 
Fe investigation of semi circular curved beam subjected to out-of-plane load
Fe investigation of semi circular curved beam subjected to out-of-plane loadFe investigation of semi circular curved beam subjected to out-of-plane load
Fe investigation of semi circular curved beam subjected to out-of-plane load
 

Similar to Deriner Arch Dam Geometry Solution with a software developed by Taner Cigdem

Research Article - Automation of an excavator boom movement in 3D
Research Article - Automation of an excavator boom movement in 3DResearch Article - Automation of an excavator boom movement in 3D
Research Article - Automation of an excavator boom movement in 3D
Van Tien Nguyen
 
Stress Analysis Project 01
Stress Analysis Project 01Stress Analysis Project 01
Stress Analysis Project 01
Franco Pezza
 
Aircraft Loads 5 Report
Aircraft Loads 5 ReportAircraft Loads 5 Report
Aircraft Loads 5 Report
Lee Ramsay
 
finalreportedit.docx
finalreportedit.docxfinalreportedit.docx
finalreportedit.docx
ChenXi Liu
 
Open Pit Design Analysis
Open Pit Design AnalysisOpen Pit Design Analysis
Open Pit Design Analysis
James Dunford
 
Matrices and row operations 12123 and applications of matrices
Matrices and row operations 12123 and applications of matricesMatrices and row operations 12123 and applications of matrices
Matrices and row operations 12123 and applications of matrices
mayaGER
 
1 P a g e 2105 ENG, Mechanics of.docx
1  P a g e   2105 ENG, Mechanics of.docx1  P a g e   2105 ENG, Mechanics of.docx
1 P a g e 2105 ENG, Mechanics of.docx
honey725342
 
ES3323 - Project 2 Report - Reverse Engineering a Gear Shaft
ES3323 - Project 2 Report - Reverse Engineering a Gear ShaftES3323 - Project 2 Report - Reverse Engineering a Gear Shaft
ES3323 - Project 2 Report - Reverse Engineering a Gear Shaft
Constantine Christelis
 

Similar to Deriner Arch Dam Geometry Solution with a software developed by Taner Cigdem (20)

Research Article - Automation of an excavator boom movement in 3D
Research Article - Automation of an excavator boom movement in 3DResearch Article - Automation of an excavator boom movement in 3D
Research Article - Automation of an excavator boom movement in 3D
 
Stress Analysis Project 01
Stress Analysis Project 01Stress Analysis Project 01
Stress Analysis Project 01
 
Aircraft Loads 5 Report
Aircraft Loads 5 ReportAircraft Loads 5 Report
Aircraft Loads 5 Report
 
Finite Element Model Establishment and Strength Analysis of Crane Boom
Finite Element Model Establishment and Strength Analysis of Crane  BoomFinite Element Model Establishment and Strength Analysis of Crane  Boom
Finite Element Model Establishment and Strength Analysis of Crane Boom
 
T130403141145
T130403141145T130403141145
T130403141145
 
J1304036065
J1304036065J1304036065
J1304036065
 
finalreportedit.docx
finalreportedit.docxfinalreportedit.docx
finalreportedit.docx
 
Design-Proposal-Gillespie
Design-Proposal-GillespieDesign-Proposal-Gillespie
Design-Proposal-Gillespie
 
Struds 2010(aug)
Struds 2010(aug)Struds 2010(aug)
Struds 2010(aug)
 
JGrass-NewAge water budget
JGrass-NewAge water budget JGrass-NewAge water budget
JGrass-NewAge water budget
 
paper
paperpaper
paper
 
Open Pit Design Analysis
Open Pit Design AnalysisOpen Pit Design Analysis
Open Pit Design Analysis
 
Matrices and row operations 12123 and applications of matrices
Matrices and row operations 12123 and applications of matricesMatrices and row operations 12123 and applications of matrices
Matrices and row operations 12123 and applications of matrices
 
Profiles (longitudinal section) & cross sections
Profiles (longitudinal section) & cross sectionsProfiles (longitudinal section) & cross sections
Profiles (longitudinal section) & cross sections
 
s1233587_Report
s1233587_Reports1233587_Report
s1233587_Report
 
INFLUENCE LINES.pdf
INFLUENCE LINES.pdfINFLUENCE LINES.pdf
INFLUENCE LINES.pdf
 
Baja example
Baja exampleBaja example
Baja example
 
Bode
BodeBode
Bode
 
1 P a g e 2105 ENG, Mechanics of.docx
1  P a g e   2105 ENG, Mechanics of.docx1  P a g e   2105 ENG, Mechanics of.docx
1 P a g e 2105 ENG, Mechanics of.docx
 
ES3323 - Project 2 Report - Reverse Engineering a Gear Shaft
ES3323 - Project 2 Report - Reverse Engineering a Gear ShaftES3323 - Project 2 Report - Reverse Engineering a Gear Shaft
ES3323 - Project 2 Report - Reverse Engineering a Gear Shaft
 

Recently uploaded

Antenna efficency lecture course chapter 3.pdf
Antenna  efficency lecture course chapter 3.pdfAntenna  efficency lecture course chapter 3.pdf
Antenna efficency lecture course chapter 3.pdf
AbrahamGadissa
 
RS Khurmi Machine Design Clutch and Brake Exercise Numerical Solutions
RS Khurmi Machine Design Clutch and Brake Exercise Numerical SolutionsRS Khurmi Machine Design Clutch and Brake Exercise Numerical Solutions
RS Khurmi Machine Design Clutch and Brake Exercise Numerical Solutions
Atif Razi
 
Standard Reomte Control Interface - Neometrix
Standard Reomte Control Interface - NeometrixStandard Reomte Control Interface - Neometrix
Standard Reomte Control Interface - Neometrix
Neometrix_Engineering_Pvt_Ltd
 
Hall booking system project report .pdf
Hall booking system project report  .pdfHall booking system project report  .pdf
Hall booking system project report .pdf
Kamal Acharya
 
LIGA(E)11111111111111111111111111111111111111111.ppt
LIGA(E)11111111111111111111111111111111111111111.pptLIGA(E)11111111111111111111111111111111111111111.ppt
LIGA(E)11111111111111111111111111111111111111111.ppt
ssuser9bd3ba
 
power quality voltage fluctuation UNIT - I.pptx
power quality voltage fluctuation UNIT - I.pptxpower quality voltage fluctuation UNIT - I.pptx
power quality voltage fluctuation UNIT - I.pptx
ViniHema
 
CFD Simulation of By-pass Flow in a HRSG module by R&R Consult.pptx
CFD Simulation of By-pass Flow in a HRSG module by R&R Consult.pptxCFD Simulation of By-pass Flow in a HRSG module by R&R Consult.pptx
CFD Simulation of By-pass Flow in a HRSG module by R&R Consult.pptx
R&R Consult
 

Recently uploaded (20)

CME397 Surface Engineering- Professional Elective
CME397 Surface Engineering- Professional ElectiveCME397 Surface Engineering- Professional Elective
CME397 Surface Engineering- Professional Elective
 
Sachpazis:Terzaghi Bearing Capacity Estimation in simple terms with Calculati...
Sachpazis:Terzaghi Bearing Capacity Estimation in simple terms with Calculati...Sachpazis:Terzaghi Bearing Capacity Estimation in simple terms with Calculati...
Sachpazis:Terzaghi Bearing Capacity Estimation in simple terms with Calculati...
 
Democratizing Fuzzing at Scale by Abhishek Arya
Democratizing Fuzzing at Scale by Abhishek AryaDemocratizing Fuzzing at Scale by Abhishek Arya
Democratizing Fuzzing at Scale by Abhishek Arya
 
Antenna efficency lecture course chapter 3.pdf
Antenna  efficency lecture course chapter 3.pdfAntenna  efficency lecture course chapter 3.pdf
Antenna efficency lecture course chapter 3.pdf
 
RS Khurmi Machine Design Clutch and Brake Exercise Numerical Solutions
RS Khurmi Machine Design Clutch and Brake Exercise Numerical SolutionsRS Khurmi Machine Design Clutch and Brake Exercise Numerical Solutions
RS Khurmi Machine Design Clutch and Brake Exercise Numerical Solutions
 
fluid mechanics gate notes . gate all pyqs answer
fluid mechanics gate notes . gate all pyqs answerfluid mechanics gate notes . gate all pyqs answer
fluid mechanics gate notes . gate all pyqs answer
 
A CASE STUDY ON ONLINE TICKET BOOKING SYSTEM PROJECT.pdf
A CASE STUDY ON ONLINE TICKET BOOKING SYSTEM PROJECT.pdfA CASE STUDY ON ONLINE TICKET BOOKING SYSTEM PROJECT.pdf
A CASE STUDY ON ONLINE TICKET BOOKING SYSTEM PROJECT.pdf
 
Standard Reomte Control Interface - Neometrix
Standard Reomte Control Interface - NeometrixStandard Reomte Control Interface - Neometrix
Standard Reomte Control Interface - Neometrix
 
Student information management system project report ii.pdf
Student information management system project report ii.pdfStudent information management system project report ii.pdf
Student information management system project report ii.pdf
 
Vaccine management system project report documentation..pdf
Vaccine management system project report documentation..pdfVaccine management system project report documentation..pdf
Vaccine management system project report documentation..pdf
 
Hall booking system project report .pdf
Hall booking system project report  .pdfHall booking system project report  .pdf
Hall booking system project report .pdf
 
WATER CRISIS and its solutions-pptx 1234
WATER CRISIS and its solutions-pptx 1234WATER CRISIS and its solutions-pptx 1234
WATER CRISIS and its solutions-pptx 1234
 
LIGA(E)11111111111111111111111111111111111111111.ppt
LIGA(E)11111111111111111111111111111111111111111.pptLIGA(E)11111111111111111111111111111111111111111.ppt
LIGA(E)11111111111111111111111111111111111111111.ppt
 
Scaling in conventional MOSFET for constant electric field and constant voltage
Scaling in conventional MOSFET for constant electric field and constant voltageScaling in conventional MOSFET for constant electric field and constant voltage
Scaling in conventional MOSFET for constant electric field and constant voltage
 
power quality voltage fluctuation UNIT - I.pptx
power quality voltage fluctuation UNIT - I.pptxpower quality voltage fluctuation UNIT - I.pptx
power quality voltage fluctuation UNIT - I.pptx
 
İTÜ CAD and Reverse Engineering Workshop
İTÜ CAD and Reverse Engineering WorkshopİTÜ CAD and Reverse Engineering Workshop
İTÜ CAD and Reverse Engineering Workshop
 
NO1 Pandit Amil Baba In Bahawalpur, Sargodha, Sialkot, Sheikhupura, Rahim Yar...
NO1 Pandit Amil Baba In Bahawalpur, Sargodha, Sialkot, Sheikhupura, Rahim Yar...NO1 Pandit Amil Baba In Bahawalpur, Sargodha, Sialkot, Sheikhupura, Rahim Yar...
NO1 Pandit Amil Baba In Bahawalpur, Sargodha, Sialkot, Sheikhupura, Rahim Yar...
 
CFD Simulation of By-pass Flow in a HRSG module by R&R Consult.pptx
CFD Simulation of By-pass Flow in a HRSG module by R&R Consult.pptxCFD Simulation of By-pass Flow in a HRSG module by R&R Consult.pptx
CFD Simulation of By-pass Flow in a HRSG module by R&R Consult.pptx
 
ASME IX(9) 2007 Full Version .pdf
ASME IX(9)  2007 Full Version       .pdfASME IX(9)  2007 Full Version       .pdf
ASME IX(9) 2007 Full Version .pdf
 
Construction method of steel structure space frame .pptx
Construction method of steel structure space frame .pptxConstruction method of steel structure space frame .pptx
Construction method of steel structure space frame .pptx
 

Deriner Arch Dam Geometry Solution with a software developed by Taner Cigdem

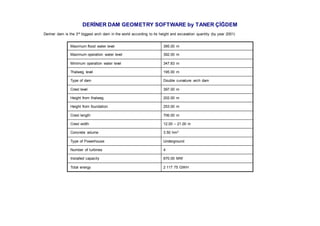
  • 1. DERİNER DAM GEOMETRY SOFTWARE by TANER ÇİĞDEM Deriner dam is the 3rd biggest arch dam in the world according to its height and excavation quantity (by year 2001) Maximum flood water level 395.00 m Maximum operation water level 392.00 m Minimum operation water level 347.83 m Thalweg level 195.00 m Type of dam Double curvature arch dam Crest level 397.00 m Height from thalweg 202.00 m Height from foundation 253.00 m Crest length 706.00 m Crest width 12.00 – 21.00 m Concrete volume 3.50 hm3 Type of Powerhouse Underground Number of turbines 4 Installed capacity 670.00 MW Total energy 2 117 75 GWH
  • 2. GEOMETRICAL DEFINITION OF THE FINAL OPTIMISED DAM DESIGN DAM AXIS LOCATION The dam geometry is defined with respect to (w.r.t.) a local co-ordinate system (U, V), where U is positive in the upstream – downstream direction and V is positive in the left – right bank cross-valley direction. These co-ordinates may be transformed to a global (Y, X) system that is equivalent to the country co- ordinate system (N, E). The origin of the local co-ordinate system has the following local and global co-ordinates: UO = 0.0000; YO = 4559061.9870 VO = 0.0000; XO = 488293.7154 Where subscript "o" represents "Origin". The orientation of the dam within the valley is defined by the global azimuth Az (grad) where: Az = 369.44444g The global azimuth is measured w.r.t. the global N or Y axis in a clockwise direction to the local U axis. A key point in the geometrical definition of the dam is the point P, which defines the intersection of the crest elevation arch and the crown cantilever section. The co-ordinates of this point are given by: UP = 200.0000; YP = 4559701.1378 VP = 1000.0000; XP = 489088.3765 Where subscript "p" represents the "Dam Reference Point" P. LOCAL – GLOBAL TRANSFORMATION SYSTEM All co-ordinates can be described in both the local and global co-ordinate systems (N, E) using the following transformation equations: Local to Global Y = YO + U cos (Az) – V sin (Az) (2.1) X = XO + U sin (Az) + V cos (Az) (2.2) Global to Local U = (YO – Y) cos (Az) + (XO – X) sin (Az) (2.3) V = -(YO – Y) sin (Az) + (XO – X) cos (Az) (2.4)
  • 3. DAM GEOMETRY The dam geometry is split into two main parts. The first defines the main dam arches without thickening using horizontal parabolas and the second defines abutment thickening using horizontal side parabolas. DEFINITION OF MAIN SECTIONS USING PARABOLAS The definition of the dam geometry involves firstly defining an appropriate crown cantilever section, which in turn defines thickening and mid-surface curves as presented in figure 1. In the case where abutment thickening is not required, both the upstream and downstream faces of the dam are defined using simple parabolic formulas. The parabola parameters Pi, (i = 1 (upstream face), i = 2 (downstream face)), which are based on the definition of the main axis line Uo, vary over the height of the dam as indicates in figure 1. The following notation is used: U0 = Local U co-ordinate of the centre of curvature of the main parabola. U1 = Local U co-ordinate of the apex of the upstream parabola. U2 = Local U co-ordinate of the apex of the downstream parabola. P1 = Main upstream parabola parameter. P2 = Main downstream parabola parameter. t = dam thickness. k = dam mid-surface axis at the main section. z = height (elevation (m.a.s.l.) – 146 (m.a.s.l.).) Figure 1. Definition of Main Parabolas and Crown Cantilever Section
  • 4. DEFINITION OF ABUTMENT THICKENING USING SIDE PARABOLAS Abutment thickening is added to the main downstream parabolas using side parabolas. The objective is to define a side parabola, which is tangent to the main parabola and gives a uniform increase in abutment thickening over the entire height of the dam. Figure 2 presents the basic concept of the side parabolas along with the notation used in geometrical equations. The following notation applies in figure 2: C0 (U0, V0) = Co-ordinate of the centre of the circle of curvature of the main parabola. CR (UCR, VCR)= Co-ordinate of the centre of the circle of curvature of the right bank side parabola. CL (UCL, VCL)= Co-ordinate of the centre of the circle of curvature of the left bank side parabola. TR (UTR, VTR)= Co-ordinate of the point of contact between the main downstream parabola and the right bank side parabola. TL (UTL, VTL)= Co-ordinate of the point of contact between the main downstream parabola and the left bank side parabola. PL = Left bank side parabola parameter. PL = (UCL – U3) PR = Left bank side parabola parameter. PR = (UCR – U4) Figure 2. Definition of Side Parabolas for Abutment Thickening
  • 5. OVERVIEW OF THE SOFTWARE The geometry of the dam is defined between el. 146 and 397 and the concreting lifts are as follows: - 146 - 147 - Intermediate lifts every 3 m from 147 to 393. - 393 - 395 - 395 - 397 The program has 4 sections: 1. Horizontal 2. Vertical 3. Block 4. Formwork General Notes:  Before using any section, the user should decide which coordinate system to use. It is done by the "Dam Locals" and "Global" option buttons. And right of the "Global" option is the "Zoom Method" box, which is used for defining the zoom method when the user presses the "Zoom" button.  When the user uses "Block" or "Formwork" sections the program draws the geometry and in the mean time it makes all necessary calculations for the dam, the user can then save this data to an Excel File by pressing the "Save" button.  Anytime the user wants to erase the objects in AutoCAD, can press the "Erase" button.  After using the program the user can apply standard AutoCAD commands to the drawings, like changing the views, 3D orbiting, rotating, …
  • 6. 1. Horizontal This section is intended for producing horizontal sections. Figure 3 shows a typical section for a given elevation, the parabola is formed by given "Number of Points". After producing the cross section the user can press the datum button to indicate the centre, tangent and apex points of the parabolas. "Draw 3 More Joints" checkbox is for the decision stage of the dam blocks for each elevation. Figure 3. Typical horizontal section
  • 7. 2. Vertical This section is intended for producing vertical sections. Figure 4 shows a typical plane section for a given joint. Joint numbers are between 1 and 40 from left to right. If the user wants a 3D vertical section, he can check the "Draw 3D" checkbox. Figure 5 shows all the vertical cross sections of the dam in a 3D view. Figure 4. Plane vertical section of joint 21
  • 8. Figure 5. 3D vertical sections of all joints
  • 9. 3. Block This section is intended for drawing near theoretical blocks, finding the areas of each sides of the blocks, the corner and origin coordinates and the concrete volumes of the blocks. If both "All Elevations" and "All Blocks" boxes are unchecked, the user has to define the "Lower Elevation" and "Block No" textboxes. The program finds the upper elevation of the block according to the concreting lifts mentioned above. And this will draw a specific bay for the given data (Figure 6). "All Elevations" option is for drawing a specific block in all elevations from the excavation surface to the crest elevation (Figure 7). "All Blocks" option is for drawing all blocks for a given elevation (Figure 8). If both of these boxes are checked the program will draw all dam (Figure 9). "Last elevation" textbox is for restricting the stop elevation in whole-drawing options, "Lower Elevation" textbox can also affect the start elevation in whole-drawings. "No of Points" defines the vertex number of both upstream and downstream parabolas, higher values approach to the theoretical parabola. Figure 6.
  • 13. 4. Formwork This section works like the "Block" section. The difference is, "Block" section draws the parabolas by dividing them into fac e divisions by the given "No of Points" and the "Formwork" section works based on the given "Form Length" in meters. This section draws the formworks from left to right for blocks >= 21 and from right to left for the others. Its working structure is to find the intersection points of the formworks with the parabolas and to cross to the other corner of the block by placing each formwork like that. The "All Elevations" and the "All Blocks" checkboxes work the same as "Block" section. And if the user wants to draw all formworks, he can check the "Draw Formworks" checkbox (Figure 10), then the user can easily "Shade" and "Render" the drawings in AutoCAD. The "Max" notation shows the maximum openings of the formworks from the parabolas for each face and elevation for that bay. The user can restrict the maximum opening by entering in the "Tolerance" textbox in "cm". When the program finds a face exceeding this value it draws the same bay with the given "Alternative Form Length" and of a different colour. The program is now adjusted to use "Alternative Form Length" in bays where parabolas are tangent, the others are eliminated. The user should check the Excel File to see if there still exist some bays exceeding the "Tolerance" value, if so he has to change the standard form lengths by trying. This is useful for finding the optimal form length of the dam. If the user wants to see the parabolas and the formworks together he can leave the "Erase Parabolas" checkbox unchecked. The save data includes all faces form lengths, maximum openings, block areas and real concrete volumes.
  • 15. Figure 11. A rendered view of the dam from downstream This software was initially designed as standard executable and was connecting to the AutoCAD by Automation, and has been converted to AutoCAD macro for better and faster performance.