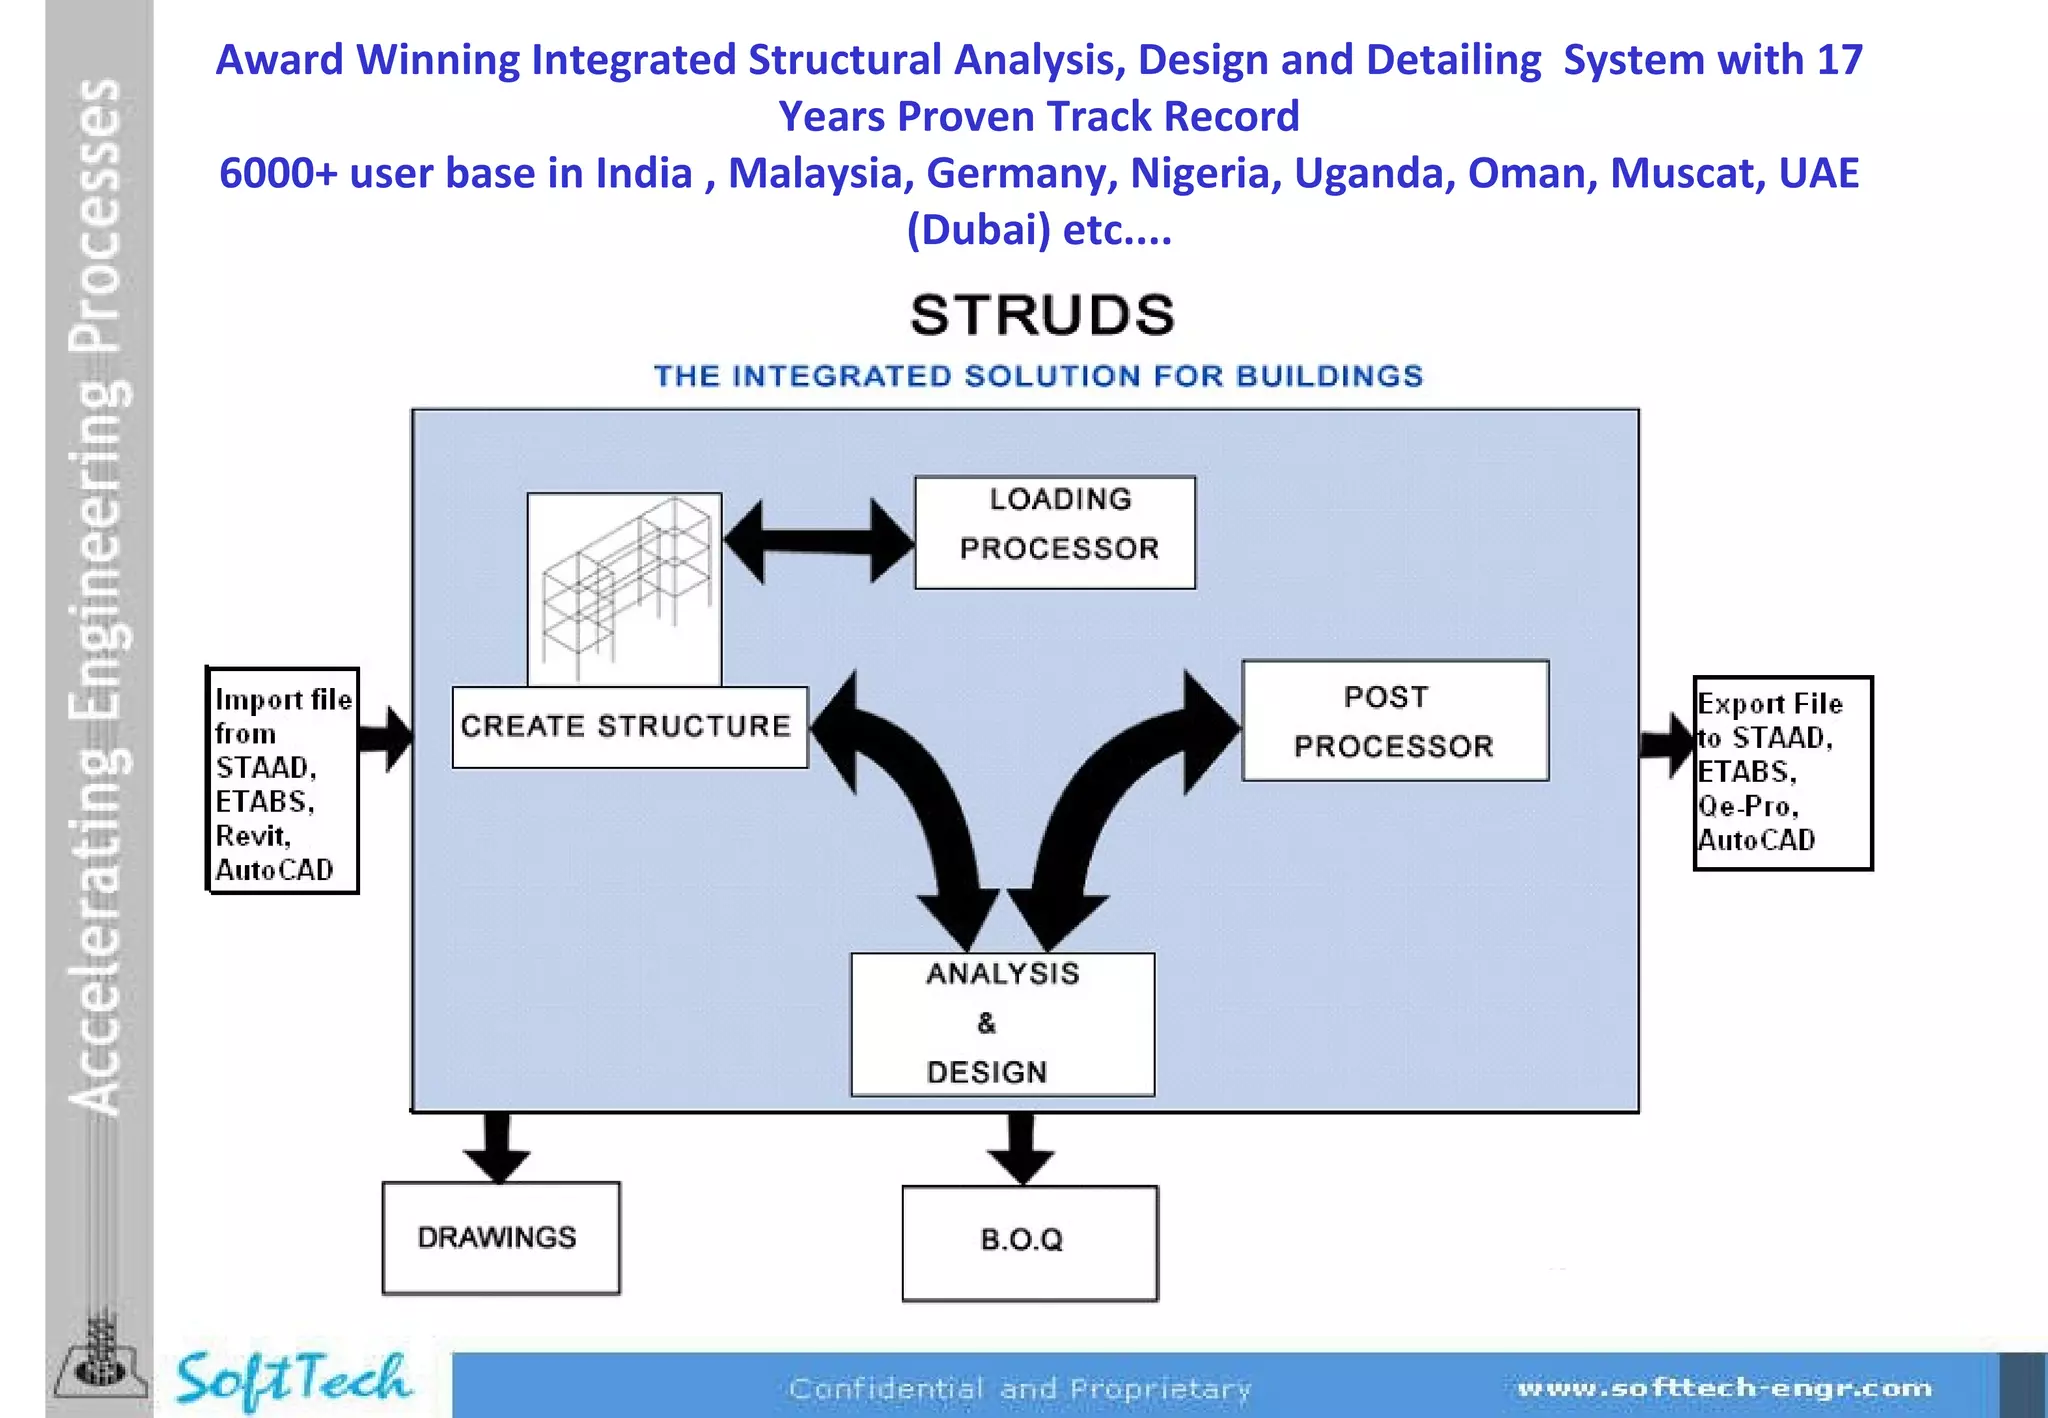
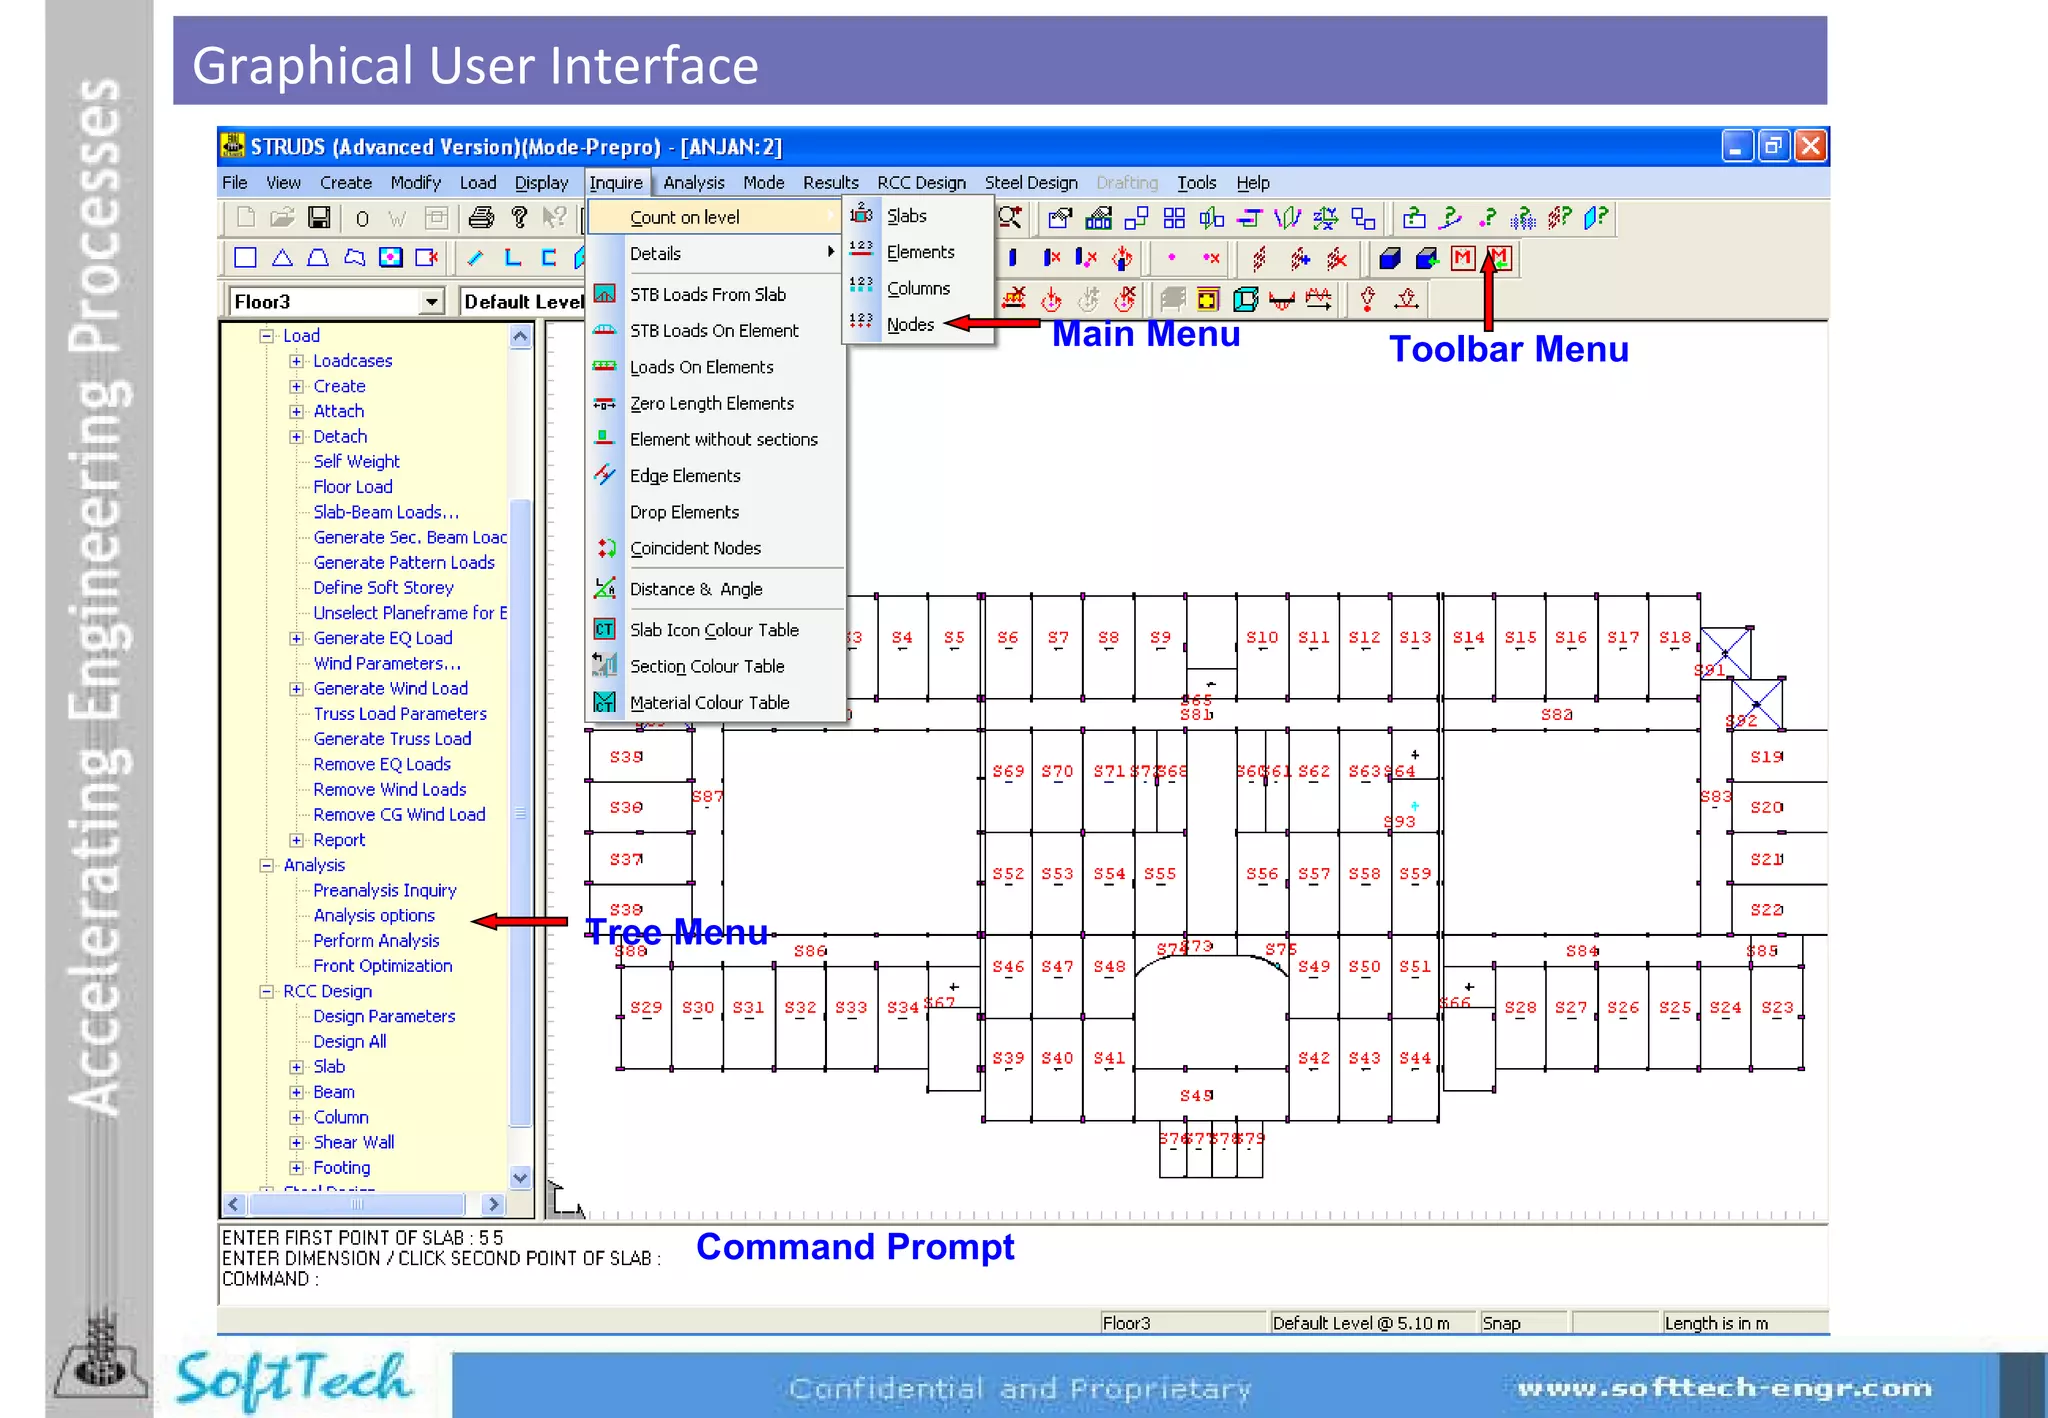
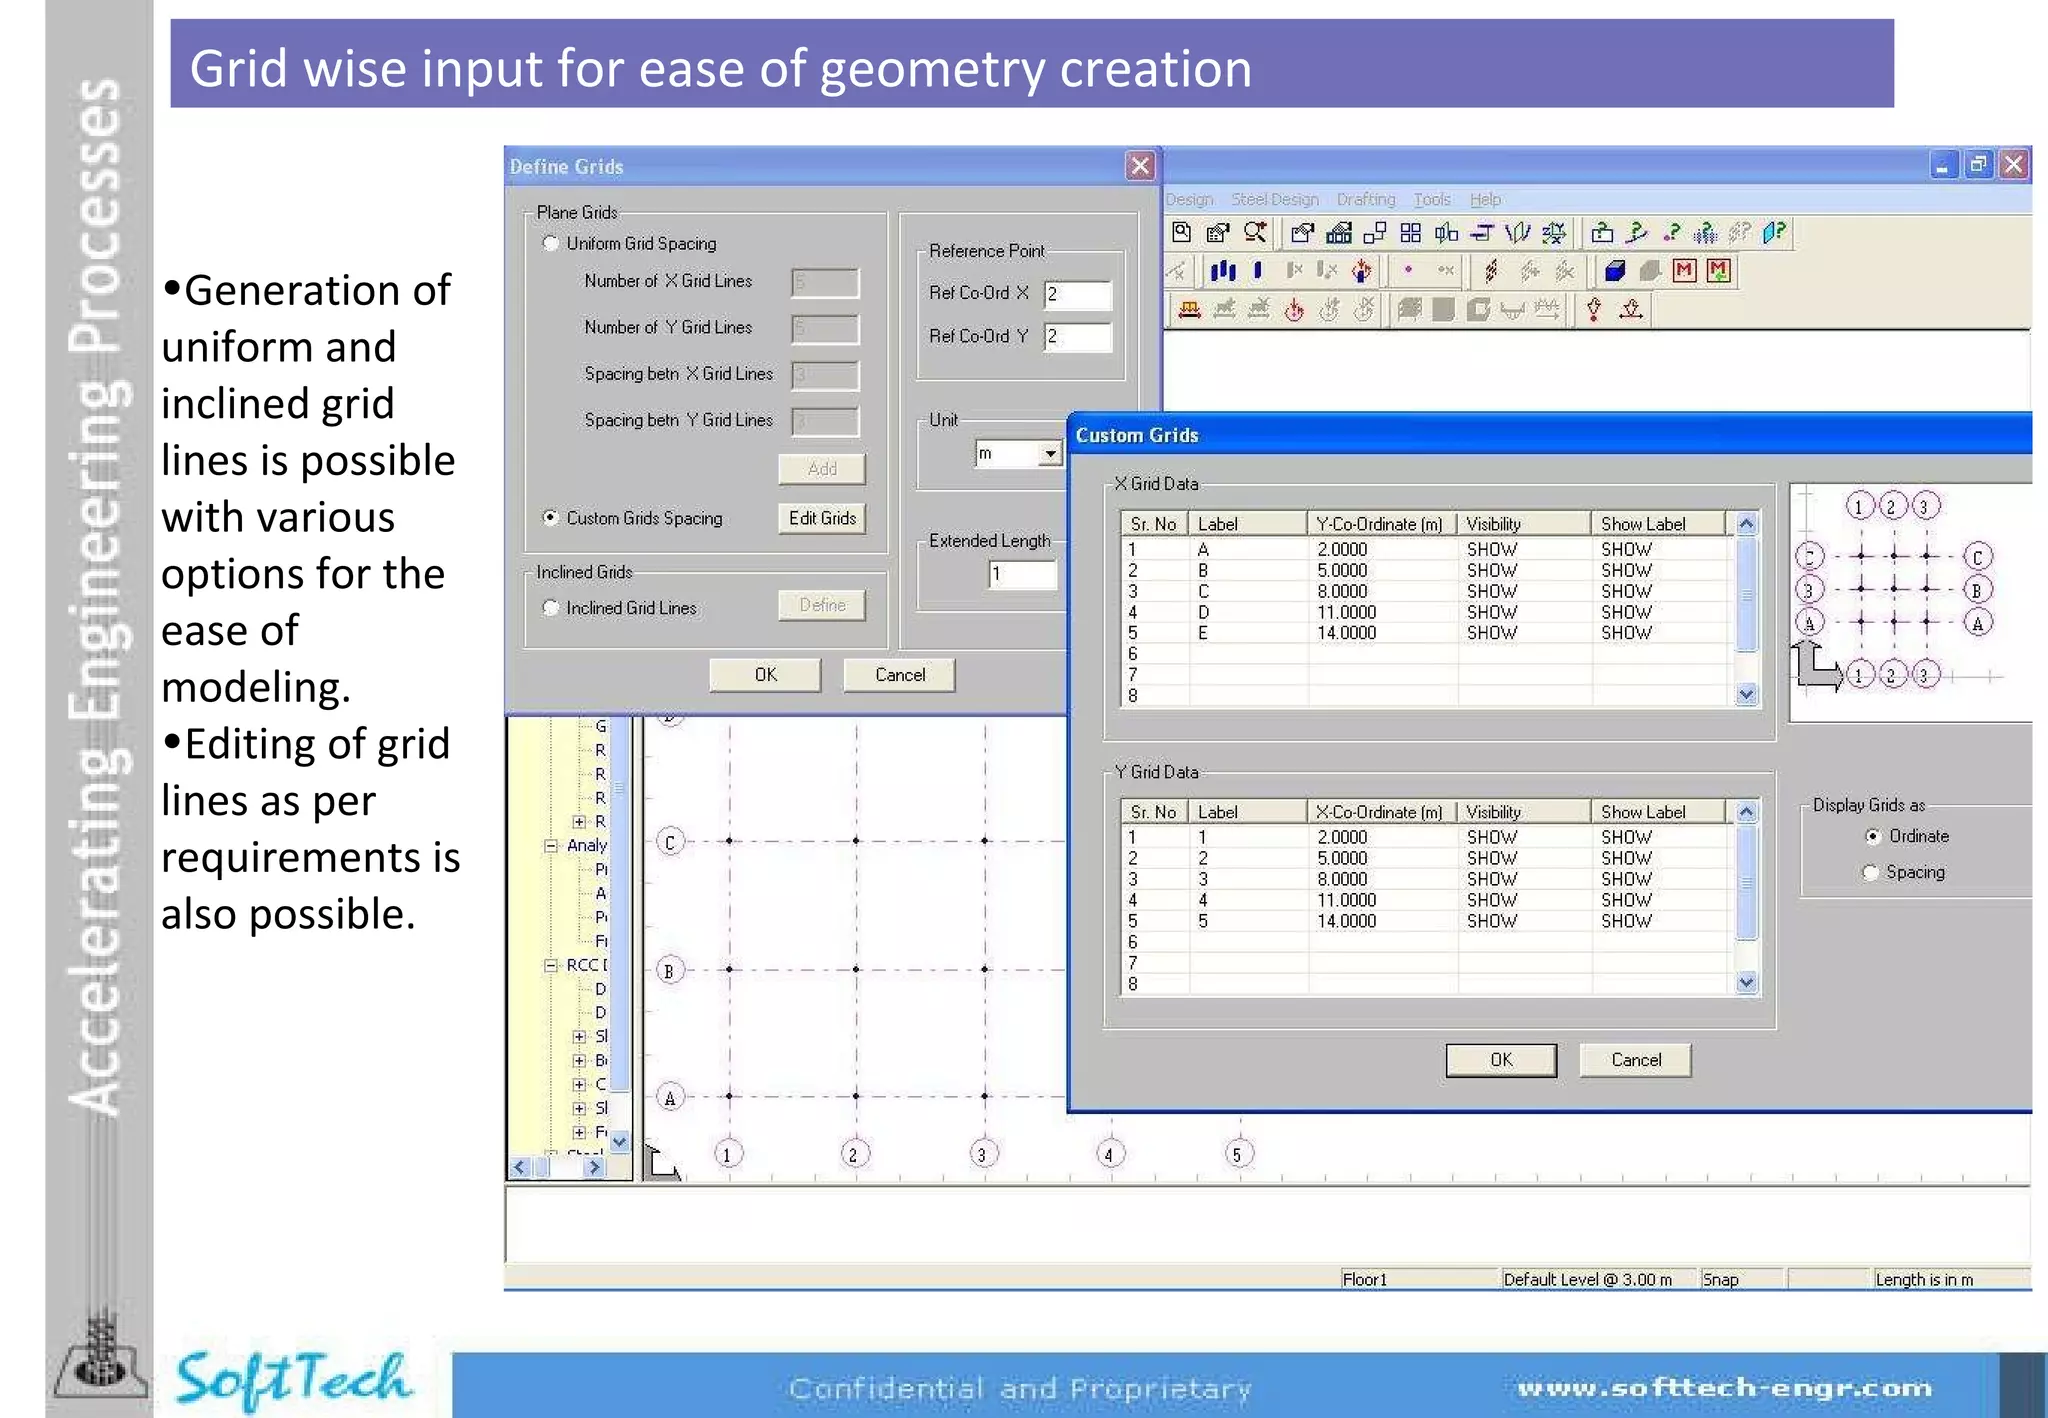
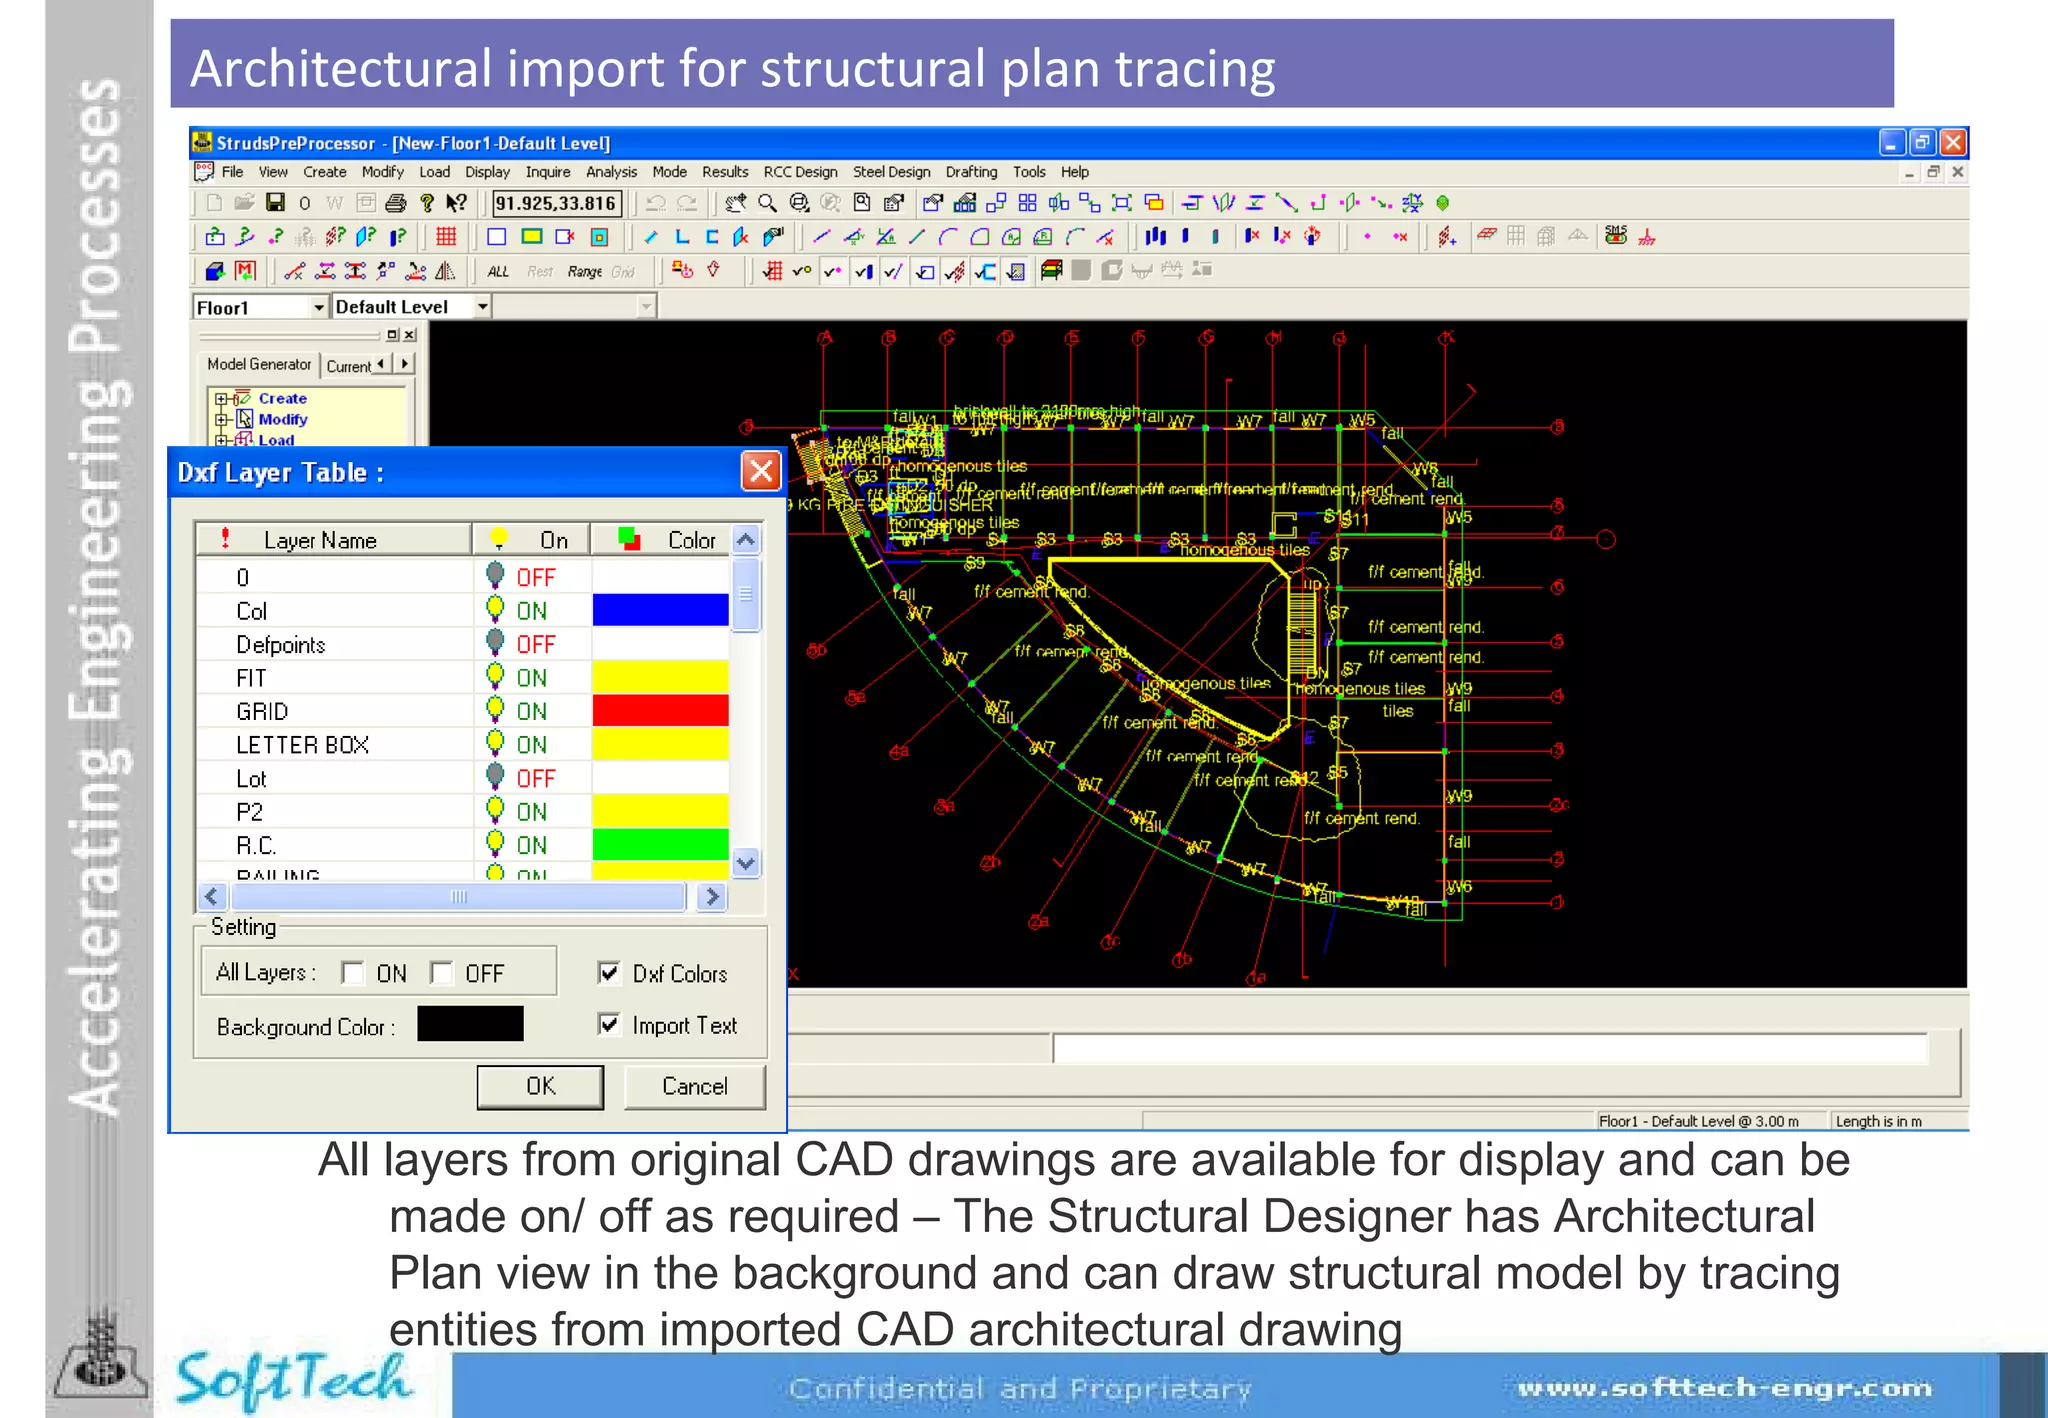
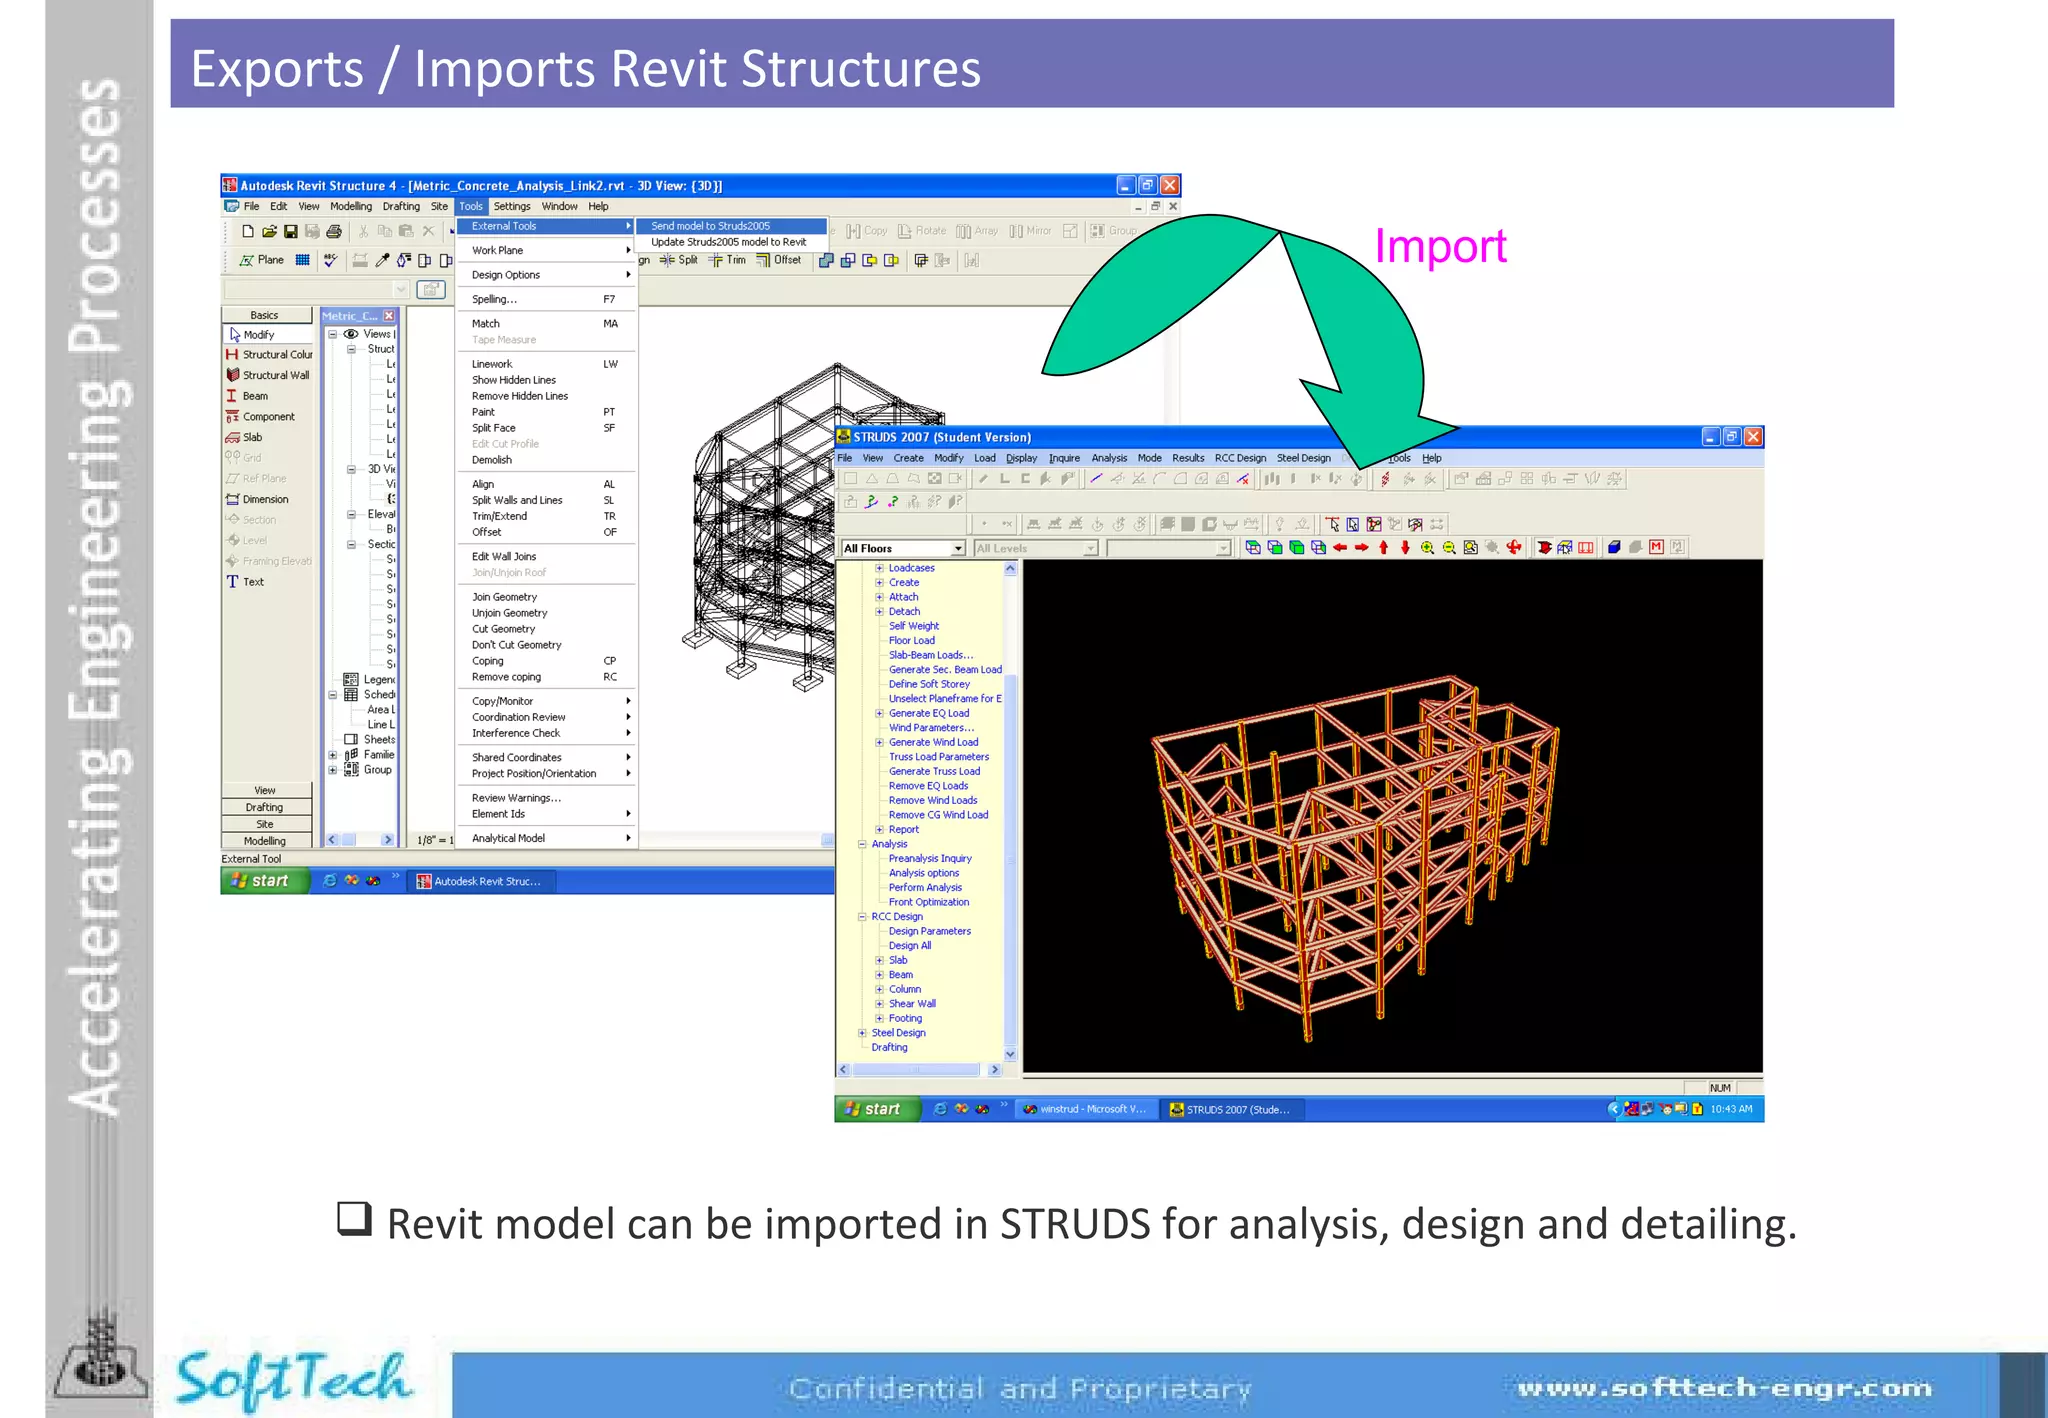
The document provides an overview of the features and capabilities of an integrated structural analysis, design and detailing software system. It describes the software's graphical user interface, modeling features for various structural elements, support for importing/exporting CAD files, dynamic and static analysis methods including earthquake design, and ability to generate reports. The software allows modeling, analysis, design and detailing of structures over 17 years with a global user base of over 6000 users from various countries.


![Facility to consider Vertical Seismic loads, for all the elements marked as Horizontal Cantilevers. The total seismic weight W, acting on the cantilever beam is given as, W = [Sum of all Elemental Dead loads] + [ (Live load reduction factor at the set floor level) * (sum of all Elemental Live Loads)] + [Dead load reaction of Cross Beam] + [(Live load reduction factor) * (Live load reaction of Cross Beam) ] This load is assumed to act at the center of the cantilever beam. The total design vertical seismic force is given as V = (10/3) * Ah * Total Seismic weight However, declaring these elements as cantilevers, will not affect the analysis results at all, and the cantilevering effect will be taken into account only at the design level. Vertical seismic load effects in horizontal cantilevers](https://image.slidesharecdn.com/struds2010aug-110106224320-phpapp02/75/Struds-2010-aug-45-2048.jpg)


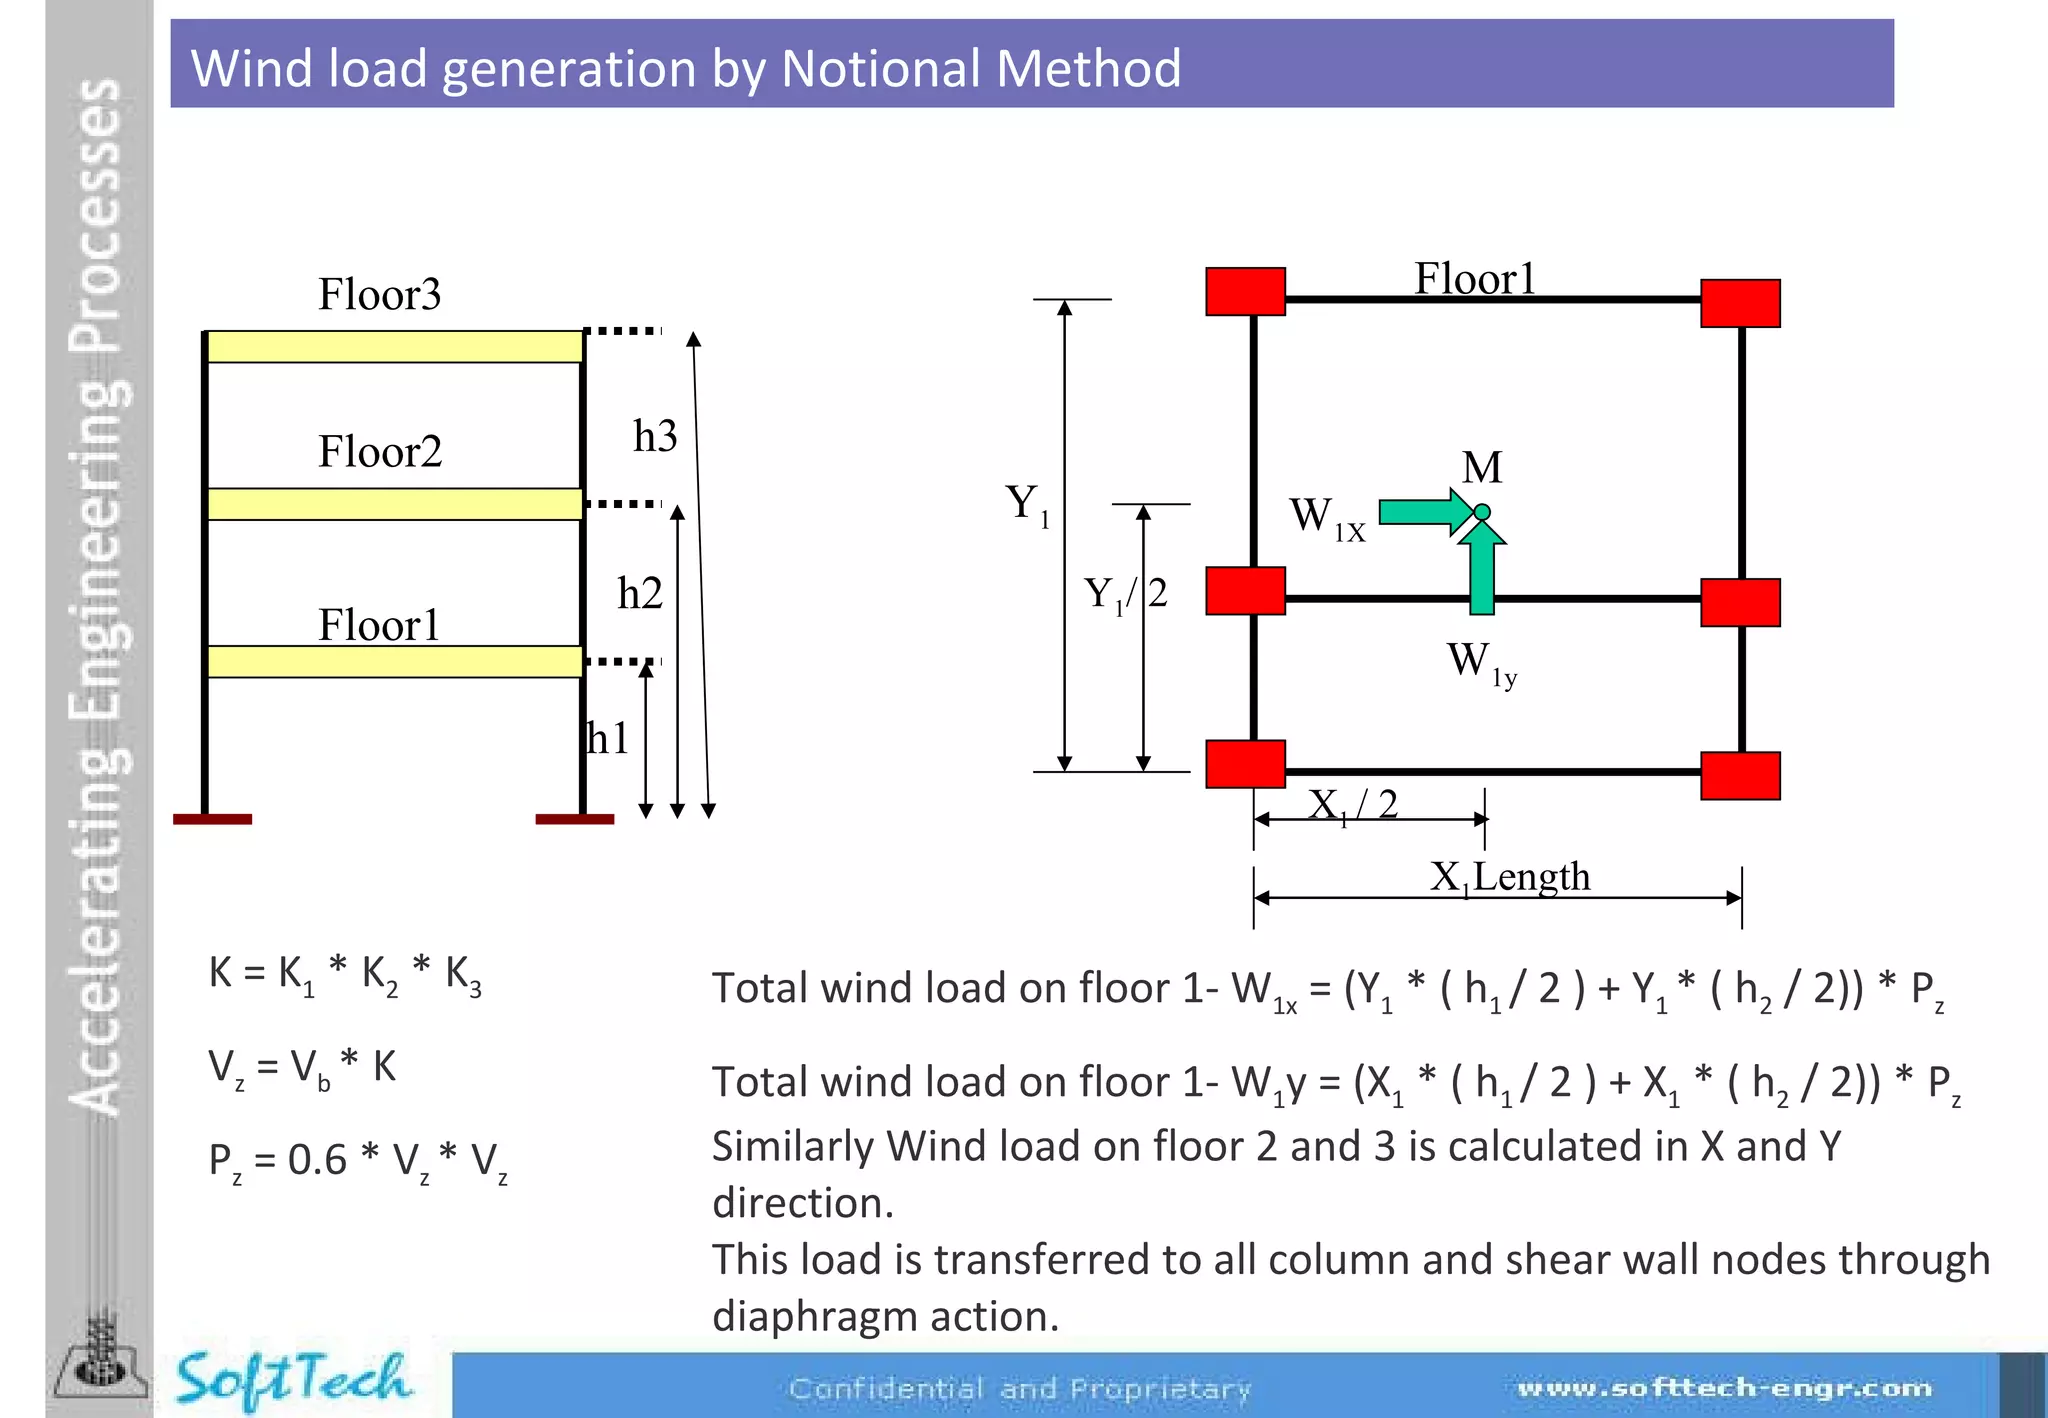
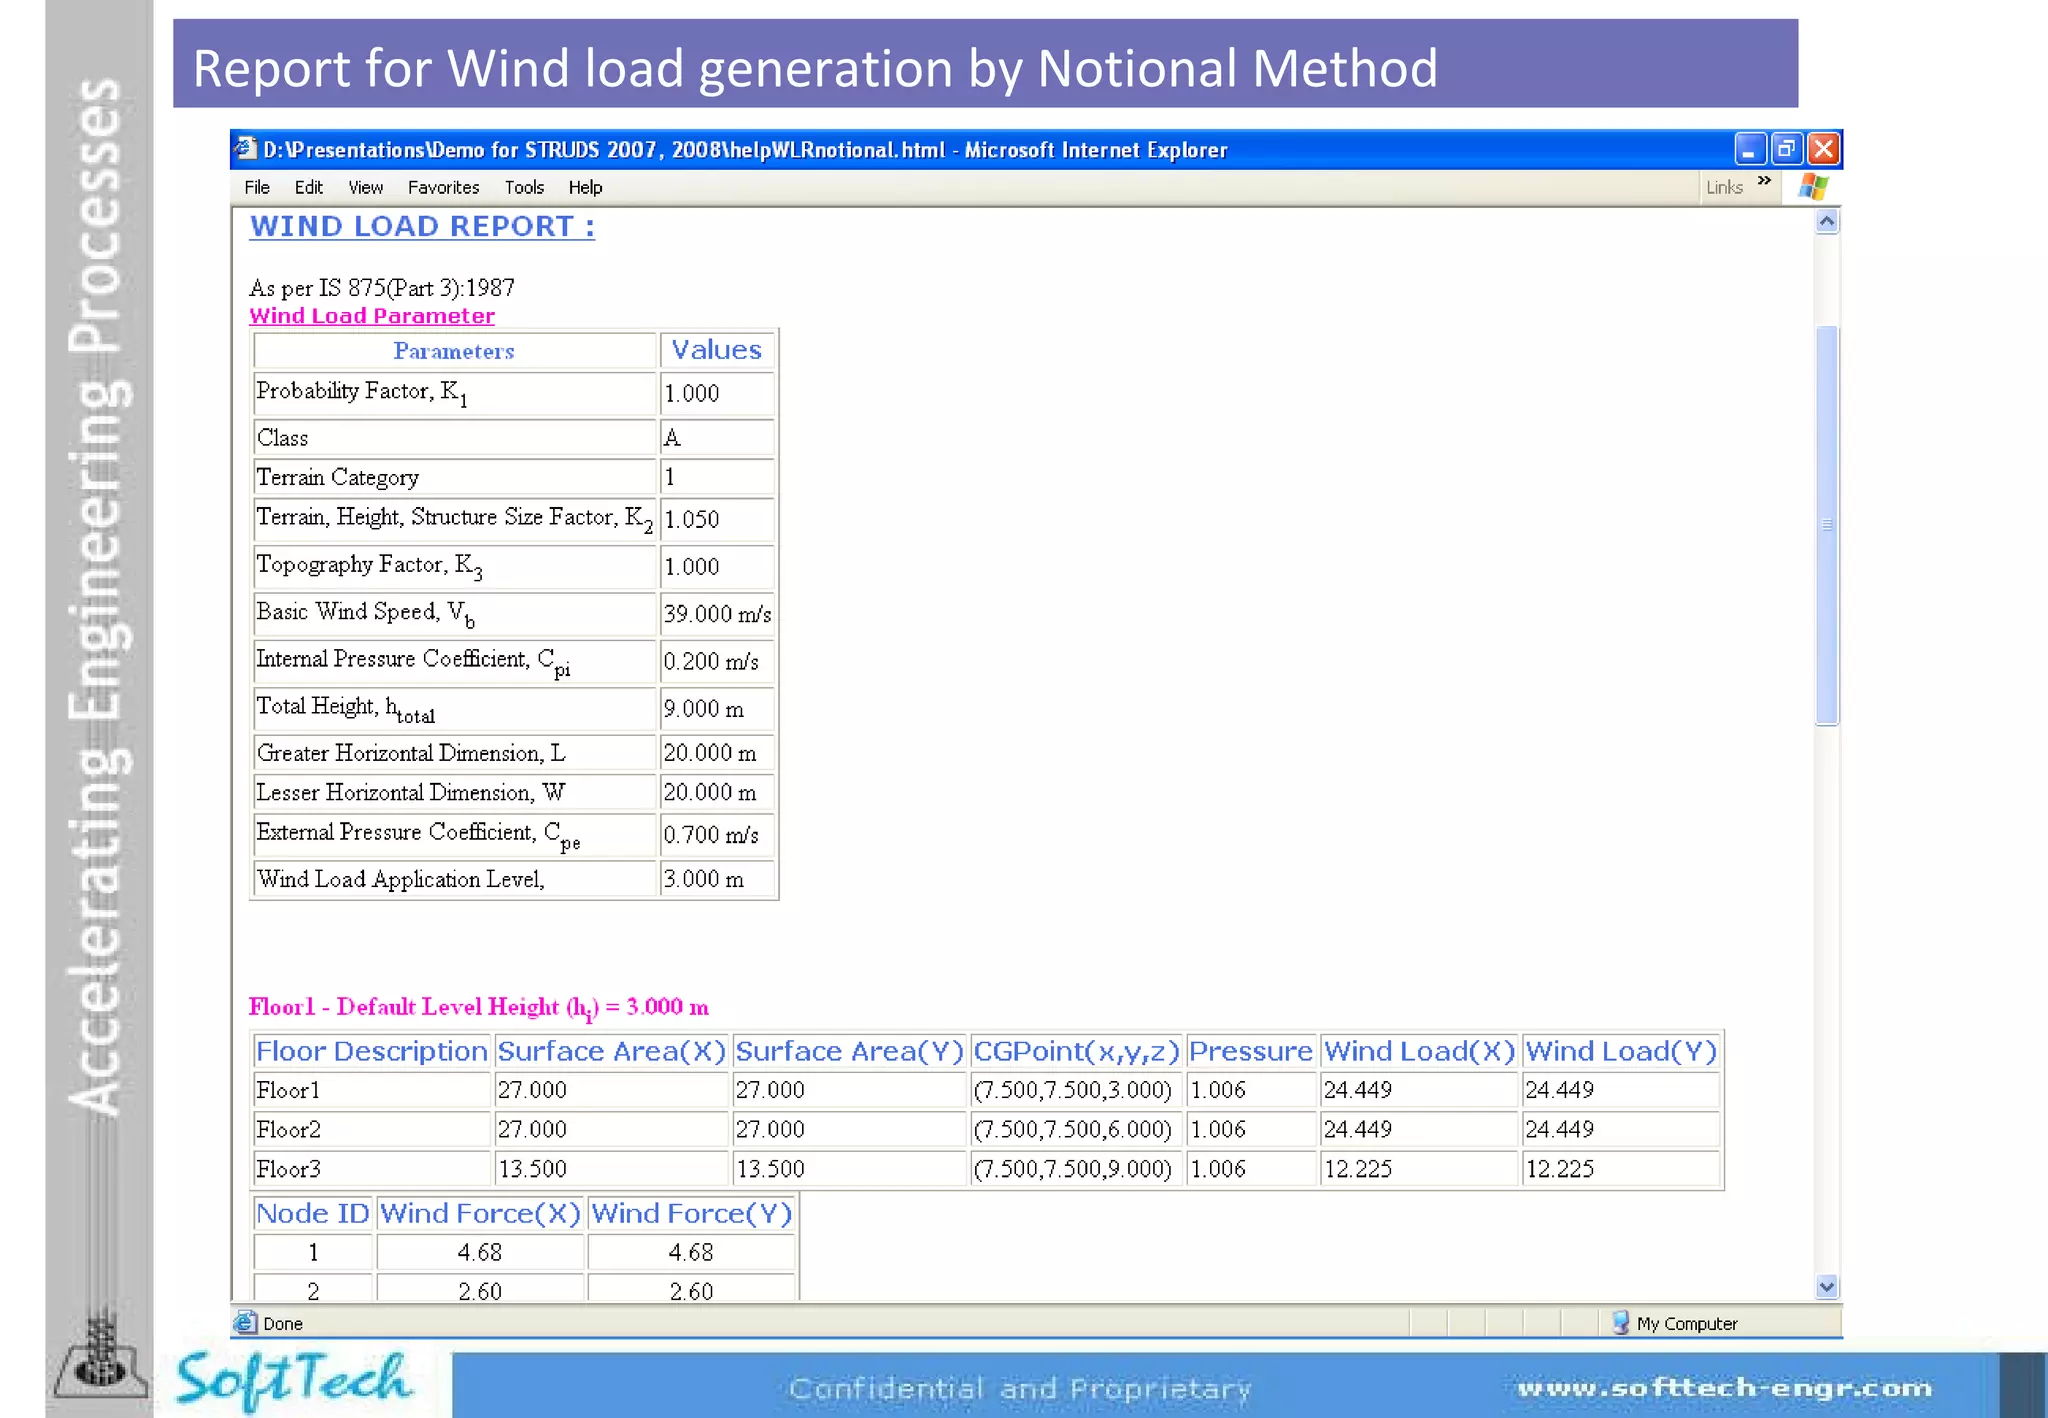
![Wind load generation by Framing Method W1 W2 W3 h1 h2 h3 X 1 X 2 Y 1 Y 2 W 1X W 2X W 3X K = K 1 * K 2 * K 3 V z = V b * K P z = 0.6 * V z * V z W 1x = [Y 1 / 2 * (( h 1 / 2) + ( h 2 / 2))] * P z W 2x = [((Y 1 / 2 ) + (Y 2 / 2 )) * ((h 1 / 2) + (h 2 / 2))] * P z W 1y = [X 1 / 2 * (( h 1 / 2 ) + ( h2 / 2 ))] * P z W 2y = [((X 1 / 2 ) + (X 2 / 2 )) * (( h 1 / 2) + (h 2 / 2 ))] *P z Similarly Wind Load on all frames and all floors is calculated](https://image.slidesharecdn.com/struds2010aug-110106224320-phpapp02/75/Struds-2010-aug-58-2048.jpg)


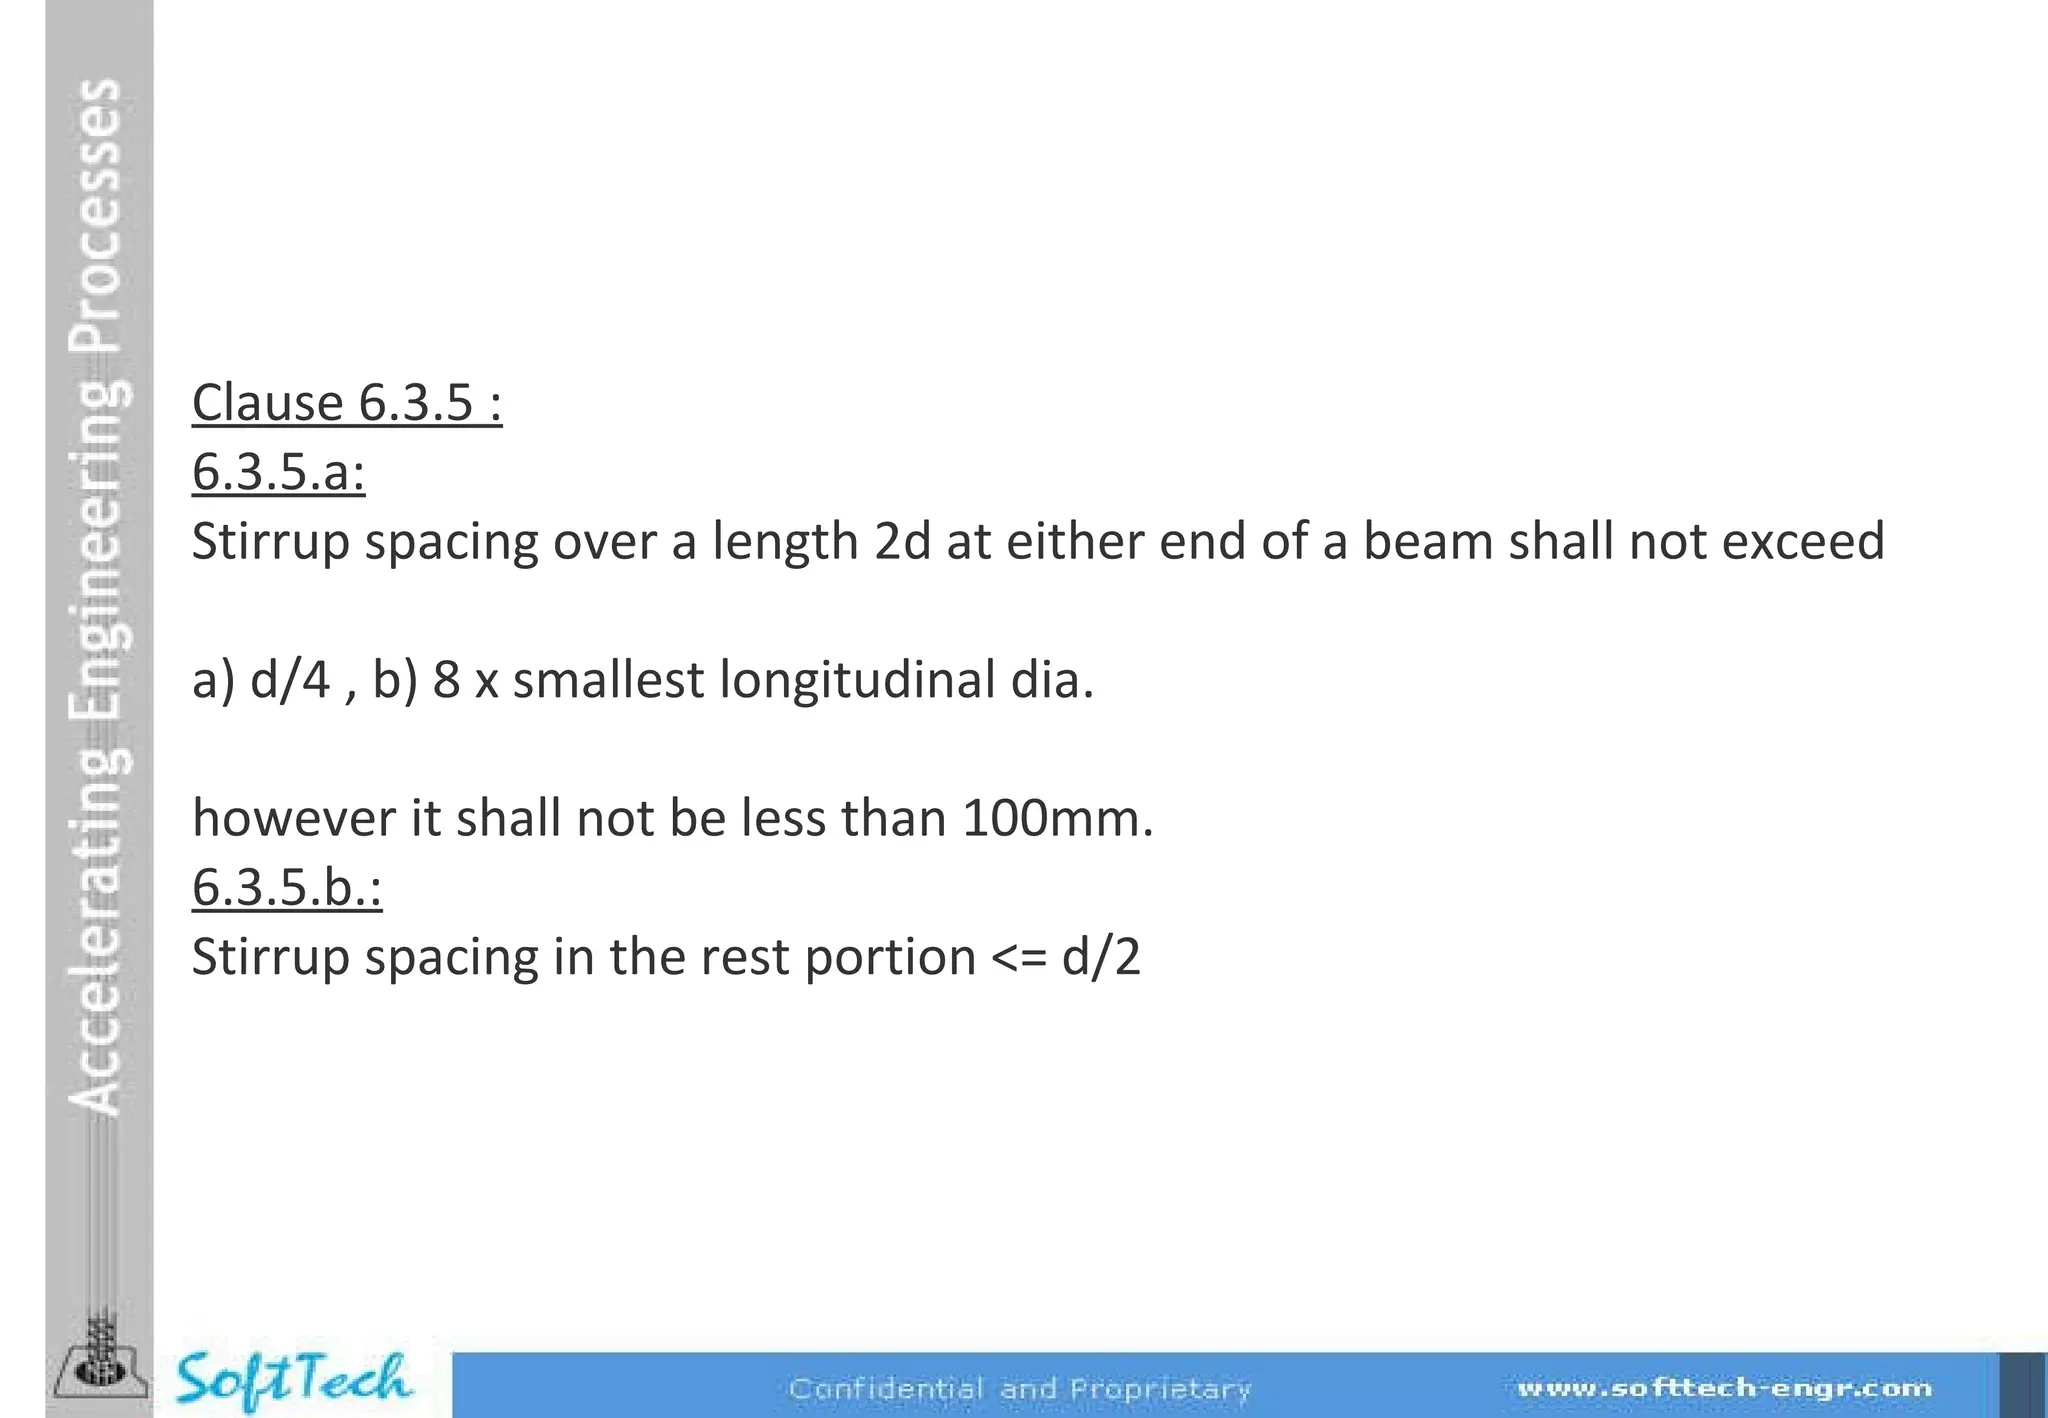
![6.3 Web Reinforcement : Clause 6.3.2 : Minimum diameter of the bar forming a hoop shall be 6 mm. However in beams with clear span exceeding 5 m the minimum bar dia. Shall be 8 mm. Clause 6.3.3 : The Shear force to be resisted by the vertical stirrups shall be the maximum of a) Calculated shear force as per the analysis b) Shear force due to formation of plastic hinges at both ends plus the factored gravity load on the span this is given by i) FOR SWAY TO RIGHT Vua = Va(D+L) - 1.4[(MuAs,lim + MuBh,lim)/LAB] and Vub = Vb(D+L) + 1.4[(MuAs,lim + MuBh,lim)/LAB] ii) FOR SWAY TO LEFT Vua = Va(D+L) + 1.4[(MuAh,lim + MuBs,lim)/LAB] and Vub = Vb(D+L) - 1.4[(MuAh,lim + MuBs,lim)/LAB]](https://image.slidesharecdn.com/struds2010aug-110106224320-phpapp02/75/Struds-2010-aug-84-2048.jpg)


![CleanMyMac X v5.2.8 Crack for MacOS Full Version [Latest] pptx](https://cdn.slidesharecdn.com/ss_thumbnails/softwareoverview-251207194121-a81f0142-thumbnail.jpg?width=640&height=640&fit=bounds)
![iStat Menus 7.20 Crack for MacOS 2026 Full Version [Latest] pptx](https://cdn.slidesharecdn.com/ss_thumbnails/softwareoverview-251207191544-22b737dc-thumbnail.jpg?width=640&height=640&fit=bounds)
![Moho Pro 14.4 Crack for MacOS Works Until 2050 [Latest] pptx](https://cdn.slidesharecdn.com/ss_thumbnails/softwareoverview-251207192639-797289c4-thumbnail.jpg?width=640&height=640&fit=bounds)

![Driver Easy Pro Key 7.1.0.2641 Full Mac Crack Free Activated Download [2026]....](https://cdn.slidesharecdn.com/ss_thumbnails/software-251207185324-b2fb71b4-thumbnail.jpg?width=640&height=640&fit=bounds)

![WinRAR Crack 7.13 Final Mac Keygen 2026 Download [Latest] Software.pptx](https://cdn.slidesharecdn.com/ss_thumbnails/software-251207185858-eb450678-thumbnail.jpg?width=640&height=640&fit=bounds)


